remote sensing Article
Detection of Spatio-Temporal Changes of Norway Spruce Forest Stands in Ore Mountains Using Landsat Time Series and Airborne Hyperspectral Imagery Jan Mišurec 1,2,*, Veronika Kopaˇcková 1, Zuzana Lhotáková 3, Petya Campbell 4 and Jana Albrechtová 3 1 2 3 4
*
Czech Geological Survey, Klárov 3, Prague 118 21, Czech Republic;
[email protected] Faculty of Science, Department of Applied Geoinformatics and Cartography, Charles University, Albertov 6, Prague 128 43, Czech Republic Faculty of Science, Department of Experimental Plant Biology, Charles University, Viniˇcná 5, Prague 128 44, Czech Republic;
[email protected] (Z.L.);
[email protected] (J.A.) Joint Center for Earth Systems Technology, University of Maryland Baltimore County and Biospheric Sciences, NASA Goddard Space Flight Center, Greenbelt, MD 20771, USA;
[email protected] Correspondence:
[email protected]; Tel.: +420-257-089-511
Academic Editors: Ioannis Gitas and Prasad S. Thenkabail Received: 24 November 2015; Accepted: 16 January 2016; Published: 26 January 2016
Abstract: The study focuses on spatio-temporal changes in the physiological status of the Norway spruce forests located at the central and western parts of the Ore Mountains (northwestern part of the Czech Republic), which suffered from severe environmental pollution from the 1970s to the 1990s. The situation started improving after the pollution loads decreased significantly at the end of the 1990s. The general trends in forest recovery were studied using the tasseled cap transformation and disturbance index (DI) extracted from the 1985–2015 time series of Landsat data. In addition, 16 vegetation indices (VIs) extracted from airborne hyperspectral (HS) data acquired in 1998 using the Advanced Solid-State Array Spectroradiometer (ASAS) and in 2013 using the Airborne Prism Experiment (APEX) were used to study changes in forest health. The forest health status analysis of HS image data was performed at two levels of spatial resolution; at a tree level (original 2.0 m spatial resolution), as well as at a forest stand level (generalized to 6.0 m spatial resolution). The temporal changes were studied primarily using the VOG1 vegetation index (VI) as it was showing high and stable sensitivity to forest damage for both spatial resolutions considered. In 1998, significant differences between the moderately to heavily damaged (central Ore Mountains) and initially damaged (western Ore Mountains) stands were detected for all the VIs tested. In 2013, the stands in the central Ore Mountains exhibited VI values much closer to the global mean, indicating an improvement in their health status. This result fully confirms the finding of the Landsat time series analysis. The greatest difference in Disturbance Index (DI) values between the central (1998: 0.37) and western Ore Mountains stands (1998: ´1.21) could be seen at the end of the 1990s. Nonetheless, levelling of the physiological status of Norway spruce was observed for the central and western parts of the Ore Mountains in 2013 (mean DI values ´1.04 (western) and ´0.66 (central)). Although the differences between originally moderately-to-heavily damaged, and initially damaged stands generally levelled out by 2013, it is still possible to detect signs of the previous damage in some cases. Keywords: forest health; Norway spruce; hyperspectral imagery; Tasseled Cap; Landsat; Ore Mountains
1. Introduction Forests play an important role in regulating global climate; moreover, they provide human beings with a whole range of ecosystem services. In Europe forest health and functioning have been primarily
Remote Sens. 2016, 8, 92; doi:10.3390/rs8020092
www.mdpi.com/journal/remotesensing
Remote Sens. 2016, 8, 92
2 of 20
influenced by anthropogenic activities (e.g., air pollution, surface mining, contamination). The situation of deteriorated forest health status has led to numerous remote sensing applications focusing on monitoring forest damage in the last 40 years, especially after the launch of the ERTS/Landsat program [1,2]. Remote sensing vegetation studies are based on canopy-level vegetation spectral properties, which are determined by a combination of factors, including canopy density and structure, as well as foliar pigments, water, and other constituent contents [3]. The structure of a forest stand is also directly linked with the stand’s disturbance history [4]. The Landsat program offers an opportunity to study the long-term development of forest ecosystems through the availability of a long-term data series (since 1972). Numerous forest monitoring methods have been developed, including simple techniques, such as classification or vegetation indices analysis [5,6] as well as more sophisticated approaches, such as change vector analysis [7,8], trajectory based segmentation [9,10] or multi-temporal spectral mixture analysis [11]. Although the Landsat data have been used for several decades, their use for forest monitoring is still relevant [12–15]. The Landsat data can be widely used in forest monitoring; however, their applicability for detailed vegetation studies is limited, especially by their spatial and spectral resolution. Classification of forest status using the Landsat data is, therefore, too general, usually allowing only very basic forest damage classes to be distinguished, such as no damage, intermediate damage, and heavy damage/dead forest [1]. Significant advances have been achieved with the use of imaging spectrometers enabling identification of not only significant forest damage, but also the very initial phases of vegetation stress due to detailed records (narrowband) of vegetation spectral signatures [16–18]. The availability of airborne hyperspectral imagery has, thus, led to the development of techniques for detailed studies and modelling of selected biochemical, biophysical, and structural vegetation parameters, thus enabling not only a qualitative comparison, but also a quantitative estimation [19–22]. Many of these techniques are based on regression between hyperspectral vegetation indices and vegetation properties [23–26]. A large part of vegetation indices are usually affected simultaneously by several vegetation parameters [25,27], so these indices can be used as indicators of the overall vegetation status rather than as predictors of particular vegetation parameters. Nevertheless, this is an advantage when looking for non-specific vegetation stress markers. Therefore, hyperspectral data have been successfully used for detecting vegetation stress and damage of various levels and causes. Huesca et al. [28] used a combination of AHS airborne hyperspectral data and MODIS superspectral satellite data to study recovery of forest vegetation after fire by the means of spectral unmixing analysis and the Normalized Difference Vegetation Index (NDVI) change detection technique. Wu et al. [29] studied the effects of late frost stress using a wide range of spectral parameters extracted from the red-edge spectral domain. Fassnacht et al. [30] applied a combination of a genetics algorithm (a heuristic search approach inspired by natural evolution generating solutions for optimization problems) and a supervised support vector machine on airborne HyMap hyperspectral data to classify different tree mortality classes caused by a bark-beetle outbreak. Mahlein et al. [31] developed a set of specific spectral disease indices optimized for various crops. Sanches et al. [32] developed a Plant Stress Detection Index based on the parameters of the continuum removed chlorophyll absorption feature which was then applied at both leaf and canopy level to reveal stressed plants. Behmann et al. [33] used a Support Vector Machine and a set of relevant vegetation indices to quantify distribution of progressive senescence stages and to distinguish well-watered and drought stressed plants. They pointed out that drought stress can be detected much earlier in such a case than in the case of using NDVI. Nevertheless, one of the disadvantages of using hyperspectral data is the fact that due to high costs they are usually not acquired repeatedly over a long period, so as a stand-alone they cannot be used for monitoring the change in forest health status. The main aim of this paper is to assess spatio-temporal changes of the physiological status of homogeneous (i.e., single species and even aged) Norway spruce (Picea abies L. Karst) forests located at two sites of the Ore Mountains located in the northwestern part of the Czech Republic differing by forest disturbance history and pollution load. The study was based on a long-term (1985–2015) series of Landsat imagery in combination with analysing the physiological status of the forest stands under
Remote Sens. 2016, 8, 92
3 of 20
study using the airborne hyperspectral data acquired during the peak of the disturbance level (1998) and after 15 years (2013). The image information thus derived is then coupled with the results of an in situ field survey organized together with both hyperspectral data acquisitions. The focus was on answering whether there is currently any difference in tree physiological status between the originally damaged stands (central Ore Mountains) and those stands located in the western Ore Mountains Remotehad Sens. 2016, 92 region, which not 8,been found to be seriously damaged in 1998. The present study is direct of theis work conducted in these and after 15 years (2013).a The image continuation information thus derived then coupled with the results of an sites by Campbell et al. [17] ASAS airborne hyperspectral for detection of initial stress in situ field who surveyused organized together with both hyperspectral imagery data acquisitions. The focus was on whether there currently anythe difference in tree physiological status between the in Norwayanswering spruce stands and forisestablishing links between various forest parameters (describing originally damaged stands (central Ore Mountains) and those stands located in the western Ore the particular damage levels) and the image-extracted spectral signatures. Mountains region, which had not been found to be seriously damaged in 1998. The present study is a direct continuation of the work conducted in these sites by Campbell et al. [17] 2. Material who used ASAS airborne hyperspectral imagery for detection of initial stress in Norway spruce stands and for establishing the links between various forest parameters (describing the particular 2.1. Study Area damage levels) and the image-extracted spectral signatures.
The study was performed at two sites situated in the Ore Mountains in Western Bohemia (Figure 1). 2. Material The central part of the Ore Mountains region was suffering high loads of SO2 , NOX , and PM10 [34] Study Area originating2.1. mainly from coal mining and heavy industry. The high levels of air pollution led to massive The study was performed two sites situated in the Ore in Western Bohemia 1). sources dieback of the local Norway spruce at forests between 1970 andMountains 2000. The position of the(Figure pollution The centraleastward part of the wind Ore Mountains region was suffering loadswest-to-east of SO2, NOX, and PM10 [34] pollution and the prevailing direction contributed to ahigh sharp increasing originating mainly from coal mining and heavy industry. The high levels of air pollution led to gradient and a corresponding gradient in tree damage levels. In the early 1990s, the west–east gradient massive dieback of the local Norway spruce forests between 1970 and 2000. The position of the ´3 (central) and 24.0 µg¨ m´3 (western); NO of imissions in thesources Ore Mountains was SO pollution and the prevailing eastward windmdirection contributed to a sharp west-to-east 2 81.4 µg¨ X 3 (central) ´3a (western) pollution gradient and corresponding gradient in treethe damage levels. In the early 34.8 µg¨ m´increasing and 16.5 µg¨ m [34]. Although pollution loads had1990s, fallen by 1998, the west–east of imissions in the OreOre Mountains was SOstill 2 81.4 µg·m−3 (central) and 24.0 µg·m−3 the difference betweengradient the central and western Mountains remained (SO2 17.0 and 6.0 µg¨ m´3 ; −3 −3 (western); NOX 34.8 µg·m (central) and 16.5 µg·m (western) [34]. Although the pollution loads had ´ 3 NOX 18.0 and 14.0 µg¨ m ) [34]. There was an observed relationship between loss of forest and the fallen by 1998, the difference between the central and western Ore Mountains still remained (SO2 17.0 −3) [34]. prevailing and wind As such, theµg·m central and western exhibited 70% and 50% cover 6.0directions. µg·m−3; NOX 18.0 and 14.0 There was an parts observed relationship between loss forest of forest and and the prevailing wind directions. As such, central and western parts exhibited 70%mortality and loss between 1972 1989, respectively [35]. The the forest cover loss was due to high and 50% forestcuttings” cover loss between 1972damaged and 1989, respectively The forest coverdropped loss was due to high rapid “emergency of heavily trees. The[35]. emission loads significantly from mortality and rapid “emergency cuttings” of heavily damaged trees. The emission loads dropped the end thesignificantly of 1990s;from however, the west–east gradient was still observable in 2012: SO2 7.4 µg¨ m´3 the end the of 1990s; however, the west–east gradient was still observable in 2012: ´ 3 ´3 (central), ´3 (western) −3 (western) µg¨ mNO 7.3 µg¨ m [34]. (central), 2.5 m −3(western); SOµg¨ 2 7.4 µg·m (central), 2.5 NO µg·m (western); X 11.5 µg·m−3 (central), 7.3 µg·m [34]. X−311.5
Figure 1. (A) Main sources of air pollution (coal power stations, heavy industrial facilities, etc.) in the
Figure 1. (A) sources of (B) airDetailed pollution (coal industrial facilities, OreMain Mountains region; maps of thepower westernstations, (WE) andheavy central (CE) Ore Mountains sitesetc.) in the Ore Mountains region;of(B) mapsstands of the western (WE) (CE) Oreand Mountains sites with positions theDetailed Norway spruce sampled during the and field central campaigns in 1998 2013. Background provided by ČUZK. with positions of themap Norway spruce stands sampled during the field campaigns in 1998 and 2013. 3 ˇ Background map provided by CUZK.
Remote Sens. 2016, 8, 92
4 of 20
The central Ore Mountains region is represented by Norway spruce stands located in sites within the neighbouring the town of Kováˇrská and the Pˇríseˇcnice water dam. The local forests showed a moderate to high level of damage at the end of the 1990s. In 1998 the trees had an average of 6 to 8 needle age classes for moderately to heavily damaged trees, respectively [17]. Nevertheless, in extreme cases of heavily damaged trees only 4 needle age classes remained. Since the reduction in air pollution the process of forest recovery has stared and currently the Norway spruce stands show only initial to moderate damage symptoms. The second study site is located in the western part of the Ore Mountains region in the neighbourhood of Pˇrebuz town. In contrast with the central Ore Mountains this area was outside of the region of the highest pollution load and the local Norway spruce forests therefore remained almost intact (healthy to initial damage). In 1998 the trees had 9 to 10 needle age classes for healthy and initially damaged sites, respectively. In 2013 all the trees had an average of eight needle age classes. 2.2. Landsat Time Series The general trends of forest disturbance/recovery (i.e., defining the periods of improvement or worsening of the forests physiological status) were studied using the time series of Landsat TM/ETM+/OLI data covering the time period from 1985 until 2015. The Landsat data were acquired from the USGS data archive via the Earth Explorer interface. Note that only the scenes with no clouds over the compared areas obtained during the highest vegetation season (June to September) were selected for further processing. The Landsat scenes used are listed in Table 1. Table 1. List of the Landsat scenes used for the disturbance index (DI) time series analysis (dates of scene acquisition and Landsat satellite: L4: Landsat 4 TM, L5: Landsat 5 TM, L7: Landsat 7 ETM+, L8: Landsat 8 OLI). 1980s
1990s
2000s
2010s
13.8.1985 (L5) 31.7.1986 (L5) 14.8.1988 (L5) 7.7.1989 (L5)
3.3.1990 (L5) 8.8.1992 (L4) 14.7.1994 (L5) 10.8.1998 (L5) 13.9.1999 (L7)
24.9.2000 (L7) 28.7.2002 (L7) 10.8.2004 (L5) 28.7.2005 (L5) 5.9.2006 (L5) 24.8.2009 (L5)
30.9.2011 (L7) 15.8.2012 (L7) 2.8.2013 (L7) 6.6.2015 (L8)
2.3. Airborne Hyperspectral Data ASAS airborne hyperspectral data, consisting of 512 ˆ 662 pixels, 62 spectral bands (with FWHM ca. 10 nm) covering the spectral range from 410 to 1013 nm, were acquired between 20 August and 1 September 1998. However, only the bands between approx. 550–850 nm were calibrated to reflectance and used for further analyses due to poor atmospheric conditions, affecting the spectral calibration of the sensor in the VIS-B and far NIR regions. The original ground spatial resolution of this dataset was 1.5 ˆ 2.0 m. ASAS radiance data was calibrated to at-surface reflectance using a vicarious hybrid calibration approach utilizing the 6S atmospheric correction code, as well as in situ ground reflectance measurements from dark and bright calibration targets (asphalt and lime) collected by a GER-2500 field spectroradiometer [17]. APEX (Airborne Prism Experiment) data, consisting of 286 spectral bands (with FWHM ca. 7 nm) covering the spectral range from 430 to 2450 nm, were acquired on 6 September 2013 consisting of 286 spectral bands (with FWHM ca. 7 nm) covering the spectral range between 430 and 2450 nm. The original ground spatial resolution of this dataset was 2.0 m. A supportive calibration/validation ground campaign was organized simultaneously with the acquisition of hyperspectral imagery. Surface level spectra of several calibration and validation targets of an adequate spatial extent and homogeneity were taken by an ASD Fieldspec-4 spectroradiometer. The targets included water bodies (2ˆ), asphalt (3ˆ), concrete tiles (4ˆ), bare soil/sand (1ˆ), fresh grass (2ˆ), and dry grass (1ˆ). APEX data pre-processing, including radiometric calibration, geometric, and atmospheric corrections was
Remote Sens. 2016, 8, 92
5 of 20
performed by VITO (Flemish Institute for Technological Research). Radiometric calibration was conducted using APEX Calibration Home Base data [36]. Geometric correction was performed using the data from a GPS/IMU unit, boresight corrections, and a 5 m grid LiDar-based digital elevation model. Atmospheric correction and other necessary pre-processing (e.g., a smile-aware atmospheric correction and retrieval of hemispherical-conical reflectance factors—HCRF) was conducted within the Central Data Processing Centre (CDPC) as well as at VITO using a module based on MODTRAN-5 radiative transfer code. A detailed description of the whole APEX data pre-processing provided by CDPC was given in [37]. The challenge when comparing the images acquired with different optical sensors is arriving at a common set of spectral and spatial parameters. Identifying such a common set of parameters for comparison is a key step, which may not be possible when using multispectral sensors, providing discrete spectral bands. However, imaging spectrometers provide spectrally continuous calibrated reflectance data (e.g., for ASAS and APEX ~10 nm resolution, 550–850 nm common region) to compute comparable spectral parameters (VIs). To address the difference in the calculated VIs due to the sensitivity of the two instruments (e.g., signal strength and noise characteristics), and the different correction procedures the computed VIs were normalized as described in Section 3.2. 2.4. Field Reference Data A supportive ground campaign was organized simultaneously with the ASAS data acquisition in late August 1998 as described in [17]. In total, 38 even aged mature Norway spruce stands (21 at the western and 17 at the central Ore Mountains) were selected for evaluation of tree physiological status using the five-grade damage class scale as described in Table 2. Forest physiological condition was assessed using a methodology for evaluating the state of individual tree crowns, modified for use with high spectral resolution digital imagery and field surveys [17]. The classification scheme [38] is based on the evaluation of the degree of defoliation and the presence of chlorosis in individual tree crowns. The crown characteristics of a stand were then summarized to classify whole stands into damage levels. For more details see [17]. In addition, five trees were selected at each stand for needle sampling to determine the content of photosynthetic pigments (chlorophylls and carotenoids). The needle samples were collected from the sunlit production portion of tree crowns using pruning poles. The collected samples were placed into the dark conditions of a portable freezer and transported to a laboratory for further processing. Photosynthetic pigments were extracted in dimethylformamide (DMF) in cold dark conditions following the procedure of [39]. The foliar pigments content was then determined spectrophotometrically using the equations of [40] and normalized by dry sample weight (mg¨ g´1 ). All sampled trees fell within the 30 m ˆ 30 m buffer area at each particular stand. The coordinates of the centroids of these buffer areas were measured using differentially-corrected GPS [17].The Norway spruce stands defined during the 1998 field campaign that were considered essentially as initially damaged (including the undamaged or initially damaged stands of DC0 –DC1 ; located at western Ore Mountains) or moderately to heavily damaged DC2 –DC3 ; located at the central Ore Mountains, were clearly distinguished using a visual assessment of the defolitation level and the presence of chlorosis as described in Table 2. Note that no stand was classified into the DC4 class either at the western or at the central Ore Mountains. Table 2. Forest health status classification scheme developed during the sampling campaign in 1998. Adopted from [17,38]. The same scheme was used during the campaign in 2013. Damage CLASS DC0 DC1 DC2 DC3 DC4
Vitality Status healthy initial damage moderate damage heavy damage ecosystem collapse
Canopy Defoliation (%) Chlorosis Absent
Chlorosis Present
0–10 11–25 26–60 61–80 81–100
no chlorosis 1–10 11–25 26–60 61–100
Remote Sens. 2016, 8, 92
6 of 20
In 2013, a new ground campaign was organized simultaneously with APEX data acquisition. Eleven Norway spruce stands were selected for detailed study; of these, eight coincided with the stands selected during the 1998 campaign: P9 , P10 , P11 , P40 at the western Ore Mountains and K25 , K37 , K46 , and K47 at the central Ore Mountains A similar sampling design as in 1998 [17] was applied; five trees were sampled per stand to assess foliar pigments content. The defoliation level and presence of chlorosis were assessed for twelve trees per stand. All stands in both sites were considered as initially to moderately damaged (DC1 and DC2 ) since the trees showed a mean defoliation level of 30% in the central Ore Mountains and 33% in the western Ore Mountains in 2013. To validate the results of the hyperspectral (HS) data analysis of ASAS and APEX image data, only those stands that could have been found in both ASAS and APEX datasets were selected (e.g., some of the stands were covered by clouds in case of the ASAS dataset or were harvested in the 1998–2013 period). This included a total of 16 stands: 14 at the western Ore Mountains (P1 , P2 , P3 , P4 , P5 , P6 , P9 , P10 , P11 , P15 , P17 , P43 , P44 , and P45 ) and two at the central Ore Mountains (K33 and K37 ) (Figure 1). 3. Methods The focus was on Norway spruce forests and, thus, it was necessary to mask the other surfaces. Therefore prior to the analysis Norway spruce masks were derived for individual Landsat images as well as for the HS image data sets. These Norway spruce masks were then used for all following calculations and transformations applied to Landsat scenes as well as to both HS datasets. The long-term trend was studied using a Landsat time series (1985–2015), whereas a detailed analysis on the forest health status was conducted using the available multi-date hyperspectral (HS) image data acquired in 1998 and 2015. Due to technological differences between ASAS and APEX sensors (e.g., spectral resolution and signal-to-noise (SNR) ratio) and differences in atmospheric corrections applied to the ASAS and APEX data, the original VI values had to be normalized to allow their mutual comparability (see Section 3.2 Equation (6) and Section 3.3). Only after that was it possible to further assess the spatio-temporal trends. The forest health status analysis of multi-date HS image data was performed at two levels of spatial resolution of the hyperspectral imagery, at a tree level (original 2.0 m spatial resolution), as well as at a forest stand level (generalized to 6.0 m spatial resolution). A statistical assessment for the Landsat time series, as well as the HS data sets and field reference were done at a stand level. 3.1. Landsat Disturbance Index Time Series Analysis The Landsat data were firstly transformed from the raw DNs into top-of-atmosphere (TOA) reflectance using the calibration tool included in the ENVI 5.2 software and the appropriate calibration coefficients included in the Landsat metadata files (MTL). Note that regarding [41,42] TOA, reflectance is recommended for the Tasseled Cap transformation rather than at-surface reflectance. The Tasselled Cap transformation—TCT [43] was then performed to obtain three components related to vegetation characteristics: Brightness (B), Greenness (G) and Wetness (W). The TCT was performed using the appropriate tool included in the ENVI 5.2 software for the scenes acquired by Landsat 5 TM and Landsat 7 ETM+. Unfortunately, this version of the ENVI software does not allow the TCT transformation for the data acquired by Landsat 8 OLI. Thus, the TCT coefficients (describing the relationship of the original image bands and the TCT components) were used as recommended by [42]. The coefficients optimized for the growing season were used for more details see [42]. In the next step, the Disturbance Index (DI) was calculated from the TCT components following the definition of [44] as: ` ˘ Br “ B ´ Bµ {Bσ (1) ` ˘ Gr “ G ´ Gµ {Gσ (2) ` ˘ Wr “ W ´ Wµ {Wσ (3)
Remote Remote Sens. Sens. 2016, 2016, 8, 8, 92 92
7 of 20
DI = B − (G + W ) DI “ B r ´ pG r` W qr r
r
r
(4) (4)
where: B Br,, G r, and Wr are rescaled Brightness, Greenness, and Wetness components; B, G, and W are where: r Gr , and Wr are rescaled Brightness, Greenness, and Wetness components; B, G, and W are the original Brightness, Greenness,and andWetness Wetnessvalues; values;BBµ,,GGµ,, and and W Wµ are the means of B, G, and W the original Brightness, Greenness, µ µ µ are the means of B, G, and W calculated from from the the forest forest land land areas; areas;BBσ,, G Gσ,, W σ are standard deviations of B, G, and W calculated calculated σ σ Wσ are standard deviations of B, G, and W calculated from the forest land areas defined by the appropriate binary mask. mask. from the forest land areas defined by the appropriate binary The concept concept of of DI DI assumes assumes that that high high B Br and low Gr and Wr values are typical for disturbed stands. The r and low Gr and Wr values are typical for disturbed stands. The DI value is high (positive) in such a case. On and The DI value is high (positive) in such a case. On the the other other hand, hand, undisturbed, undisturbed, fully-regenerated fully-regenerated and young vital stands are typical for low B r and high Gr and Wr values resulting in low (negative) DI young vital stands are typical for low Br and high Gr and Wr values resulting in low (negative) DI values [44]. [44]. values The Landsat 77 scenes scenes were were acquired acquired in in SLC-off SLC-off mode mode after after 2003 2003 due due to to aa malfunction malfunction of of the the Scan Scan The Landsat Line Corrector of the ETM+ sensor (compensating the orbital motion of the satellite). This results in Line Corrector of the ETM+ sensor (compensating the orbital motion of the satellite). This results in stripes of of zero-value zero-value pixels pixels in in the the imagery. imagery. Thus, masked out out and and only only the the valid valid stripes Thus, these these areas areas were were masked values were used for the all analysis. values were used for the all analysis. A raster rasterlayer layerofofthethe values calculated forforest the forest land was areas was constructed each A DIDI values calculated for the land areas constructed for each for Landsat Landsat scene. The DI values were then classified into three classes using mean (µ) and standard scene. The DI values were then classified into three classes using mean (µ) and standard deviation (σ) deviation (σ) values. Class 1 includes low DI than values (less than µ − 0.5σ) representing undisturbed and values. Class 1 includes low DI values (less µ´ 0.5σ) representing undisturbed and most vital most vital forest, whereas Class 3high includes high (more DI values thanrepresenting µ + 0.5σ) representing the most forest, whereas Class 3 includes DI values than(more µ + 0.5σ) the most disturbed disturbed stands. Class 2 represents the most common DI values between µ − 0.5σ and µ + 0.5σ. stands. Class 2 represents the most common DI values between µ ´ 0.5σ and µ + 0.5σ. 3.2. Vegetation Indices Derived Derived from from Hyperspectral Hyperspectral Image Image Data Data and and Stand Stand Separability Separability 3.2. Vegetation Indices The forest forest health health status status analysis analysis was was performed performed at two levels levels of of spatial spatial resolution resolution of of the the The at two hyperspectral imagery: hyperspectral imagery: original original (2.0 (2.0 m) m) considering considering individual individual tree tree crowns crowns and and generalized generalized (6.0 (6.0 m) m) considering whole defined differently differently for for each each spatial spatial considering whole forest forest stands. stands. Therefore, Therefore, the the stands stands had had to to be be defined resolution level. level.The Thestands stands were defined bym30 m circular zones centroids whose centroids were resolution were defined by 30 circular buffer buffer zones whose were localized localized by GPS measurements the 1998 (see campaign 2.4). representing The pixels representing by GPS measurements during theduring 1998 campaign Section(see 2.4).Section The pixels sunlit parts sunlit parts of Norway spruce crowns defined by the Mahalanobis distance classificator were taken of Norway spruce crowns defined by the Mahalanobis distance classificator were taken into account into case ofresolution the original (Figure all the pixels within the in theaccount case of in thethe original dataresolution (Figure 2),data whereas all 2), thewhereas pixels within the defined buffers defined buffers the case of level the generalized level data. were used in thewere case used of theingeneralized data.
Figure Definition of spruce sampling stands in in the the original original APEX APEX data data (A) (A) and and binary binary Figure 2. 2. Definition of the the Norway Norway spruce sampling stands mask of the sunlit tree crowns (B). mask of the sunlit tree crowns (B).
In the the case case of of the the ASAS ASAS dataset, dataset, only only the the bands bands between between 550–850 550–850 nm nm were were usable usable for for further further In processing. This limited the number of vegetation indices (VIs) that could be calculated from these processing. This limited the number of vegetation indices (VIs) that could be calculated from these data (e.g., (e.g., all all the the indices indices requiring requiring bands bands in in the the VIS-B VIS-B region region had had to to be be excluded). excluded). The The APEX APEX data data data were resampled to the spectral resolution of the ASAS data prior to calculating the VIs to ensure their were resampled to the spectral resolution of the ASAS data prior to calculating the VIs to ensure their mutual comparability. comparability. The The vegetation vegetation indices indices used used within within this this study study are are listed listed in in Table Table33[17,46–56]. [17, 46–56]. mutual
7
Remote Sens. 2016, 8, 92
8 of 20
To check their sensitivity to forest damage, a simple separability index (SI) was calculated between the initially damaged and moderately to heavily damaged forest stands for all the VIs. The SI was calculated using the following formula used in [45]: SI “
|µh ´ µd | σh ` σd
(5)
where: SI is the separability index, µh and σh are the mean and standard deviation calculated from the pixels within initially damaged stands, µd and σd are the mean and standard deviation calculated from pixels within the moderately to heavily damaged forest stands. Table 3. List of vegetation indices used in this study. Index
Definition
Reference
NDVI705 VOG1 VOG2 REP NDVI RDVI MSR MSAVI MCARI TVI TCARI OSAVI N705 N715 N725 D715 /D705 D725 /D705
(R750 ´ R705 )/(R750 + R705 ) R740 /R720 (R734 ´ R747 )/(R715 + R726 ) 700 + 40 ˆ ((((R670 + R780 )/2) ´ R700 )/(R740 ´ R700 )) (R800 ´ R670 )/(R800 + R670 ) (R800 ´ R670 )/sqrt(R800 + R670 ) ((R800 /R670 ) ´ 1)/sqrt((R800 /R670 ) + 1) 0.5 ˆ (2R800 + 1 ´ sqrt((2R800 + 1)2 ´ 8 ˆ (R800 ´ R670 ))) ((R700 ´ R670 ) ´ 0.2 ˆ (R700 ´ R550 )) ˆ (R700 /R670 ) 0.5 ˆ (120 ˆ (R750 ´ R550 ) ´ 200 ˆ (R670 ´ R550 )) 3 ˆ ((R700 ´ R670 ) ´ 0.2 ˆ (R700 ´ R550 ) ˆ (R700 /R670 )) ((1 + 0.16)(R800 ´ R670 ))/(R800 + R670 + 0.16) (R705 ´ R675 )/(R750 ´ R670 ) (R715 ´ R675 )/(R750 ´ R670 ) (R725 ´ R675 )/(R750 ´ R670 ) D715 /D705 D725 /D705 Rλ stands for reflectance at wavelength λ Dλ stands for 1st derivation of reflectance at wavelength λ
[46] [47] [48] [49] [50] [51] [52] [53] [54] [55] [56] [17] [17]
The original values of the given VIs obtained from the ASAS dataset are not directly comparable with the ones extracted from the APEX dataset. This is mainly due to technological differences between ASAS/APEX sensors and differences in atmospheric correction applied to the ASAS and APEX data etc. The original VI values were, therefore, normalized to allow their mutual comparability using the following formula: V Ix ´ V Iµ V Ix1 “ (6) V Iσ where: VI1 x is the normalized value of vegetation index VI for pixel x, VIx is the original value of vegetation index VI for pixel x, VIµ and VIσ are the mean and standard deviation values of the vegetation index VI calculated from the all pixels representing sunlit crowns within the buffer areas representing the selected forest stands. 3.3. Detection of Spatio-Temporal Differences The values of the VIs used (or VI1 s) were extracted from both ASAS and APEX data using the buffer zones (defining the particular stands) and tree crowns mask (in case of the original resolution data). The Student’s two-sample test was used to analyse spatial differences as well as temporal changes in the used VI1 s values (considered as the markers of forest physiological status). In the case of the spatial differences , the VI values were grouped regarding the classification of the stands as moderately to heavily damaged or initially damaged (1998), and formerly moderately to heavily
Remote Sens. 2016, 8, 92
9 of 20
damaged or still initially damaged (2013). The test was applied to analyze whether there are any significant differences in VI values between these groups (separately for 1998 and 2013). The normalized VI values describe the relative distance of the given pixel from the global mean (calculated from all Norway spruce pixels within the defined stands). Thus, the analysis was whether any significant change of the relative distance to the global mean occurred at each given stand. Both tests were performed at the 95% significance level (α = 0.05). 3.4. Statistical Assessment Using Field Reference Data Two non-specific stress markers based on photosynthetic pigments ratios were used as the indicators of tree physiological status: chlorophyll-a to chlorophyll-b ratio (Ca /Cb ) and total carotenoids to total chlorophylls ratio (Cx /Cab ). Worsening of tree physiological status is usually exhibited by an increase in the Ca /Cb ratio as chlorophyll-b is regarded to be more sensitive to vegetation stress than chlorophyll-a [57]. Similarly, stress conditions lead to an increase in the Cx /Cab ratio [58–60]. Temporal differences in photosynthetic pigments contents and their ratios were evaluated for the stands sampled in both years (1998 and 2013) and covered by both hyperspectral image datasets. A two-way ANOVA (performed at the 95% significance level α = 0.05) was used for evaluating the differences between the western and central Ore Mountains sites and temporal changes. The differences between the sites in particular years were determined by the Tukey–Kramer multiple comparison test. 4. Results 4.1. General Trends of Forest Recovery Temporal changes of DI values were studied across the time series of the Landsat data for both western and central Ore Mountains sites. Figure 3 shows examples of the DI raster layers. The initial situation in the second half of the 1980s is represented by the scene acquired in 1985. The scene from 1998 represents the phase of the highest difference between the central and western Ore Mountains, whereas the scene acquired in 2015 shows the current situation. Figure 4 shows the relative frequencies of the three defined DI classes and changes of the DI values at the forest stands where a health status assessment and needle sampling were performed during the 1998 and 2013 campaigns. It can be seen that there is significant difference between the two study areas. The central Ore Mountains exhibited higher DI values indicating a higher disturbance level than the forests in the western part during the 1980s and 1990s with peak in 1998, while in the western Ore Mountains the forests disturbance level did not change much during the same period. It can also be seen that the relative frequency of Class 3 has been declining slightly since around the year 2000, representing regeneration processes in the central Ore Mountains area. In addition, mean DI values were calculated for the Norway spruce stands sampled during both field campaigns in 1998 and 2013 (i.e., P9 , P10 , P11 , P40 , K25 , K37 , K46 , and K47 )—see Figure 4. Again, the higher DI of the forest stands in the central Ore Mts indicate a worse health status compared to the ones at the western Ore Mountains. The highest difference between the central and western Ore Mountains sites can be seen at the end of the 1990s. After that a levelling trend of the two sites can be observed.
Remote Sens. 2016, 8, 92 Remote Sens. 2016, 8, 92
10 of 20
Disturbance index (DI) for values for coniferous forests calculated from Tasseled Figure 3.3.Disturbance index (DI) values coniferous forests calculated from Tasseled Cap-transformed Cap-transformed Landsat data for western (WE) and central (CE) Ore Mountains localities for 1985, Landsat data for western (WE) and central (CE) Ore Mountains localities for 1985, 1998, and 2015. 1998,lower and 2015. The lower DI in values (shown in green) correspond to disturbed relatively less disturbed stands, The DI values (shown green) correspond to relatively less stands, whereas high whereas DI values in red) to relatively disturbed stands. DI valueshigh (shown in red)(shown correspond to correspond relatively more disturbedmore stands.
10
Remote Sens. 2016, 8, 92
11 of 20
Remote Sens. 2016, 8, 92
A
B
C
Figure 4. Relative frequency of the Disturbance Index (DI) classes calculated for the forest areas at the
Figure 4. Relative frequency of the Disturbance Index (DI) classes calculated for the forest areas at the western (WE) and central (CE) Ore Mountains Class 1—less disturbed areas, Class 2—most common western (WE) and central (CE) Ore Mountains Class 1—less areas, Class 2—most disturbance level, and Class 3—more disturbed areas (a anddisturbed b). Mean DI values calculated forcommon the disturbance Class 3—more disturbed areas (A and B). and Mean DI(c). values calculated for the Norway level, spruceand stands sampled during the field campaigns in 1998 2013 Norway spruce stands sampled during the field campaigns in 1998 and 2013 (C). 4.2. Assessment of Forest Health Status Change Using ASAS and APEX Datasets
4.2. Assessment of Forestanalysis Health Status ASAS and The sensitivity provedChange that theUsing majority of the VIsAPEX used isDatasets highly sensitive to vegetation health status andanalysis forest damage. five indices were set for the original 2m The sensitivity provedTwo thatsets theof majority of the VIsdefined used is(one highly sensitive to vegetation spatial resolution data and one for the generalized 6 m spatial resolution) providing the best results health status and forest damage. Two sets of five indices were defined (one set for the original 2 m to distinguish initially and moderately to heavily damaged regions. The fist set designed for the spatial resolution data and one for the generalized 6 m spatial resolution) providing the best results original (2 m) resolution data included the following indices: VOG1, NDVI, TCARI/OSAVI, MSR, and to distinguish initially moderately heavily damaged regions. The fist set designed for the NDVI705, whereas theand set designed for thetogeneralized (6 m) resolution included the following indices: original (2 m) resolution data included the following indices: VOG , NDVI, TCARI/OSAVI, MSR, 1 N714, VOG1, TCARI/OSAVI, MSR and NDVI705. The values of these most sensitive vegetation indices and NDVItogether , whereas the set designed for the generalized (6 m) resolution included the following indices: with the calculated separability scores are shown in Figure 5. 705 Significant differencesMSR wereand detected for. the values thesensitive moderately to heavily N714 , VOG NDVI705 TheVI values of between these most vegetation indices 1 , TCARI/OSAVI, damaged (located at the central scores Ore Mountains) and damaged ones (located at the together with stands the calculated separability are shown in initially Figure 5. western Oredifferences Mountains)were in both the original and generalized (6moderately m) spatial resolution the Significant detected for the(2VIm) values between the to heavilyofdamaged ASAS (1998) data. The p-values of the tests carried out were far less than 0.01 in all cases. Moreover, stands (located at the central Ore Mountains) and initially damaged ones (located at the western Ore 11 (6 m) spatial resolution of the ASAS (1998) data. Mountains) in both the original (2 m) and generalized The p-values of the tests carried out were far less than 0.01 in all cases. Moreover, these differences
Remote Sens. 2016, 8, 92
12 of 20
Remote Sens. 2016, 8, 92
differences in were in the(2013) case ofdata, the APEX (2013) data, although were notasasin the were these also detectable thealso casedetectable of the APEX although they were not asthey noticeable noticeable as in the case of the ASAS dataset. case of the ASAS dataset.
Figure 5. Values of the most sensitive vegetation indices calculated from original (2 m) and Figure 5. Values of the most sensitive vegetation indices calculated from original (2 m) and generalized generalized (6 m) spatial resolution ASAS imagery from 1998. ID stands for initially damaged stands (6 m) spatial resolution ASAS imagery from 1998. ID stands for initially damaged stands (in total (in total 14 sites), whereas HD stands for moderately to heavily damaged forest stands (in total two 14 sites), whereas HD stands for moderately to heavily damaged forest stands (in total two sites). sites). SI represents separability scores. SI represents separability scores.
The temporal changes were studied primarily using the VOG1 index, as it was showing high and stabletemporal sensitivity to forestwere damage for both spatial resolutions considered. the and The changes studied primarily using the VOG as it was changes showingtohigh 1 index,Significant proven a major partresolutions of the standsconsidered. studied except the P5 (p-values 0.28)to the stablenormalized sensitivityVItovalues forestwere damage forforboth spatial Significant changes and P17 (p-value 0.46). Examples thea normalized 1 index values for two selected stands can be normalized VI values were provenoffor major partVOG of the stands studied except the P5 (p-values 0.28) seen in Figure 6. and P17 (p-value 0.46). Examples of the normalized VOG1 index values for two selected stands can be A simple seen in Figure 6. visualization was developed to facilitate interpretation of the results obtained (Figure 7). The charts show the relative of thetoparticular (defined by the local mean of the given A simple visualization wasdistance developed facilitatestands interpretation of the results obtained (Figure 7). VI’) from the baselines (defined by the global means of the given VI’) in both time horizons. The charts show the relative distance of the particular stands (defined by the local mean of the Four given VI’) possible situations can be defined from this point of view: from the baselines (defined by the global means of the given VI’) in both time horizons. Four possible situations be defined from(+/+): this local pointmean of view: • can positive stagnation of the normalized VI’ values was positive in both time
‚ ‚ ‚ ‚
horizons. The given was aboveofthe global mean in both years. was positive in both time positive stagnation (+/+):stand local mean the normalized VI’ values • negative stagnation (−/−): local mean of the normalized VI’ values was negative in both years. horizons. The given stand was above the global mean in both years. Thestagnation stand was below global mean both years. ´/´ ´):thelocal negative (´ mean ofinthe normalized VI’ values was negative in both years. The stand was below the global mean in both years. ´/+): local mean of the normalized VI’ values was negative in 1998, but positive in 2013. recovery (´ 12but above the global mean in 2013. The stand was below the global mean in 1998, ´): the given stand was above the global mean in 1998, but below the global mean worsening (+/´ in 2013.
Remote Sens. 2016, 8, 92 Remote 2016, 8, (−/+): 92 • Sens. recovery
local mean of the normalized VI’ values was negative in 1998, but positive in
2013. The stand was below the global mean in 1998, but above the global mean in 2013. recovery (−/+): local mean of the normalized VI’ values was negative in 1998, but positive in worsening (+/−): the given stand was above the global mean in 1998, but below the global Remote Sens. 2016, 8, 92 13 of 20 2013. The stand was below the global mean in 1998, but above the global mean in 2013. mean in 2013. • worsening (+/−): the given stand was above the global mean in 1998, but below the global • •
mean in 2013.
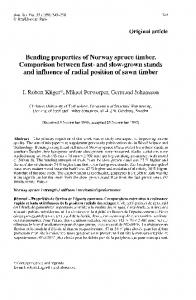
Figure 6. Normalizedvalues values of 1 vegetation index calculated from the ASAS (1998) and APEX Figure 6. Normalized of the theVOG VOG 1 vegetation index calculated from the ASAS (1998) and (2013) hyperspectral imagery datasets in the original 2 m spatial resolution for P11 (western Ore APEX (2013) hyperspectral imagery datasets in the original 2 m spatial resolution for P11 (western Figure 6. Normalized values of theKVOG 1 vegetation index calculated from the ASAS (1998)The and lower APEX 37 (central Ore Mountains—more damaged) stands. Mountains—less damaged) and Ore Mountains—less damaged) and K37 (central Ore Mountains—more damaged) stands. The lower Ore (2013) (shown hyperspectral imagerycorrespond datasets intothe originalworse 2 m spatial resolution forwhile P11 (western values in red colour) relatively physiological status, high values values (shown in red colour) correspond to relatively worse physiological status, while high values Ore Mountains—more Mountains—less damaged) and K37 (central (shown in green) correspond to a relatively good physiological status. damaged) stands. The lower (shown in green) to acorrespond relativelyto good physiological status. values (showncorrespond in red colour) relatively worse physiological status, while high values
The position of the sites in Figure 7 describes the temporalstatus. change at the particular stands using (shown in green) correspond to a relatively good physiological the normalized VOG 1 vegetation index. For the stands in the Mountains, thestands site K33using The position of the sites in Figure 7 describes the temporalcentral changeOre at the particular The position ofstagnation the sites inwhile Figure 7 describes thetotemporal change at the particular stands using exhibited negative site K 37 tended recover. Unfortunately, only two sites could the normalized VOG1 vegetation index. For the stands in the central Ore Mountains, the site K33 the normalized VOGin 1 vegetation index. Forcentral the stands in the central Ore Mountains, the site K33 have been included the analyses at the Ore Mountains because of the limited spatial exhibited negative stagnation while site K37 tended to recover. Unfortunately, only two sites could exhibitedof negative stagnation while 37 tended recover. Unfortunately, only two sitesmainly could coverage the ASAS dataset in this site site.KThe sites intothe western Ore Mountains exhibited have have been included in theinanalyses at theatcentral Ore Mountains because of the limited spatial coverage been included the analyses the central Ore or Mountains because theit was limited spatial positive stagnation and some of them negative stagnation worsening. For thisof site, possible to of theinclude ASAS dataset in this site. The sites in the western Ore Mountains exhibited mainly positive coverage the ASAS dataset in this site. The sites in the western Ore Mountains exhibited mainly 14 of stands in the analysis. stagnation and some of and them negative stagnation or worsening. For thisFor site, wasit possible to include positive stagnation some of them negative stagnation or worsening. thisitsite, was possible to 14 stands in 14 thestands analysis. include in the analysis.
13 Figure 7. Visualization of Norway spruce health status temporal change using normalized VOG1 vegetation index constructed for original (A) and 13 generalized (B) spatial resolution of the used image data. P—western Ore Mountains (Pˇrebuz) sites, and K—central Ore Mountains (Kováˇrská) sites.
4.3. Differences in Photosynthetic Pigments Content The descriptive statistics of the studied Norway spruce needles parameters are listed in the Table 4. The statistical analysis did not prove any significant differences in biochemically determined
Remote Sens. 2016, 8, 92
14 of 20
total chlorophyll content in Norway spruce needles samples at either site in 1998 and 2013, if the site (p = 0.66) and year (p = 0.49) were used as fixed factors in the two-way ANOVA (Table 5). Nevertheless, differences were detected in the ratios of photosynthetic pigments (Ca /Cb and Cx /Cab ). The Ca /Cb ratio was significantly affected by year (p less than 0.001), but not by site (p = 0.32). Similarly the Cx /Cab ratio was high at the central Ore Mountains in 1998 in comparison to the western Ore Mountains in 1998 and both localities in 2013 (year effect: p = 0.04; locality effect: p = 0.01). According to the Tukey–Kramer multiple comparison test, the Ca /Cb ratio at central Ore Mountains in 1998 was higher in comparison to western Ore Mountains in 1998. Both pigments ratios (Ca /Cb and Cx /Cab ) for both sites in 2013 decreased in comparison to values shown by central Ore Mountains in 1998. This implies that the trees at the central Ore Mountains recovered their photosynthetical apparatus, whilst trees in the western Ore Mountains did not show a significant temporal change in the ratio of photosynthetical pigments. This implies that the physiological status of needles of the first three needle age classes remained unchanged in the western Ore Mountains, while in the central Ore Mountains it had significantly improved by 2013 compared to 1998. Table 4. Mean ˘ standard deviation of the chlorophyll a + b (mg¨ g´1 ), pigments ratios, and relative water content (%) in the Norway spruce needles collected at the western and central Ore Mountains sites in 1998 and 2013. Different letters (a, b) indicate significant difference between year and site combinations according to the performed Tukey-Kramer test (α = 0.05). 1998
Needle Parameter Western Chlorophyll a + b (Cab ) Chlorophyll a/Chlorophyll b (Ca /Cb ) Total carotenoids/Total chlorophylls (Cx /Cab ) Relative water content (RWC)
2013 Central
a
3.61 ˘ 1.25 2.819 ˘ 0.122 b 0.125 ˘ 0.011 b 61.7 ˘ 5.1 a
Western a
3.12 ˘ 0.68 2.902 ˘ 0.105 a 0.136 ˘ 0.009 a 60.0 ˘ 4.8 ab
Central a
3.36 ˘ 0.10 2.804 ˘ 0.144 b 0.127 ˘ 0.008 b 57.4 ˘ 2.8 b
3.66 ˘ 0.57 a 2.766 ˘ 0.042 b 0.127 ˘ 0.005 b 58.3 ˘ 2.7 b
Table 5. Effect of year sampling, site and their interaction on content of photosynthetic pigments, their ratios and water content. Two-way ANOVA, n.s. = not significant, * significant with p < 0.05. Effect
Needle Parameter Chlorophyll a + b (Cab ) Chlorophyll a/Chlorophyll b (Ca /Cb ) Total carotenoids/Total chlorophylls (Cx /Cab ) Relative water content (RWC)
Year
Site
Year ˆ Site Interaction
0.49 n.s.