International Workshop on Acoustic Echo and Noise Control (IWAENC2003), Sept. 2003, Kyoto, Japan
DETECTION OF SPEECH EVENTS IN REAL ENVIRONMENTS THROUGH FUSION OF AUDIO AND VIDEO INFORMATION USING BAYESIAN NETWORKS Takashi YOSHIMURA, Futoshi ASANO, Youichi MOTOMURA, Hideki ASOH, Naoyuki ICHIMURA, Kiyoshi YAMAMOTO* and Satoshi NAKAMURA** AIST, Tsukuba JAPAN,
University of Tsukuba, Ibaraki JAPAN*, E-mail:
[email protected]
ABSTRACT A method of combining audio and video information for detecting and separating speech events in real environments is presented. The method is effective for automatic speech recognition under conditions of multiple sound sources. Sound localization using a microphone array and human tracking by stereo vision are combined using a Bayesian network for detecting speech events. Based on the detected information, the time and location of speech events, a maximum likelihood adaptive beamformer is constructed and the speech signal is separated from background noise and interference. An advantage of using the Bayesian network is that the scheme allows the correspondence of audio and video coordinates to be established with ambiguity by modeling a joint probability distribution. The results of off-line experiments in a real environment with television and/or music interference are presented as verification of the proposed scheme. 1. INTRODUCTION Separation of speech events is important when an automatic speech recognizer is used in real environments affected by noise and/or interference. Various methods have been proposed for speech enhancement, and the present authors have already proposed a method of sound source separation based on sound localization using a subspace method and maximum likelihood (ML) adaptive beamforming [1]. This system has been applied in automatic speech recognition, and is considered to have higher noise-reduction capability than other methods in the environments tested, such as offices and homes. However, this high performance is achieved only when the location and timing of the speech event are provided. The detection of speech events itself is also important for automatic speech recognition in real environments.
ATR, Kyoto JAPAN**
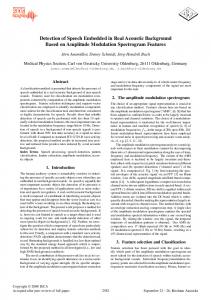
In this paper, a method for detecting speech events from multiple concurrent sound events is presented. The location and timing obtained from sound and vision detection functions are combined by a Bayesian network [2] for use by the system in detected target speech events. The timing of the speech event determined by this method is also useful for automatic speech recognition. 2. FUSION OF AUDIO AND VIDEO INFORMATION The basic techniques for speaker tracking used in the proposed method were first introduced in a previous report [3]. Sound localization is performed using a spatial spectrum obtained by a microphone array. An example of the data recorded for sound localization is shown in Figure 1(a). The MUSIC method [1] is extended here to the analysis of a broadband signal with eigenvalue weighting. In this spectrum, the region for observation is divided into Na bins, and the presence of a peak in each bin is detected and recorded in Boolean form (1 corresponding to peak being detected). (a) Spatial Spectrum
(b) Video Tracking
Figure 1: Example results of (a) sound localization and (b) vision tracking Figure 1(b) shows an example of the video information obtained by a stereo vision system. Similar to
319
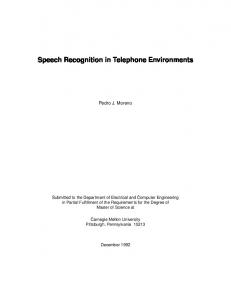
the sound information, the region of observation is divided into Nv bins, and the existence of a subject in each bin is recorded in Boolean form. Bayesian network is a probabilistic reasoning model that represents a conditional dependency among random variables using conditional probabilities, and gives a concise specification of joint probability distributions. This model consists of nodes and directed arcs connecting nodes, and each node corresponds to a random variable in real environments. Figure 2 shows the Bayesian network used for fusion of the audio and video information. A state of each node corresponds to the input shown in Figure 1. The nodes for audio and video correspond to the elements in the audio and video measurement vectors. The 19 audio nodes correspond to 19 regions of observation (from –90º to +90º in 10º bins), and the 10 video nodes correspond to 10 observation regions (from 1 to 480 pixels, in 48-pixel bins). The entire video region approximately corresponds to an audio angle of –35º to +35º. The probability of each state being the “Speaker” node is determined based on conditional probability tables (CPTs) and other evidence. In the present scheme, it is assumed that only one speech event will occur at any one time, amongst environmental noise. The connections between audio and video nodes, representing the states of the speaker node, simply emphasize that both of the corresponding observation nodes are in the state of “1”
Figure 2: An example of Bayesian network state Training data for the Bayesian network was provided by a single speaker speaking in the range covered by the stereo camera. As a label, the physical direction of the speaker and the time of speaking were supplied to the training samples. CPTs of P(An|S) and P(Vn|S), can be estimated from training samples. Here, S denotes the state of the speech event as follows: S = {S1,…,SNs,NoEvent}. The state corresponds to the speaker’s position (angle), for example {-30º, …,+30º}; when S = –30º, the speaker is located in the direction of –30º and is speaking. NoEvent indicates that no speech event is detected. For the training samples, the value of S was given as a label for each measurement vector.
In operation, the measurement vectors for audio and video are obtained at every time block as evidence. Using the evidence and CPTs obtained above, the conditional probability is calculated and the most probable state of S given the values of audio and video nodes can be determined, i.e., Na
Nv
n =1
n =1
P( S | A1 ,..., AN a ,V1 ,...,VN v ) = P (S )∏ P( An | S )∏ P (Vn | S ) / Z
where Na
Nv
n =1
n =1
Z = ∫ P ( S )∏ P ( An | S )∏ P (V n | S )dS S
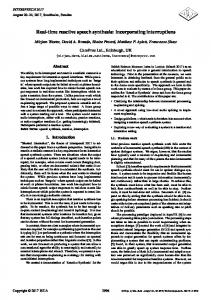
Figure 3 shows a block diagram of the entire system. The information obtained on a speech event can also be used in the speech recognizer module. Vison Tracking Sound Localization
Bayesian Network
Sound Separation
Speech Recognition
Figure 3: Block diagram of the proposed audio-video fusion scheme
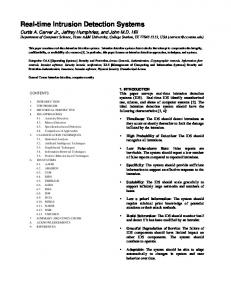
3. EXPERIMENTS The proposed scheme was preliminarily evaluated through a detection experiment for speech events. The experiment was conducted in a medium-sized meeting room with a reverberation time of 0.5 s. Figure 4 shows the layout of the experiments, and Table 1 lists the parameters of sound localization and subject tracking by vision. For training data, a single speaker spoke intermittently for 30 s in the directions of –30º to +30º, the range covered by the camera, at 5º intervals. As a label (state of S), the physical direction of the speaker and the time of speaking was supplied with the training samples.
Figure 4: Photograph of the experimental setup
320
Figure 5 shows the audio and video CPTs obtained by learning using the training samples. In the detection experiment, two speakers were set, located at 0º and –20º. As interference sources, a television playing human voice and music and a loudspeaker playing music were located at +30º and –90º, respectively. Figure 6 shows the status of input nodes for the Bayesian network from the audio and video data vectors. The vertical slice in this figure corresponds to the data vector at time t. Figure 7(a) shows the results of inference, depicting the detected speech events with respect to time, and Figure 7(b) shows the true speech events. The speech events were detected with reasonable accuracy. Using the information of the detected speech events, the ML beamformer was updated and the signal from the microphone array is processed at every time block. The speech signal that was originally obscured by the interference is recovered with audible clarity by this ML beamforming.
(b) Data vectors for video
(a) Data vectors for audio 1
90
1
408 0.9
70
0.9
360 0.8
50
0.8
312 0.7
30
0.7
264 0.6
10
0.6
216 0.5
0.5
168
10
0.4
0.4
120
30
0.3
0.3
72
50
0.2
0.2
24
70
0.1
0.1
24
90
0
0
5
10
15 20 25 Time Index
30
5
35
10
15 20 25 Time Index
30
35
Figure 6: (a) Audio and (b) video data vectors
(a) Inference Results 30
(b) True Speech Segments 0.9
30
0.8
20
20 0.7
Table 1: Parameters for sound localization and vision tracking
10
0.6
10
0.5
0
0
0.4
Audio Sampling Frequency FFT Length Window Overlap Frequencies of interest Number of Mic., M Microphone Array Video Frame Rate Camera
10
16KHz 512 128 500-3,000Hz 8 Circular ( φ =50cm)
20
(a) CPT for Audio
30
1
80
0.9
0
0.9
60
0.8
50
0.8
40
0.7
100
0.7
20
0.6
150
0.6
0
0.5
200
0.5
20
0.4
250
0.4
40
0.3
300
0.3
60
0.2
350
0.2
0.1
400 0
N/E 30
20
10 0 True Angle
10
20
30
0.1
N/E 30
20
10 0 True Angle
10
Figure 5: (a) Audio and (b) video CPTs obtained using observed data
20
30
30
10
15 20 25 Time Index
30
35
5
10
15 20 25 Time Index
30
35
Figure 7: (a) Interference results and (b) true speech segments
Vision CPT (True) 1
20
0
5
(b) CPT for Video
Audio CPT (True)
0.2
0.1
10frames/sec. Digiclops® stereo vision camera (Point Grey Research Inc.)
80
10 0.3
The fusion method was then evaluated in detail through a speech recognition experiment. The experiment was conducted in the same room as the previous experiment under the same conditions (Table 1) and using the CPTs trained in the previous run. In the recognition experiment, two male speakers were set standing at +15º and –25º, 1.5 m from the video camera (center of the microphone array). The speaker in the direction of +15º spoke 492 VCV/CVC phonetically balanced Japanese words (ETL-WD-I) [4] on odd counts, and the speaker in the direction of –25º spoke the words on even counts, alternating with short pauses. A loudspeaker playing music was located at –90º as an interference source. S/N ratio was approximately 0dB. Isolated word recognition was conducted using the detected speech events separated by the ML beamformer. Discrete-type Hidden Markov Models (HMMs) were employed for word recognition [5]. The HMMs were speaker-independent monophone models of male clean speech from the Japanese Newspaper Article Sentences (JNAS) speech database [6].
321
4. CONCLUSION
Table 2: Detection rates of speech events using detection boundary
Table 2 shows the detection rates of speech events using the proposed scheme. The detection date was defined as the number of frames of speech events and non-speech segments detected properly, divided by the total number of frames. The precision rate was defined as the number of frames of true speech events detected properly, divided by the number of frames of detected speech events. The recall rate was defined as the number of frames of detected true speech events divided by the number of frames of true speech events. Deletion of the beginning and end of the spoken words in the detected speech events causes that the detection rate when using a speech detection boundary without expansion is lower than with expansion. Table 3 shows the word recognition rates. The F-measure [7] represents a combined evaluation of the precision rate and the recall rate, defined as β 2 + 1 PR / β 2 P + R . If β > 1 , the precision is more important than recall, which is the case for speech recognition through speech detection (β = 2) .
A method for combining audio information for sound localization using a microphone array, and video information for subject tracking using a stereo vision system was proposed. The fusion of this audio and video information allows speech events to be detected in the temporal and spatial domains. Speech signals from speakers were separated using a sound separation system based on the detection results. A Bayesian network was used to combine the audio and video information by establishing a correspondence between the audio and video coordinate while allowing for ambiguity in estimation. Good results in isolated word recognition experiments demonstrate the effectiveness of the fusion method for automatic speech recognition in real environments. In the future, the authors intend to incorporate more information sources, such as voice activity detection or a mouth motion detection [8]. The use of multiple information sources is expected to increase the robustness of speech detection. The scheme proposed in the present report readily allows for the addition of more input nodes as a new information source as an advantage of using the Bayesian network. Phone model adaptations for real environments from clean speech conditions are also planned for more effective speech recognition in the future. The incremental adaptation of phone models is expected to develop an automatic speech recognizer for moving subjects and/or interferences.
Table 3: Word recognition rates
REFERENCES
A B C
Precision rate Detection rate 86.6% 85.6% 77.8% 63.8% 56.2% 46.2% A: without expansion B: expanded before and after 0.5 s C: expanded before and after 1.0 s
(
) (
Recall rate 78.3% 97.8% 99.2%
)
Word accuracy rate Single mic. without Mic. array with sound separation sound separation A 20.5% 68.1% B 30.1% 79.1% C 31.5% 80.1% A: without expansion B: expanded before and after 0.5 s C: expanded before and after 1.0 s
F-measure (β = 2) 0.797 0.884 0.807
The word recognition rate is higher when using a speech detection boundary expanded to include 0.5 s before and after the event. The F-measure (β = 2) also becomes highest when using the same expanded speech detection boundary. In these experiments, expansion by 0.5 s before and after the detected speech provides the best performance for isolated word recognition.
[1] F. Asano et al, “Real-time sound source localization and separation system and its application to automatic speech recognition”, Proc. Eurospeech 2001, B43, pp. 1013-1016, Sep. 2001 [2] F.V. Jensen, Bayesian Networks and Decision Graphs, Springer-Verlag, New York, 2001 [3] F. Asano et al, “Fusion of audio and video information for detecting speech events”, Proc. Information Fusion 2003, Jul. 2003 [4] K. Tanaka et al, “The ETL speech database for speech analysis and recognition research”, Proc. ICSLP90, 24.7, pp. 1101-1104, Nov. 1990 [5] S. Young et al, The HTK Book (for HTK Version 3.1), Cambridge Univ. Engineering Department, 2001 [6] K. Itou et al, “IPA Japanese dictation free software project”, Proc. LREC2000, pp. 1343-1349, May 2000 [7] C. J. van Rijsbergen, Information Retrieval (second edition), Butterworths, London, 1979 [8] K. Murai et al, “Real time face detection for multimodal speech recognition”, Proc. IEEE ICME2002, vol.2, pp. 373-376, Aug. 2002
322