Dec 12, 2015 - exposing patients to risks of mismatched transfusion. Failure to detect ... reported from 2006 to 2014 resulted in serious morbidity.5. Failures of ...
IMMUNOHEMATOLOGY Detection rate of blood group alloimmunization based on real-world testing practices and kinetics of antibody induction and evanescence Gary Stack1,2 and Christopher A. Tormey1,2
BACKGROUND: Failure to detect non-ABO blood group alloantibodies places patients at risk for hemolytic reactions. Suboptimal alloantibody detection could result from posttransfusion testing performed too early, too late, or not at all. Testing performed too early may precede antibody induction, while testing performed too late could miss antibodies that have evanesced. Taking these factors into account, our goal was to determine the percentage of alloantibodies detected with real-world testing practices. STUDY DESIGN AND METHODS: The alloantibody detection rate in a general hospital setting was determined based on the frequency and timing of antibody testing after red blood cell (RBC) transfusions and rates of antibody induction and evanescence. Intervals to follow up testing after RBC transfusions (n 5 561 RBC units in 100 random patients) were determined retrospectively. Best-fit lines and equations for antibody induction and evanescence were computed on previously published data. RESULTS: Nearly half (271/561; 48.3%) of RBC infusions had either no follow-up antibody screen or testing too soon (112”); total RBC units 5 561. (B) Time intervals to the first posttransfusion antibody screen after each RBC unit transfusion that had any follow-up testing (n 5 425). Data are grouped into bins, each of which represents a 29-day time span. The time intervals to the first follow-up antibody screen ranged from 1 to 4903 days. RBC units whose first follow-up test was performed more than 719 days posttransfusion were grouped into a single bin (n 5 73; rightmost column). (C) Bar heights represent the number of patients with the indicated number posttransfusion antibody screens (total number patients, 100; total number of antibody screens, 379).
results revealed that the FADR depended on when the follow-up antibody screens were performed, ranging from a mean of 0.518 for RBC units that had follow-up testing only during the period from 30 to 112 days posttransfusion to a mean of 0.858 for units with follow-up testing both 30 to 112 and more than 112 days posttransfusion (Fig. 4). The overall mean FADR for all RBC units, calculated using the results of Fig. 4, was 0 times the number of transfusions that had no testing or testing only fewer than 30 days posttransfusion, plus 0.518 times the number of transfusions with follow-up testing 30 to 112 days posttransfusion, plus 0.536 times the number of transfusions with testing only more than 112 days, plus 0.858 times the 2664 TRANSFUSION Volume 56, November 2016
number of transfusions with testing at both 30 to 112 and more than 112 days, all divided by the total number of RBCs transfused, that is, [(0 3 271) 1 (0.518 3 58) 1 (0.536 3 161) 1 (0.858 3 71)] 4 561 5 0.316. That is, only 31.6% of non-ABO blood group alloantibodies were predicted to be detected by real-world compatibility testing.
DISCUSSION We have tracked the frequency and timing of follow-up antibody screen testing after RBC transfusions in a general hospital setting. The testing that we analyzed was entirely
DETECTION RATE OF RBC ALLOIMMUNIZATION
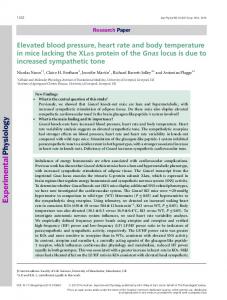
Fig. 2. Time courses of blood group alloantibody induction and evanescence. (A) The antibody induction curve was a best-fit line drawn through data points taken from Table 2 of Redman et al.6 (B) The antibody evanescence curve was a best-fit line drawn through data points taken from Table 3 of Tormey and Stack.15 The 10-year detection rate was set at 30%, based on results of multiple studies.12,14,15
at the discretion of the patients’ providers and, therefore, represented real-world practice. No policy existed at the study site for intentional surveillance of posttransfusion antibody development. The findings indicated highly variable testing with no apparent systematic effort to detect blood group alloimmunization posttransfusion. Notably, no follow-up testing was carried out after almost half of all transfusions. Therefore, it is likely that posttransfusion testing was only carried out when additional transfusion was anticipated. We developed a mathematical model for estimating the percentage of blood group antibodies that are detected in the course of routine blood bank testing. Remarkably, the results indicated that less than one-third of blood group alloantibodies were detectable. In the six
sigma quality model, where a six sigma success rate is considered near ideal and 3.5 sigma is generally considered good, this represents a one sigma success rate, which is poor.18,19 This low detection rate is the consequence of three factors: 1) sporadic posttransfusion follow-up testing, 2) a lag period before antibody induction, and 3) the fact that antibodies do not remain permanently detectable. This low detection rate has several implications. First, and most importantly, it creates a risk for DHTRs. In addition, it indicates that previously reported alloimmunization rates in general hospital populations17,20-23 have been significantly underestimated—by a factor of at least three. Key elements of the mathematical model were bestfit line equations of antibody induction and evanescence, calculated from our previously published time course data on antibody evanescence15 and data from a prospective study of antibody induction conducted by Redman and colleagues.6 To our knowledge mathematical descriptions of blood group antibody induction and persistence or evanescence have not been attempted previously. The best-fit line equations proved to be remarkably good fits to the data with coefficients of determination very close to 1.0. It should be noted that antibody evanescence or “decay” is not expected to be a simple stochastic process, like radioactive decay, because blood group alloantibodies of different specificities have different evanescence rates.15 For example, anti-Jka on average is characteristically short-lived and anti-D is long-lived. Therefore, the evanescence curve of total alloantibodies represents an average of multiple different decay processes occurring in parallel. While the best-fit line equations for antibody induction and evanescence were only tools to calculate the alloantibody detection rate for the current study, they may have inherent value for modeling of immunologic processes. The antibody detection rate represents a snapshot in time for the patient database and is significantly weighted by the fraction of the transfused population that had no follow-up testing. If any of these untested patients were to require transfusion again in the future, they in fact would undergo an antibody screen again as part of pretransfusion compatibility testing. The risk of undetected alloimmunization in that case would correspond to that predicted for testing performed at either 30 to 112 or more than 112 days posttransfusion, depending on how much time had elapsed since the most recent transfusion. Thus, the risk of missing an antibody would more likely fall in the 40% to 50% range, instead of near 70%. Such a risk is still much higher than should be deemed acceptable. Two simplifying assumptions of our model likely resulted in a slight overestimation of the alloantibody detection rate. First, we assumed that all antibodies are detectable by 112 days, since the induction curve had plateaued by that time. However, this excludes 5% of Volume 56, November 2016 TRANSFUSION 2665
STACK AND TORMEY
Fig. 3. Equation for calculating the FADR.
Fig. 4. Mean FADR for testing performed during the indicated time ranges. The bar labeled “30-112 & >112” indicates that at least one antibody screen was performed in each of the two indicated time ranges. Details regarding the calculation of the detection rates can be found under Results.
antibodies that are late-induced outliers (Fig. 2A).6 The resulting slight left shift of the induction curve should have caused a minimal overestimation of antibody detection at time points before full induction. We also made the assumption that no evanescence occurred less than 112 days posttransfusion, although evanescence is already evident by that time (Fig. 2B). Since we did not take this early evanescence into account, detectability in the 30- to 112day period posttransfusion will be overestimated. Elimination of these errors would require a substantially more 2666 TRANSFUSION Volume 56, November 2016
complicated calculation, which would only lower the estimated detection rate and strengthen the conclusions. A potential criticism of the study is that it was based on posttransfusion testing practices at a single institution. However, while the predicted antibody detection rate that we calculated was disturbingly low, it may actually be higher than would be observed in some other general hospital populations. This is because the detection rate should be directly related to the number of type-andscreens performed per patient, and transfused patients at VACHCS had a higher number than reported for at least one other institution. The mean and median number of types-and-screens at the VACHCS were 5.6 and 4.0, respectively, whereas they were 3.9 and 3.0 in the general patient population of an alloimmunization study by Schonewille and colleagues.14 It should be noted that any patients who have more frequent follow-up testing than patients in our study population, such as those receiving chronic transfusions, should have higher antibody detection rates. Another factor that can affect antibody detection is the sensitivity of the testing method. More sensitive techniques should allow earlier detection of antibodies, prolong their period of detectability, and result in a greater antibody detection rate. The antibody induction curve that we used in our calculations was dependent on the sensitivity of the antibody testing methods used by Redman and coworkers.6 To maximize detection they used multiple techniques on most patient samples, including a two-stage papain technique, a manual polybrene technique carried through to the indirect antiglobulin phase, and a normal ionic strength indirect antiglobulin test. Unfortunately, it is unclear how the sensitivity of their test
DETECTION RATE OF RBC ALLOIMMUNIZATION
combination compares to that of current gel and solidphase screening assays and whether the newer techniques would have yielded a slightly different induction curve. Newer techniques with improved sensitivity might reveal a slightly lower evanescence rate than what we observed. However, any effect on the overall antibody detection rate should be small and offset by our simplifying assumption of no evanescence at times before 112 days posttransfusion. In conclusion, despite the best efforts of transfusion services, compatibility testing misses most blood group alloimmunization. Overall, we estimate that real-world testing detects less than one-third of non-ABO blood group alloantibodies. This low rate creates the risk for delayed serologic transfusion reactions and DHTRs for previously transfused patients. Improvement in alloimmunization detection could be achieved by more frequent and systematic follow-up antibody screening after transfusion. Given the rapid evanescence of some antibodies, testing every 2 weeks from 1 to 6 months posttransfusion, a schedule similar to that of Redman and colleagues, is probably necessary to detect all or virtually all antibodies. However, testing two (3 and 6 months posttransfusion) or three (2, 4, and 6 months posttransfusion) times in the 6 months after transfusion would represent more feasible schedules that should detect substantially more antibodies than current practice. Enhancement in the sensitivity of antibody screening techniques also might allow the better detection of antibodies, assuming that evanescent antibodies are still present, but below the detection threshold of current screening assays. ACKNOWLEDGMENT
gov/biologicsbloodvaccines/safetyavailability/reportaproblem/ transfusiondonationfatalities/default.htm. 5. U.K. Serious Hazards of Transfusion (SHOT) Steering Group. SHOT annual reports and summaries [Internet]. Manchester (UK): SHOT Office; [cited 2016 Feb 22]. Available from: http://www.shotuk.org/shot-reports/. 6. Redman M, Regan F, Contreras M. A prospective study of the incidence of red cell allo-immunisation following transfusion. Vox Sang 1996;71:216-20. 7. Gunson HH, Stratton H, Cooper DG, et al. Primary immunization of Rh-negative volunteers. Br Med J 1970;1:593-5. 8. Contreras M, Mollison PL. Failure to augment primary Rh immunization using a small dose of “passive” IgG anti-Rh. Br J Haematol 1981;49:371-81. 9. Harm SK, Yazer MH, Monis GF, et al. A centralized recipient database enhances the serologic safety of RBC transfusions for patients with sickle cell disease. Am J Clin Pathol 2014; 141:256-61. 10. Ramsey G, Larson P. Loss of red cell alloantibodies over time. Transfusion 1988;28:162-5. 11. Ramsey G, Smietana SJ. Long-term follow-up testing of red cell alloantibodies. Transfusion 1994;34:122-4. 12. Reverberi R. The persistence of red cell alloantibodies. Blood Transfus 2008;6:225-34. 13. Rosse WF, Gallagher D, Kinney TR, et al. Transfusion and alloimmunization in sickle cell disease. The Cooperative Study of Sickle Cell Disease. Blood 1990;76:1431-7. 14. Schonewille H, Haak HL, van Zijl AM. RBC antibody persistence. Transfusion 2000;40:1127-31. 15. Tormey CA, Stack G. The persistence and evanescence of blood group alloantibodies in men. Transfusion 2009;49:505-12. 16. Alves VM, Martins PR, Soares S, et al. Alloimmunization screening after transfusion of red blood cells in a prospective
This material is the result of work supported with resources and the use of facilities at the VA Connecticut Healthcare System, West Haven, CT.
study. Rev Bras Hematol Hemoter 2012;34:206-11. 17. Tormey CA, Fisk J, Stack G. Red blood cell alloantibody frequency, specificity, and properties in a population of male
CONFLICT OF INTEREST The authors have disclosed no conflicts of interest.
REFERENCES
military veterans. Transfusion 2008;48:2069-76. 18. Chassin MR. Is health care ready for six sigma quality? Milbank Q 1998;76:565-91. 19. Quest Diagnostics. What is six sigma quality at Quest Diagnostics? [Internet]. 2000-2016 [cited 2016 Mar 25]. Available from: http://www.questdiagnostics.com/home/about/oper-
1. Pineda AA, Taswell HF, Brzica SM Jr. Transfusion reaction.
ations/quality/six-sigma.html. 20. Hoeltge GA, Domen RE, Rybicki LA, et al. Multiple red cell
An immunologic hazard of blood transfusion. Transfusion
transfusions and alloimmunization. Experience with 6996
1978;18:1-7.
antibodies detected in a total of 159,262 patients from 1985 to 1993. Arch Pathol Lab Med 1995;119:42-5.
2. Hendrickson JE, Tormey CA, Shaz BH. Red blood cell alloimmunization mitigation strategies. Transfus Med Rev 2014;28: 137-44. 3. Vidler JB, Gardner K, Amenyah K, et al. Delayed haemolytic
21. Spielmann W, Seidl S. Prevalence of irregular red cell antibodies and their significance in blood transfusion and antenatal care. Vox Sang 1974;26:551-9.
transfusion reaction in adults with sickle cell disease: a
22. Walker RH, Lin DT, Hartrick MB. Alloimmunization follow-
5-year experience. Br J Haematol 2015;169:746-53.
ing blood transfusion. Arch Pathol Lab Med 1989;113:254-61. 23. Winters JL, Pineda AA, Gorden LD, et al. RBC alloantibody
4. Transfusion/donation fatalities [Internet]. Silver Spring (MD): U.S. Food and Drug Administration; last updated 2015
specificity and antigen potency in Olmsted County, Minne-
Dec 12 [cited 2016 Feb 22]. Available from: http://www.fda.
sota. Transfusion 2001;41:1413-20. Volume 56, November 2016 TRANSFUSION 2667