Vol. 10(27), pp. 2642-2650, 2 July, 2015 DOI: 10.5897/AJAR11.837 Article Number: C0B90DF53866 ISSN 1991-637X Copyright © 2015 Author(s) retain the copyright of this article http://www.academicjournals.org/AJAR
African Journal of Agricultural Research
Full Length Research Paper
Determinants of meat consumption pattern among university students in the Eastern Cape Province of South Africa Hosu Y. S.1*, Arowolo A. S.1 and Fayemi P. O.2 1
Department of Agricultural Economics and Extension, Faculty of Science and Agriculture, University of Fort Hare, Eastern Cape, South Africa. 2 Department of Livestock and Pasture Science, Faculty of Science and Agriculture, University of Fort Hare, P. M. B. X1314, Alice 5700, Eastern Cape, South Africa. Received 25 March, 2012; Accepted 26 April, 2015
There is a dearth of information on factors influencing the feeding habits and daily consumption of meat among university students in the Eastern Cape Province (ECP) of South Africa. As a result, this study was conducted by administering questionnaires to a total of 150 respondents from the black dominated and the white dominated Universities in the ECP. The results revealed that students from black dominated University (35%) showed more inclinations towards self-catering. Most of the males (80%) between 18 and 38 years, consumed above the recommended daily meat intake. On the contrary, female students from the white dominated university indicated higher preference for fast food due to availability of more disposable income and personal ethics. Probit regression model (χ2:(9) 64.07(0.0000). Log likelihood: -52.860879 Pseudo R2:37.73) showed that age (0.0506), monthly allowances (0.0002), amount spent on food (-0.0004), campus location (0.6587) and consumption of close substitutes such as fish (-3.3067) and vegetables (-86.4090) were significant determinants of meat consumption among university students. Key words: Eating habits, recommended meat intake, monthly allowance, campus location, university students.
INTRODUCTION In her post-apartheid era, South Africa has undergone enormous economic development and general improvement in food consumption patterns. As a consequence, common class citizens within the human society has been accorded the right to defend their interest in and advocate diverse food orientations as meat consumers, vegetarians and vegans (Hume, 2010;
Fayemi and Muchenje, 2012; Ruby, 2012). Similar to what is obtainable in industrialised countries (Jensen and Smed, 2007; Sánchez et al., 2010; Grumert et al., 2011), the economic growth and transition towards market economy has significantly transformed South Africans’ consumption patterns and feeding habits. With improved market accessibility, increased income and availability of
*Corresponding author. E-mail:
[email protected] Tel: +27788140722. Author(s) agree that this article remain permanently open access under the terms of the Creative Commons Attribution License 4.0 International License
Hosu et al.
financial aids (NSFAS, 2009), students in tertiary institutions are progressively shifting their food choice from unrefined grains to meat and other fast food products. This phenomenon has consequently impacted on the dietary preferences in line with the psychological variables, functional and cognitive peculiarities of the age-bracket in the tertiary institutions. At the apex of food hierarchy in African context however, meat is a focal point in the meals of many homes where it provides the cherished quintessential status (Lokuruka, 2006; Fayemi and Muchenje, 2012). This food preference has thus motivated studies on meat species and meat products (Vandenriessche, 2008; Fayemi et al., 2011) and also, responsible for the growing concerns on food choices and consumption patterns in different societies (Holsten et al., 2012). The impact of these concerns has shown that students living away from home tend to develop peculiar eating habits contrary with those living with their families (Barquera et al., 2003; Papadaki et al., 2007). With due consideration for gender, age groups, educational and income status (McArthur et al., 2006; Temple et al., 2006; Adams and Rini, 2007), the nutritional status, consumption patterns and feeding habits of infants, adolescents and the elderly have been promoted (Susanna et al., 1995; Kant, 2003; Russell and Cox, 2004). So far, there is a paucity of information on studies that specifically address the consumption patterns and feeding habits of university students. This study therefore considered it imperative to examine the feeding habit and meat consumption pattern among the black and white dominated university students in the ECP where inequalities had been previously experienced.
2643
location + fish intake + vegetable consumption) Where: Pcmc = per capita meat consumption of the University student Age = mid age of the groups Mntdisalow = monthly disposable allowance of the student Weight = average weight of the student Amtsof = amount spent on food fh = food habit The model used is explicitly stated as
Yi 0 1 X 1 2 X 2 .... 9 9 i Where Yi is the dichotomous dependent variable represented by dummy variable 1 for attainment of recommended meat consumption (those who consumed below or equal to the baseline) per day, and 0, is for otherwise (those who consume above the baseline). Y= per capita meat consumption of the student. When attained the required level 1, otherwise 0, β0 = constant term
1, ... 9 = the regression coefficients
X1 = Age of the student (in years) X2 = Genders X3 = Monthly disposable allowance (in Rand) X4 = Amount spent on food (in Rand) X5 =weight of the student X6 = Food habit (self-catering or otherwise) X7 = Fish intake X8 = vegetable consumption X9 = Location of the Universities The basic model of probit estimation involves defining a variable Z that is a linear function of the variables that determine the probability:
Z 0 1 X 1 .... n X n
(1)
METHODOLOGY A cross-sectional study was carried out among students (n=150) within 16 and 45 age bracket, from two universities in the Eastern Cape Province, South Africa. Socio-demographic variables, of the respondents including gender, age-group, monthly disposable amount spent on feeding were captured in the questionnaire. Other responses that elicited their food habits, source of income or finance, amount spent on food items and the quantity of food items consumed and weight of individual students also featured.
Statistical analysis Descriptive statistics were performed to compare respondents’ socio-demographic characteristics, meat intake and consumption patterns. Close substitutes were tested with respect to the standard on recommended protein intake of the respondents (Joint FAO/WHO/UNU Expert Consultation report, 1992). Factors influencing the recommended daily meat intake among the respondents were analysed by probit regression model analysis. Probit regression model was fitted for both universities with a dummy variable for location of the universities and to identify the variables that significantly influenced per capita meat consumption among the University students. The theoretical relationship (Table 1) among the variables is as shown below: Pcmc= f (age, +gender, + mntdisalow + weight + amtsof + fha+
Where f (Z) = the cumulative standardized normal distribution, give the probability of the event occurring for any value Z p1=F (Z)
(2)
The maximum likelihood analysis is used to obtain estimates of the parameters. The marginal effect of X is
p dp Z X i dZ X i
= f (Z)
i
(3)
Since F (Z) is the cumulative standardized normal distribution, f(Z) its derivative, it is therefore the standardized normal distribution itself:
f (Z )
1 2
1
e 2Z2
(4)
The binary function (above) was used because its output is confined to values between 0 and 1, and also takes value from negative infinity to positive infinity. The basic assumption was that the students who had meat intake less than or equal to the baseline (0.212 kg) was scored 1 (that is, attained) and those who
2644
Afr. J. Agric. Res.
Table 1. Specification for probit regression model.
Variables Recommended meat intake per day Age group: Represented by mid-age of the group Gender: 0=male, 1=female Weight (average weight) Monthly Disposable Allowance (represented by mean monthly allowance)
Notations Dependent variable (dichotomous) : 1 for attainment, and 0 for otherwise (not attained)
Expected significance
Independent variable X1
Positive
Independent variable X2 Independent variable X3
Males expected to consume more than female. Inverse relationship with Meat consumption.
Independent variable X4
Higher disposable allowance is expected enhance higher probability of attainment
Amount spent on food
Independent variable X5
Eating Habits: 1 for self prepared food, 0, otherwise
Independent variables X6
Per capita fish intake
Independent variable X7
Per capital vegetable intake
Independent variable X8
Location: 1=rural, 0= urban
Independent variable X9
Attained or not
More percentage spent on feeding, the higher the probability of attainment. Self-prepared meal is expected to have higher influence on probability of attainment. This is a close substitute. It has inverse relationship with per capita meat intake. This could have both negative/positive influence depending on eating habit
Table 2. Baseline daily recommended protein intake (Adapted from the Joint FAO/WHO/UNU Expert Consultation report, 1992).
Age groups Girls ages 14-18 Boys ages 14-18 Women ages 19-40+ Men ages 19-40+
Grams (per capita) of protein needed per day 46 52 46 56
Source: The Joint FAO/WHO/UNU Expert Consultation report, 1992.
consumed more than the required per capital intake was scored 0, or otherwise. It was further assumed that those who consumed less than the recommended intake could make it up through other sources (close substitutes). The variable Z represents the exposure to some set of independent variables, while ƒ (Z) represents the probability of a particular outcome, given a set of explanatory variables. The variable Z is a measure of the total contribution of all the independent variables used in the model. Probit regression model was preferred for this analysis because whether a coefficient has a positive or negative influence; it does not increase or decrease the probability (Schroeter et al., 2007). In addition, it strengthens the explanatory power of variables and produces relevant interpretation about the eating habits and meat consumption pattern of the respondents. The relationship between dependent variable, Y and X’s, the independent variable are expressed in Table 1 below. Each of the regression coefficients describes the size of the contribution of the specified independent variable. A positive regression coefficient means that the independent variable increases the probability of the outcome, while a negative regression coefficient means that the variable decreases the probability of that outcome; a large regression coefficient means that the independent variable strongly influences the probability of that outcome, while a near-zero regression coefficient means that the variable (independent) had little influence
on the probability of that outcome.
RESULTS AND DISCUSSION This study empirically identified the socio-economic factors influencing eating habits and meat consumption patterns among the university students in black and white dominated Universities. The specifications on the probit regression model and standard on the daily recommended protein intake are presented in Tables 1 and 2 respectively. It was observed (Table 3) that 35% of the students in the University of Fort Hare (Black Dominated University (BDU) prepare their meals (through self-catering) as compared to 31% recorded in Rhodes University (White Dominated University (WDU). Students (17.5%) from the BDU prefer eating in the university dining hall but patronising fast food outlets was observed as the major eating habits in the WDU. The need for privacy could be attributed to the motivating factor influencing university students to exhibit such feeding
Hosu et al.
2645
Table 3. Demographic and socioeconomic characteristics of the respondents.
Characteristics
University of Fort Hare Count Frequency (%)
Rhodes University Count Frequency (%)
Age group (Years) 15-20 21-25 26-30 31-35 36-40 Above 40+
7 49 11 10 2 1
8.8 61.3 13.8 12.5 2.5 1.3
12 29 12 10 5 3
16.9 40.8 16.9 14.1 7.0 4.2
Gender Male Female
53 27
66.3 36.7
40 31
56.3 43.7
Monthly disposable allowances Below R2000 R2100-4000 R4100-6000 R6100-8000
61 10 6 3
76.3 12.5 7.5 3.8
23 35 8 5
32.4 49.3 11.3 7.0
Amount spent on feeding Below 20% 21-40% 41-60% 61-80% 81-100%
17 22 25 11 5
21.3 27.5 31.3 13.8 6.3
5 18 26 21 1
7.0 25.4 36.6 29.6 1.4
28 14 17 21
35.0 17.5 21.3 26.3
22 11 25 13
31.0 15.5 35.2 18.3
57 13
71.3 28.8
27 43
38.0 62.0
Eating habit Prepare own meal Patronise University dining hall Patronise fast food outlets Others Study level Undergraduate Postgraduate
habit (Miller, 2001; Blunt and Dowling, 2006). Intuitively, it could be cheaper to prepare meals than to buy cooked or processed foods because of the cost of added value for eating the fast food and the probability of improving per capita intake of meat by students by a unit. These results are consistent with previous research which found consumers feeding habit to be dependent on what they considered appropriate (Sosa et al., 2005). Elsewhere, those who even discriminated against milk and vegetables still indicated heavy dependence on fast-food consumption (Schroeter et al., 2007). The concept of ‘ethical everyday’ should be borne in mind in this scenario as the moral guidelines that informed the conduct of the respondents to either adopt self-catering approach or the habit of eating in the dining hall (Borgmann, 2000; Smith, 2000). In agreement with Hall (2011), basic ethical principles of right versus wrong;
good versus bad, render consumer behaviour as an outlet for the expression of personal ethics. Forming the habit of eating fast food can thus be based on the availability of higher disposable incomes (Csikszentmihalyi, 2000; Abela, 2006; Hume, 2010) which is peculiar with the Y-generation consumers that purchase more, demand more and live on higher debt to equity ratio than their parents. Although students seek other means of feeding themselves due to the peculiarity of their campus locations yet, a total of 80% of male students (under the age of 18 and 38 years) in BDU consumed above the recommended meat intake (52g and 56 g) per day (Table 4). Granted that gender class in both universities, reflects the peculiarities of consuming the required quantity of meat per day, the female students however eat less meat (46 g) per day than their male counterpart. Variation in
2646
Afr. J. Agric. Res.
Table 4. Meat intake of students from the black dominated University (University of Fort Hare).
Characteristics Above recommended intake Recommended intake
Count 55 26
Frequency 67.9 32.1
Valid percent 67.9 32.1
Cumulative 67.9 100
Above recommended Less than/ equal to recommended Total
18.0 4 (80.0) 1 (10.0) 5
23.0 19 (61.3) 12 (38.7) 31
Mid Age (%) 28.0 33.0 4 (57.1) 0 3 (42.19) 2 (100) 7 2
38.0 4 (80.0) 1 (20.0) 5
43.0 0 0 0
31 (62.0) 19 (38) 50
Above recommended Less than/ equal to recommended Total
2 (66.7) 1 (33.3) 3
15 (83.3) 3 (16.7) 18
3 (75) 1 (15.0) 4
1 (33.3) 2 (66.7) 3
2 (100) 0 2
24 (77.4) 7 (22.6) 31
Gender
Recommended meat intake per day
Male
Female
1 (100) 0 1
Total
Table 5. Meat intake of students from the white dominated University (Rhodes University).
Characteristics Above recommended intake Recommended intake
Frequency 57 13
Percent 81.4 18.6
Valid percent 81.4 18.6
Above recommended Less than/ equal to recommended Total
18.0 5 (100) 0 5
23.0 13 (86.7) 2 (13.3) 15
Mid Age (%) 28.0 33.0 8 (80.0) 2 (66.7) 2 (20.0) 1 (33.3) 10 3
Above recommended Less than/ equal to recommended Total
6 (75) 2 (25.0) 8
13 (100) 0 13
2 (100) 0 2
Gender
Recommended meat intake per day
Male
Female
age and gender groups seems somewhat perceptive here as it reflects what is obtainable in food security research (Morrison et al., 2011). Earlier studies found similar associations where age, race or ethnicity and income were associated with food group intake by boys and adolescent boys and girls eating equal proportion of fast food (Bezerra et. al., 2014). As a result, Sosa et al. (2005) did attribute consumers’ food choice and intake to their age, gender, education, health and also to the appearance, texture, flavour, price, urbanisation and family type. Thus meat-eating and the negative feelings associated with meat are strongest among females (Gregory, 1997). Moreover, the consumption pattern of female students in the University of Fort Hare (BDU) getting an average monthly allowance of R3000 is higher (in both “above the recommended” and “less/equal recommended level”) than their male counterparts (Table 4). Female students that are getting monthly allowance in the range of R1000 to R7000 consume above the recommended intake per
4 (80.0) 1 (20.0) 5
Cumulative 81.4 100
Total
38.0 3 (75.0) 1 (25) 4
43.0 0 1 (100) 1
31 (81.6) 7 (18.4) 38
1 (50.0) 1 (50.0) 2
0 2 (100) 2
26 (81.3) 6 (18.7) 32
day as observed among the respondents from Rhodes University (Table 5). Similarly, as the monthly allowance increases, male students in both Universities tend to consume above the recommended meat intake (Figure 1a, b and c; Figure 2a, b, c and d). The coefficients and the marginal effect of the variables influencing meat consumption pattern in both Universities are presented in Table 6. Age of the student was significant (p ˂ 0.05) and have positive effect (X1, +0.0506) on meat consumption per day. Hence, the probability of consuming the required quantity of meat per day increases with the age of the students in both Universities. The current study revealed that the weight gained by sampled students in both Universities is negatively related to meat consumption. The coefficient (X3, 0.0132) which is not significant is in line with literature and past works. It also shows that there is the probability that the students have some enlightenment about weight gain and meat consumption with its resultant chronic conditions. From the study, we can infer that the
Hosu et al.
(a)
(b)
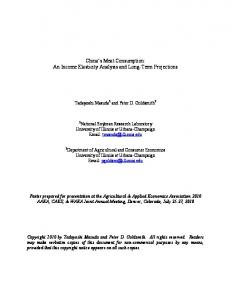
(c) Figure 1. University of Fort Hare students’ having (a) R1000 (b) R3000 (c) R5000 monthly allowance and their daily meat intake.
2647
2648
Afr. J. Agric. Res.
(a)
(b)
(c)
(d)
Figure 2. Rhodes University students’ having (a) R1000 (b) R3000 (c) R5000 (d) R7000 monthly allowance and their daily meat intake.
Hosu et al.
2649
Table 6. Determinants of required meat consumption at the University of Fort Hare and Rhodes University.
Recommended Meat intake per day Age Gender Weight Monthly allowance Amount spent on food Eating habits Fish consumption Vegetable consumption Location Constant 2
Coefficient 0.0506 -0.4232 -0.0133 0.0002 -0.0004 0.8717925 -3.306786 -86.40988 0.6587101 -0.0432056
Standard Error 0.0219 0.3086 0.0088 0.0001 0.0003 0.5778 1.9551 18.8206 0.3195 0.8354
Z
P>|Z|
∂F/∂x
x-bar
2.30 -1.37 -1.50 1.75 -1.77 1.51 -1.69 -4.59 2.06 -0.05
0.021** 0.170 0.135 0.080* 0.077* 0.131 0.091* 0.000*** 0.039** 0.959
0.0107293 -0.086273 -0.002818 0.0000499 -0.000104 0.1848379 -0.701107 -18.3207 0.1396601 -0.009161
25.8867 0.413333 58.5867 2293.33 1061.33 0.333333 0.058655 0.02204 0.533333 1
[95% Conf. Interval] 0.0075 -1.0281 -0.0307 -0.0000 -0.0010 -0.2608 -7.1388 -123.297 0.0324 -1.6805
0.0936772 0.1816097 0.0041306 0.0004994 0.0000539 2.004419 0.5252446 -49.52207 1.285011 1.594163
2
n=150, LR χ (9) 64.07(0.0000). Log likelihood= -52.860879 Pseudo R =37.73. ***,**,* Significant at 1, 5 and 10%; n= number of observations.
probability of consuming the required meat intake by the students declines as their weight increases. Development of a ‘meat less’ orientation especially among the young females women have been reported in the United Kingdom and Australia because of fat in meat (Kubberud et al., 2001). Compared to the more restricted females, the males in our study seemed to have a more pragmatic view on their own diet and displayed no such disgust with or concern for fat in meat. Our findings here is therefore consistent with Guzman et al. (2000) where females associated health, beauty and attractiveness with low meat-intake, good looks, slim bodies and good body image (Vandendriessche et al., 2005; Wang et al., 2009). The belief in thin, or slim bodies regarded as “diaphanous body image” could be deduced in our study to be upheld by the female respondents in both Universities (Adams and Rini, 2007; Wang et al., 2009). Students’ monthly allowance (X4) has a positive relationship (p ˂ 0.10) on attainment of the required meat intake per day. Although X4 is small in magnitude (+0.00023) is very small there is the probability of eating required meat per day as the allowances of student’s increases. The amount spent on feeding was negatively related (X5= -0.0004911) to the recommended meat intake and thus, many students prefer to spend money on other food items or close substitutes rather than meat. Probit analysis showed that the fish consumption among the students in both Universities is significant (p ˂ 0.10) but inversely related (coefficient = -3.306786) to the recommended daily meat intake. Even though the consumption of fish was the highest, a unit change (positive) in per capita meat consumption by the respondents resulted in 70% reduction in the consumption of both fish and vegetable. Table 6 also shows a positive relationship between eating habits of the students (X6=0.8717) and the daily recommended meat intake. The study found that the probability of consuming the required meat per day being high when they prepare their meals through self-catering. The regression reveals
that the probability of consuming the required meat per day was greatly influenced by students who prepare their own meals. The result in this context might be influenced by preference for close substitute and also, what the consumers consider appropriate (Sosa et al., 2005). Other factor like gender is inversely related to required meat consumption, although it is not significant. Regression analysis shows that the probability of male students consuming the required meat intake is higher than their female counterpart in both Universities. Table 6 also shows marginal effect of the independent variables on per capita meat intake among University students in Eastern Cape Province of South Africa. However, our study reveals that 5% change in the age of the students will cause a unit change in per capita meat consumption of the students. Conclusion The feeding habits and consumption patterns among the respondents in this study were greatly influenced by their monthly income, gender class and personal ethics in this study. Students from black dominated University showed more inclinations towards self-catering but those from the white dominated University, had higher preference for fast food due to availability of more disposable income. Conflict of Interest The authors have not declared any conflict of interest. ACKNOWLEDGEMENT The Govan Mbeki Research and Development Centre (GMRDC) is specially acknowledged for providing financial support to publish this manuscript.
2650
Afr. J. Agric. Res.
REFERENCES Abela AV (2006). Marketing and consumerism. Euro. J. Market. 40(1/2):5-16. Adams T, Rini A (2007). Predicting 1-year change in body mass index among college students. J. Am. Coll. Health 55:361-365. Barquera S, Rivera JA, Safdie M, Flores M, Campos-Nonato I, Campirano F (2003). Energy and nutrient intake in preschool and school age Mexican children: National Nutrition Survey 1999. Salud Publica Mex. 45(4):540-550. Bezerra IN, Goldman J, Rhodes DG, Hoy MK, Souza ADM, Chester DN, Martin CL, Sebastian RS, Ahuja JK, Sichieri R, Moshfegh AJ (2014). Difference in adult food group intake by sex and age groups comparing Brazil and United States nationwide surveys. Nutr. J. 13(74):1-10. Blunt A, Dowling R (2006). Home. London: Routledge. Borgmann A (2000), The Moral Complexion of Consumption, J. Consum Res. 26:418-22. Csikszentmihalyi M (2000). Reflections and reviews: The cost and benefits of consuming. J. Consum. Res. 27(2):267–272. Fayemi PO, Muchenje V (2012). Meat in African context: From history to science. Afri. J. Biotech. 11(6):1298-1306. Fayemi PO, Onwuka CFI, Isah OA, Jegede AV, Arigbede OM Muchenje V (2011). Effects of mimosine and tannin toxicity on rabbits fed processed Leucaena leucocephala (Lam) De Wit. Leaves. Afr. J. Agric. Res. 6(17):4081-4085. Gregory NG (1997). Meat, meat eating and vegetarianism. A review of rd the facts. In J. Bass(Ed.), Proceedings of the 43 Int. Congress Meat Sci. Tech. Auckland, New Zealand, pp. 68-85. Grumert KG, Perrea T, Zhou Y, Huang G, Serensen BT (2011). Is foodrelated lifestyle (FRL) able to reveal food consumption patterns in non-Western cultural environments? Its adaptation and application in urban China. Appet. 56:57-67. Guzman EC, Hirata MH, Quintão EC, Hirata RD (2000). Association of the apolipoprotein B gene polymorphisms with cholesterol levels and response to fluvastatin in Brazilian individuals with high risk for coronary heart disease. Clin. Chem. Lab. Med. 38(8):731-736. Hall SM (2011). Exploring the ‘ethical everyday’: An ethnography of the ethics of family consumption. Geoforum 42:627-637. Holsten JE, Deatrick JA, Kumayika S, Pinto-Martin J (2012). Children’s food choice process in the home environment. A qualitative descriptive study. Appet. 58:64-73. Hume M (2010). Compassion without action: Examining the young consumers consumption and attitude to sustainable consumption. J. World Bus. 45:385-394. Jensen JD, Smed S (2007). Cost-effective design of economic instruments in nutrition policy. Int. J. Behav. Nutr. Phys. Act. 4:1-12. Kant AK (2003). Reported consumption of low-nutrient density foods by American children and adolescents. Nutritional and health correlates, NHANES III, 1988 to 1994. Arch. Paed. Adol. Med. 57:789-796. Kubberud E, Òydis U, Ðsne T, Einar R (2001). Attitudes towards meat and meat-eating among adolescents in Norway: a qualitative study. Appet. 38:53-62. Lokuruka MNI (2006). Meat is the Meal and Status is by Meat: Recognition of Rank, Wealth, and Respect through Meat in Turkana Culture. Food Floodways 14:201-229. McArthur LH, Donald H, William DH, Forsythe A (2006). Compliance with Food Safety Recommendations among University Undergraduates: Application of the Health Belief Model. Fam. Cons. Sci. Res. J. 35:160-170. Miller RK (2001). Beef Flavor: A White Paper. A paper prepared for the National Cattlemen’s Beef Association, Centennial, CO. Morrison KT, Trisalyn AN, Aleck SO (2011). Mapping spatial variation in food consumption. Appld. Geo. 31:1262-1267. NSFAS (National Student Financial Aid Scheme (2009). Higher Education of South Africa. Available on: www.http//:hesa.org.za. Accessed on 21 March, 2012.
Papadaki A, Hondros G, Scott JA, Kapsokefalou M (2007). Eating habits of university students living at, or away from home in Greece. Appet. 49:169-76. Rhonda S,Lori A, Jay G, Donna C (2009). Family Planning Saves Lives, 4th ed. Ruby MB (2012). Vegetarianism. A blossoming field of study. Appet. 58:141-150. Russell CG, Cox DN (2004). Understanding middle-aged consumers’ perceptions of meat using repertory grid methodology. Food Qual. Pref. 15:317-329. Sánchez C, López-Jurado M, Aranda P. Llopis J (2010). Plasma levels of copper, manganese and selenium in an adult population in southern Spain: Influence of age, obesity and lifestyle factors. Sci. Total Environ. 408:1014-1020. Schroeter C, House L, Lorence A (2007). Fruit and Vegetable Consumption among College Students in Arkansas and Florida: Food Culture vs. Health Knowledge. Int. Food Agribus. Mgt. Rev. 10(3):277-288. Smith CO (2000). Feed intake, growth and body composition changes in Spanish and Tennessee Stiff-legged goats. MS thesis. Prairie View A&M University. Prairie View, Texas, USA. Sosa M, Marti C, Arruiz F, Hough G, Mucci A (2005). Degree of appropriateness and frequency of consumption of mayonnaise, ketchup, mustard and similar sauces in Argetina. Food Qual. Pref. 16:667-674. Susanna K, Warren TKL, Georgia SG, Una C, Mable C, Wendy H, Selina K, Kim YT (1995). Dietary intake, food habits and nutrition knowledge of adults a telephone survey in Hong Kong (1990-91). Nutr. Res. 15(5):633-445. Temple NJ, Nelia P, Steyn NP, Neil G, Myburgh NG, Johanna H, Nel JH (2006). Food items consumed by students attending schools in different socioeconomic areas in Cape Town, South Africa. Nutr. 22:252-258. Vandendriessche F (2008). Meat products in the past, today and in the future. Meat Sci. 78:104-113. Wang WC, Worsley A, Cunningham EG (2009). Social ideological influences on food consumption, physical activity and BMI. Appet. 53:288-296.