Journal of Coastal Conservation 8: 49-54, 2002 © EUCC; Opulus Press Uppsala.
- Determination and prediction of sediment yields from recession of the Holderness Coast -
49
Determination and prediction of sediment yields from recession of the Holderness Coast, NE England Newsham, R.1*; Balson, P.S.2; Tragheim, D.G.1 & Denniss, A.M.3 1Information
Services, British Geological Survey, Keyworth, Nottingham, NG12 5GG, UK; 2Geophysics & Marine Geoscience, British Geological Survey, Keyworth, Nottingham, NG12 5GG, UK; 3Geospatial Information Systems, British Geological Survey, Keyworth, Nottingham, NG12 5GG, UK; *Corresponding author; E-mail
[email protected]
Abstract. The rapidly eroding cliffs and foreshore of the Holderness Coast represent one of the largest sources of sediment discharging in the southern North Sea. For effective coastal management it is important to understand the sediment sources, transport pathways and depositional sinks. The sediment budget is regarded as one of the key information needs for sustainable planning and management. In order to quantify the sediment yield from recession of the Holderness Coast, digital photogrammetry has been used, together with nearshore bathymetric survey data, to produce a single DTM for a length of over 52 km of coastline. Other data including geological sections, sediment lithology, recession rates and the location of coastal defences have been added to the DTM to create a GIS for the Holderness Coast. The GIS has been used to predict the volume and nature of the sediment yield assuming that historical recession rates continue. The GIS can also be used to predict future yields using assumptions of accelerated recession or the implications of arrested retreat due to construction of defences.
Keywords: Bathymetry; Aerial photography; Digital Terrain Model; Erosion; Humber; Sedimentation. Abbreviations: DTM = Digital Terrain Model; GPS = Global Positioning System; JPEG = Joint photographic expert group; NERC = Natural Environment Research Council; RMSE = Root mean square error.
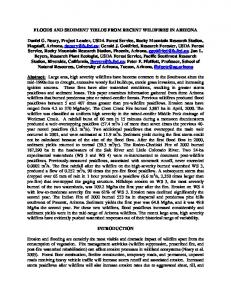
Introduction The Holderness Coast stretches for over 50 km from the Chalk promontory of Flamborough Head in the north to the shingle spit of Spurn Head at the mouth of the Humber Estuary in the south (Fig. 1). The coastline consists dominantly of cliffs up to 38 m high in unlithified glacial tills and other glacigenic sediments. The coast is largely undefended except at the seaside towns of Bridlington, Hornsea and Withernsea. Coastal erosion of the undefended stretches results in cliff recession rates up to around an average of 2 m.yr–1 which makes the Holderness coastline one of the most rapidly eroding in the UK. The rapid recession releases large quantities of sediment onto the beach and into the nearshore zone. This sediment consists of a very heterogeneous mixture of particle sizes ranging from boulders to clay. The sands and gravels contribute to the maintenance of the Holderness beaches and the Spurn Head peninsula. Silts and clays, which dominate the sediment yield, are transported in suspension in the near-shore waters. This suspended sediment may have final ‘sinks’ including the mud flats and salt marshes of the Humber Estuary and The Wash and other depocentres elsewhere in the southern North Sea. In the past, public concerns have focused on the loss of farmland and cliff-top property caused by retreat of the cliffs that have led to calls for construction of coastal defences. Construction of ‘hard’ engineered defences will inevitably lead to a reduction in sediment yield from coastal recession, with consequent, but largely unknown, impacts elsewhere. Although there are many published estimates of sediment yield for the Holderness coast (e.g. Redman 1869; Pickwell 1878; Dossor 1955; Valentin 1971) these are based on coastal length and assumptions of average cliff height, cliff recession rate and cliff composition. Consequently estimates have varied by up to an order of magnitude. This paper describes work currently in progress to improve on the quantification of sediment yield by using digital photogrammetry and GIS data analysis
50
Newsham, R. et al. 3D DTM – from aerial photography
Fig. 1. Map of Holderness Coast showing its regional setting.
techniques. The establishment of a sediment budget is regarded as one of the key information needs for sustainable planning and management (Anon. 1995). The work was carried out at the British Geological Survey (BGS) as part of the NERC Land-Ocean Interaction Study (LOIS).
The Holderness GIS The method used in the study involved the creation of a DTM (Digital Terrain Model) using digital photogrammetry derived from scanned vertical aerial photographs and combined with other data sets in a GIS environment. The project was carried out using a suite of Intergraph software packages. The initial photogrammetry was undertaken using Intergraph ImageStation. The DTM derived from the photogrammetry was transferred to a Windows NT work station and manipulated using Intergraph Terrain Modeler. Terrain Modeler is a specialized package developed for analysis, manipulation, modification and graphical display of elevation modelling data and is built on Microstation, which is a computer-aided drawing package. The data sets will now be summarized.
Colour aerial photography at 1 : 6000 scale was acquired by the NERC aircraft during low-tide conditions (around 10:15 am) on 14 April 1995 along the Holderness coastline. At this scale, the photographs generally covered 75% land, 5 - 10% beach and the remainder sea. In order to use the photographs photogrammetrically, a GPS (Global Positioning System) ground control survey was commissioned to provide 80 points for 40 photographs. These were generally chosen to occur within the triple overlap areas of adjoining stereomodels. The accuracy specified for the GPS ground control was better than ± 0.1 m in Easting, Northing and Height. The actual mean transformed coordinates of the 11 stations produced root mean square error (RMSE) values of E = 0.033 m, N = 0.020 m and H = 0.004 m. Colour diapositives were made from the negatives and scanned at a resolution of 20 microns to produce three-band, red-green-blue digital images, each measuring 432 Mb in size. The images were subsequently compressed using the JPEG ?? method and six overviews added to each, resulting in a final colour image size of about 132 Mb. The photogrammetry was undertaken using an Intergraph ImageStation, a dual-function image analysis and digital photogrammetric work station. It is estimated that individual DTM points may have an RMSE height accuracy better than ± 0.20 m. A groundtruth survey using a Nikon Total Station is currently being undertaken and should provide more quantitative information about co-ordinate accuracy. Lines representing the cliff-top and bottom were digitized manually into the file from the image. These features are placed into a Microstation file. The x, y, z position of the features are loaded into Terrain Analyst to create a digital terrain model of the area. As each different feature is loaded into Terrain Analyst it is assigned an attribute relating to the type of feature it is. For example, the lines representing the cliff top and base are loaded as a breakline; this prevents the model from rounding off the cliff top and base. Further details of the photogrammetric techniques used can be found in Balson et al. (1996). 3D DTM - from bathymetry Water depth data was used to construct a DTM for the near-shore area. Data were captured for an area of sea floor out to ca. 2.5 km from the low water mark where a prominent break in slope is assumed to represent the depth beyond which shoreface erosion becomes insignificant. Spot heights were loaded into Microstation and the elevations were corrected to Ordnance Datum to
- Determination and prediction of sediment yields from recession of the Holderness Coast -
51
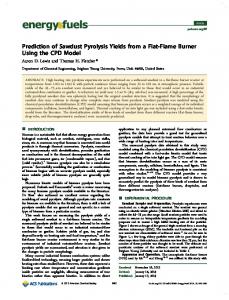
Fig. 2. Shaded perspective view of a DTM for a section of the coast near Easington.
enable the final model to be merged with the onshore DTM to create a single DTM of the eroding cliffs and shoreface (Fig. 2). Cliff geology Horizontal sections which show the lateral and vertical distribution of the geological formations exposed in the Holderness cliffs were drawn by Bisat (Catt & Madgett 1981). The original hand-drawn sections, housed in the archives at BGS, were digitized using Microstation. The section was rescaled in segments, between points with known Eastings and Northings, to reduce the effect of horizontal scale errors in the original drafting. Each geological formation was captured as an individual polygon. The vertical axis was converted to heights relative to Ordnance Datum. The digitized section had a vertical exaggeration of ¥ 10, to assist in the visualization of the polygons. Each polygon was marked with a code to identify the specific geological formation. Bisat’s sections show the formations exposed only above beach level. For the area below beach level and on the shoreface the geology must be assumed. For simplicity it has been assumed that only Basement Till is exposed below beach level. In the future it is hoped that further study will improve knowledge of the distribution of Quaternary formations of the Holderness Coast. To assess the accuracy of the cliff-top topography in the original horizontal section produced by Bisat, a line was placed in Microstation to follow the current clifftop on the DTM. Terrain Modeler created a profile
across the model and placed it graphically into the Microstation file. The original profile was then overlain and registered using known points on each profile. Slight discrepancies between the original profile and the profile generated from the DTM are probably due to the difference in the age of the two profiles. In some areas the height of the cliff has reduced as the cliff has eroded back.
Geological boundaries Boundaries between the geological formations on the land area in plan view were digitized from BGS 1:10 000 geological maps using Microstation. These lines can be draped onto the DTM in Terrain Analyst. Erosion rates Valentin (1954, 1971) determined the amount of cliff top recession along the Holderness Coast by comparison of distances from fixed points depicted on 1:10 560 Ordnance Survey maps published in 1852 and field measurements made in 1952. His measurements were spaced at ca. 200-m intervals along the entire coast. The measurements thus represent average rates of recession averaged over a 100-yr time period. Recession since 1952 may have exceeded 50 m at some locations. The grid reference of each measurement given by Valentin represents the intercept between the clifftop of 1952 and a line at right angles to it. Each measure-
52
Newsham, R. et al.
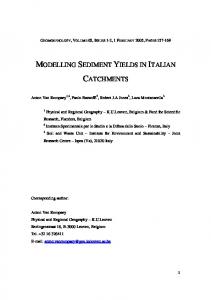
Fig. 3. Horizontal section through the original DTM. The change after lateral migration is indicated by the cross-hatched area, which represents the volume of sediment yielded.
ment was considered to represent a value for an orthogonal line from the modern coastline through the grid references given by Valentin. Additional orthogonal lines were constructed within Microstation at 10-m intervals along the cliff section. These can be assigned values which are intermediate and in approximate ratio to the values entered from Valentin’s data on either side. By using the values at this closer spacing, and assuming that the average rate remained constant with time, a new cliff top after a given number of years of recession can be predicted. Lithological data Lithological data for each geological formation have been taken from published data (e.g. Madgett & Catt 1978) and from field observations. For this study each of the identified geological formations was given a single average composition. In the future it is hoped one will be able to take account of the lateral variability of
the lithological composition within individual formations by laterally subdividing formations and assigning different values. Sea defences The location of existing sea defences, such as the sea walls, which prevent cliff erosion at the towns of Withernsea, Hornsea and Bridlington, were digitized in Microstation.
Calculation of sediment yield To determine the total volume of sediment potentially yielded by recession of the coast, the DTM was migrated horizontally landwards by a given amount and the volume between the DTM and the migrated DTM calculated. The amount of migration can be, for instance, 1 m, 10 m or a distance equivalent to 10 yr at the
Fig. 4. Horizontal geological section used to calculate the sediment yield by lithology.
- Determination and prediction of sediment yields from recession of the Holderness Coast present long-term average rate. Similarly an assumed accelerated or decelerated rate can be used in order to assess the implications of future change. Erosion yields can also be hindcast but it is necessary then to assume that the present cliff-top elevation profile is representative of the past profile. The length of coastline can be divided into sections with different migration values if necessary. After migrating all the features in the Microstation file landward by a given amount at right angles to the cliff top a second DTM was generated. For the migrated DTM a polygon was placed in the Microstation file along the cliff-top and around the model to seaward to exclude the land area from the volume calculation. Areas protected by sea defences are removed from the calculation at this stage. This is achieved by placing two polygons in the Microstation file each side of the sea defences. Shoreface yield can be taken into account by joining the polygons at the base of the sea defences. Terrain Analyst calculated the difference between the two DTMs within the polygon. An ASCII report file was generated which contains the value for the volume between the two DTMs (Fig. 3). The ASCII file contains two sets of values, the first being the volume of the model where the migrated surface is below the original surface. This value represents the amount of sediment potentially released by erosion for the selected distance. The second value is the volume of the model where the migrated surface is above the original surface. This second value can be ignored, as there would not have been sediment present in these areas and therefore would not affect the yield. Thickness maps can also be generated during the volume calculation. This enables visualization of the distribution and intensity of the erosion along the eroding shoreface.
53
‘cells’ bounded by the locations of the recession rate values given by Valentin (1954, 1971) (Fig. 4). The areas of each formation polygon in m2 were multiplied by the recession rates to obtain the volume contribution in m3 for each formation. These values were multiplied by the values for the average composition and summed to give the total yield of gravel, sand and mud for any given stretch of coastline. Further values can be calculated using different scenarios of future cliff recession rates and using the original DTM to ascertain the new height of the cliff after a specified period of recession.
Conclusion Although the calculations of sediment yield by lithology can be calculated indirectly, it is hoped that in the near future the volume by lithology will be calculated directly from the model and that the boundaries between each lithological unit (digitized from the cliff section) will be directly loaded into the model as surfaces. The GIS created for the Holderness Coast, based on Intergraph software and hardware, is able to use 3D DTMs derived from digital photogrammetry and bathymetric surveys to calculate the volume of sediments which would be yielded by incremental landward recession. Data on the thickness and distribution of geological formations are included which can be used to calculate the contributions made by mud-, sand-, and gravel-sized fractions to the total volume. The amount of recession can be varied to determine yields for any predicted rate of retreat. This enables the impact of future changes in recession rate to be assessed. Different rates can be used for different stretches of coast to take into account lateral variations, as for instance may occur after the construction of coastal defences.
Calculation of sediment yields by lithology The subsequent behaviour of the sediments after erosion from the cliff and shoreface is to a large part dependent on its mineralogy and grain size. Sand and gravel contribute to the beach and are moved southward by long-shore drift. Mud is transported southwards mainly in suspension in the near-shore waters. It is necessary to determine the relative contribution of different size categories from the eroding shoreline in order to properly assess the impacts of any future changes in the sediment budget. The horizontal geological sections have been used to determine these contributions. For this study it has been assumed that each formation is vertically and laterally consistent enough that a single average composition can be assigned to each. The section has been divided into
Acknowledgements. This contribution is published with the permission of the Director, British Geological Survey (NERC). This is LOIS Publication No. 411 of the LOIS Community Research Programme of the Natural Environment Research Council.
54
Newsham, R. et al.
References Anon. (Department of the Environment) 1995. The Investigation and Management of Erosion, Deposition and Flooding in Great Britain. HMSO, London, UK. Balson, P.S., Tragheim, D.G., Newsham, R. & Denniss, A.M. 1997. Predicting sediment yield from the recession of the Holderness coast, UK. Coastal Zone 97. Abstracts of Presentations, Volume II session F through I, pp. 635-637. Catt, J.A. & Madgett, P.A. 1981. The work of W.S. Bisat, F.R.S. on the Yorkshire Coast. In: Neale, J. & Flenley, J. (eds.) The Quaternary of Britain, pp. 119-136. Pergamon Press, Oxford, UK. Dossor, J. 1955. The coast of Holderness: the problem of erosion. Proc. Yorkshire Geol. Soc. 30: 133-145.
Madgett, P.A. & Catt, J.A. 1978. Petrography, stratigraphy and weathering of Late Pleistocene tills in East Yorkshire, Lincolnshire and North Norfolk. Proc. Yorkshire Geol. Soc. 42: 55-108. Pickwell, R. 1878. The encroachments of the sea from Spurn Point to Flamborough Head, and the works executed to prevent the loss of land. Minut. Proc. Inst. Civil Engin. 51: 191-212. Redman, J.B. 1869. On the outfall of the River Humber. Discussion of a paper by W. Shelford, pp. 493-497 in Minut. Proc. Inst. Civil Engin. 28: 472-516. Valentin, H. 1954. Der Landverlust in Holderness, Ostengland, von 1852 bis 1952. Die Erde 6: 296-315. Valentin, H. 1971. Land loss at Holderness. In: Steers, J.A. (ed.) Applied coastal geomorphology, pp. 116-137. Macmillan, London, UK.