Research Article Page 1 of 10
AUTHOR:
Andrew Gallagher1
AFFILIATION:
Centre for Anthropological Research, University of Johannesburg, Johannesburg, South Africa 1
CORRESPONDENCE TO: Andrew Gallagher
EMAIL:
[email protected]
Determination of a novel size proxy
Determination of a novel size proxy in comparative morphometrics Absolute size is a critical determinant of organismal biology, yet there exists no real consensus as to what particular metric of ‘size’ is empirically valid in assessments of extinct mammalian taxa. The methodological approach of JE Mosimann has found extensive favour in ‘size correction’ in comparative morphometrics, but not ‘size prediction’ in palaeontology and palaeobiology. Analyses of five distinct mammalian data sets confirm that a novel size variate (GMSize) derived from k=8 dimensions of the postcranial skeleton effectively satisfies all expectations of the Jolicoeur–Mosimann theorem of univariate and multivariate size. On the basis of strong parametric correlations between the k=8 variates and between scores derived from the first principal component and geometric mean size (GMSize) in all series, this novel size variable has considerable utility in comparative vertebrate morphometrics and palaeobiology as an appropriate descriptor of individual size in extant and extinct taxa.
POSTAL ADDRESS:
Centre for Anthropological Research, Department of Anthropology and Development Studies, University of Johannesburg, Auckland Park, 2006, Johannesburg
DATES:
Received: 02 July 2014 Revised: 30 Oct. 2014 Accepted: 04 Jan. 2015
KEYWORDS:
mammals; size; multivariate scaling; mammalian palaeobiology; vertebrates
HOW TO CITE:
Gallagher A. Determination of a novel size proxy in comparative morphometrics. S Afr J Sci. 2015;111(9/10), Art. 2014-0221, 10 pages. http://dx.doi.org/10.17159/ sajs.2015/20140221
Introduction Absolute size of an organism, typically encapsulated by its body mass or length, is perhaps the most significant variable in comparative biology.1-4 Body size is intimately intertwined with organismal physiology, ecology, reproductive and, ultimately, evolutionary success.3-6 Cope’s ‘rule’ of phyletic size increase is a pervasive phenomenon in the vertebrate fossil record,7-12 and remains a valid prospectus irrespective of any determinant probability governing directional size increases from a lineal founder of comparably diminutive size relative to its terminal members.7,13At the population level, there is perhaps no greater testimony to the significance of individual size than the fact that ‘length-to-mass’ is a critical metric of the intrinsic health of an individual, from ontogeny through to adulthood.14-18 In cases where absolute length or mass of an individual organism cannot be reliably determined, as is generally the default in comparative morphometric analyses of specific skeletal elements and in vertebrate palaeontology, a justified linear proxy for body size is required. The pitfalls of directional covariance between k=2 or k=>2 metrics of a skeletal or dental element in interspecific ‘mouse-to-elephant’ allometric models has been emphasised,19-21 and RJ Smith’s analysis of dental size and body mass covariance in primates is a constructive exemplar,19 yet interspecific approaches to individual body mass estimation remains a cornerstone of mammalian palaeontology and palaeobiological inference.22-27 As a basic objective, we desire a reliable size proxy for either a single case (an individual fossil) or a series of individuals sampling an unknown or indeterminate underlying size distribution. Taxonomically diagnostic dental elements comprise about 90% of the mammalian fossil record and correlate strongly with body mass in broad interspecific contexts, particularly at the class and order levels,22,23,28-30 yet yield surprisingly poor estimates compared with weight-bearing skeletal elements in narrower taxonomic comparative analyses.9,31-33 An alternative approach to mass estimation involves explicit sampling across the skeleton and the application of multiple-dependent least-squares regression procedures (ordinary least squares) or generalised least squares algorithms (ANCOVA) to assess efficacy of a suite of potential variate predictors of vertebrate size.34-37 While these methods offer considerable improvement over traditional bivariate Model I and Model II regression techniques, their utility is dependent upon access to reasonably complete and associated comparative series in museum repositories and, in the case of interspecific models, effective taxon-specific samples may be little improved over traditional bivariate approaches. There is general acceptance of the size-adjustment approach advocated by JE Mosimann in comparative morphometrics,38,39 yet there has been hitherto little recognition of the potential primacy of the favoured size variate, the geometric mean (GM), in estimation of ‘size’. Following the work of PF Jolicoeur,40,41 any preferred construct of individual size from a suite of k linear correlates is testable via decomposition of their variance-covariance matrix (VCV) via principal components analysis. Following Jolicoeur’s rationale,38,40,41 if the first principal component (PC) of a VCV matrix of log-transformed k variates accounts for a majority of the total explained variance (>75%), and all k variate loadings on this vector are approximate, then PC1 represents a generalised multivariate size vector and individual variates may be expressed as simple functions of geometric similarity as follows: X1, …Xk = (1/k) 1/2 (1, …., 1)
Equation 1
From this, our k linear variates are simply re-scaled as components of isometry with the values β=< 1, β=1, β=> 1 indicating negative allometry, isometry and positive allometry, respectively.38,41 If this criterion is satisfied, derivation of the arithmetic mean (average) of a suite of log-transformed k linear variates for a single individual is the most appropriate metric of its intrinsic size, equivalent to centroid size of a triangle in Euclidean geometry.42-44
© 2015. The Author(s). Published under a Creative Commons Attribution Licence.
South African Journal of Science
http://www.sajs.co.za
In geometric morphometric approaches, the natural intrinsic measure of size derived from any constellation of p landmark coordinates in k-dimensional space (k=2/k=3) is centroid size, which is simply the sum of all possible squared inter-landmark distances on a single specimen or series of n specimens.42-44 However, one critical problem with this size metric is that it is entirely dependent upon the number of p landmark points registered on a specimen (or series of specimens) and can differ radically in any given random sequence of restricted landmark points,
1
Volume 111 | Number 9/10 September/October 2015
Research Article Page 2 of 10
Determination of a novel size proxy
of eight distinct linear dimensions were derived from the proximal and distal epiphyses of the four major long bones in associated individual skeletons. Given that all major weight-bearing epiphyses are sampled, it follows logically that the cumulative proxy of this series, the geometric mean (GMSize), is both intrinsic to an individual and is a faithful approximation of its locus within any hypothetical Guassian normal distribution,38,40,41,45,46 intraspecifically and at the familial and higher orders of the Linnaean hierarchy. Given a general acceptance of the primacy of postcranial linear variates in the estimation of body mass in extinct mammalian taxa, particularly dimensions of the epiphyses, the GM of k=8 linear dimensions of the postcranial epiphyses in associated individual skeletons offers a prospectus for exposition of a generalised size variate in vertebrate morphometrics.45,46
as in analyses of specific morphological regions of interest.42-44 The comparative and evolutionary significance of centroid size is further complicated in analyses where Type I (homologous) registration points do not form an overwhelming majority of the registered constellation of p x k landmarks and where these may be heavily biased towards Type II and even Type III landmarks.42-44 In extreme cases of the latter, centroid size retains its function as an intrinsic baseline to which all p inter-landmark distances are effectively rescaled, which is the goal in statistical shape analysis.42-44 Nevertheless, as a comparative size variate, any derivation from the k x p landmark distance space is an inherent intrinsic function of the specific skeletal element under consideration, and cannot be reified as a faithful proxy of size in broader comparative appraisals. From a theoretical perspective, the only available test for allometry in geometric morphometric applications is a simple test of correlation between the first PC on the VCV of the tangent space coordinates,42-44 in a direct assessment of correlation of size and shape. Assessments of size correspondences across even anatomically proximate structures using centroid size are simply not possible.
Materials and methods The preferred k=8 linear variates of the associated fore- and hindlimb skeletons were taken on a comparative series of extant mammals sampling 247 African hominids (Gorilla and Pan), 149 Old World monkeys (Colobus, Cercopithecus and Papio) and 62 large-bodied felids (Panthera and Acinonyx) housed in collections in Africa, Europe and the USA (Supplementary table 2). All data were transformed to natural logarithms (ln), including the GM of the raw series, and parametric correlation matrices (Pearson’s r) were calculated for these discreet interspecific series. The covariance matrices (VCV) for each of these series were subjected to a principal components analysis and the Eigenvectors, component loadings and PC scores were calculated using PAST version 3.1.47 In order to assess the efficacy of the proposed size variate at the intraspecific level, pooled-sex series sampling Pan t. troglodytes (n=91) and Gorilla g. gorilla (n=102) were assessed. While closely related, these taxa evidence considerable differences in sexual size dimorphism and are sufficiently large to warrant consideration as viable statistical populations.
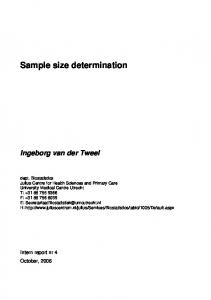
In contrast, derivation of the geometric mean of a series of k linear dimensions taken on a single element, or across multiple associated elements of the same specimen, offers significant promise as a generalised comparative size variate in normal metric scales of the SI (μm, mm). The geometric mean is simply the nth root of the sum of their products (where n=k)45, and the distribution of this size metric in a population of individuals has been demonstrated to conform to expectations of the univariate log-normal and gamma distributions. More critically, the geometric mean of a series of k variates is strongly and positively correlated with the PC1 scores derived from a principal components analysis of the VCV of this series.38,41 A table of parametric correlation coefficients (Pearson’s r) is an effective assessment of covariance in a series of k variates prior to calculation of the GM. In the event that body length and body mass are unknown, in an individual or a series, an alternative ‘proxy’ should fulfil the basic prospectus of correspondence with intrinsic organismal size. Weightbearing epiphyses of the fore- and hindlimb skeleton of living mammals are obvious contenders as individual predictors of body mass in intraspecific and interspecific contexts.31-34 Nevertheless, such analyses ignore discreet allometric trajectories observed within families, and even between closely related species. The approach favoured here is a global skeletal perspective (Figure 1; Supplementary table 1 online), and follows the size proxy outlined by Reno and colleagues.46 A series
Results Correlation coefficients for the k=8 fore- and hindlimb dimensions are highly significant across all five data sets and exceed r=0.92 in all cases, with the notable exception of Pn. t. troglodytes (Supplementary tables 3–7). The poorer correlation coefficients between the linear variate series in common chimpanzees reflects the well-known phenomenon that centring any bivariate distribution (x,y) in a linear regression yields a higher slope in cases in which effective size ranges of x and y are proportionally large, as in interspecific ‘mouse-to-elephant’ analyses.19
HPAW, mediolateral diameter of the articular surface of the humeral head DHAW, mediolateral diameter of the anterior surface of the distal humeral articular surface (trochlea + capitulum) RHD, maximum diameter of the radial head HPAW
HDAW
RHD
DRB
DRB, maximum mediolateral diameter of the distal radial articulation FHD AP, femoral head diameter (anteroposterior) FBB, maximum mediolateral diameter of the distal femur PTB, maximum mediolateral diameter of the tibial articular plateau DTP, the square root of the product of the maximal mediolateral diameter (including the medial malleolus) and the maximum anteroposterior diameter of the distal tibia
FHD AP
Figure 1:
FBB
PTB
DTP = √DT ML*DT AP
Linear variates taken on associated fore- and hindlimb epiphyses used in the derivation of the size metric (GMSize).
South African Journal of Science
http://www.sajs.co.za
2
Volume 111 | Number 9/10 September/October 2015
Research Article Page 3 of 10
Determination of a novel size proxy
In contrast with Pn. t. troglodytes, the considerable linear size range across the variate series observed in G. g. gorilla yields coefficients only marginally lower than in the familial Old World monkey and felid data sets (Supplementary tables 3–7). The general consistencies in size correspondences across the k=8 fore- and hindlimb joint dimensions in the five data sets is equally supported by the actual proportion of the total variance explained by the first PC across the series (Table 1). Analyses of the pooled-sample African hominids, Old World monkeys, large-bodied felids and G. g. gorilla yield a first PC accounting for a staggering 96–98% of the total variance, which is clear confirmation of a dominance of linear size on these axes for these respective series. In contrast, the first PC of the Pn. t. troglodytes data set accounts for a considerably depressed percentage of the total variance (76.5%), particularly striking in comparison with G. g. gorilla, and is consistent with a scalar decrease in absolute ranges of the k=8 variate distributions in this comparably monomorphic taxon. This observed pattern is robust irrespective of whether raw linear data are used in lieu of the logtransformed data (Table 1; Supplementary tables 3–7). Table 1:
indicated by their pooled-sample multivariate distribution. The proximal femur is actually proportionally smaller in Gorilla than in Pan. While direct correspondences between multivariate isometry coefficients between the log-transformed and raw linear data series are not possible, it is worth noting that the femoral head loads negatively on the second PC axis of both the log-transformed and raw data series in the pooled African hominid sample, but not in the corresponding tables of the species-specific analyses (Table 1; Supplementary tables 8–12). Calculation of the Jolicoeur multivariate allometry coefficients in Pn. t. troglodytes and G. g. gorilla underscores the necessity of sampling all k=8 linear variates in the derivation of the preferred size metric, as these taxa also differ in the multivariate scaling of their osseous components of the elbow and knee joints and are not allometrically equivalent (Tables 4 and 5). Observed species-specific or genus-specific allometric scaling constants for any of the k=8 variates can be simply tested using conventional post-hoc tests for slopes, y-intercepts and elevations in the bivariate case, yet the observed scalar distinctions in these analyses do not compromise the preferred variate (GMSize) as a valid descriptor of size in comparative contexts. By retaining all k=8 linear variates in the analysis, a comparative size proxy is generated which is sufficiently powerful to verify hypotheses of allometric equivalence in the postcranial epiphyses of living and extinct taxa (Figure 2b). On the basis of these data, chimpanzees and gorillas are not allometrically equivalent animals in terms of their relative fore- and hindlimb epiphyseal joint profiles. If we seek to understand the functional and phylogenetic significance of multivariate scaling distinctions in closely allied taxa, then a profitable approach is to assess the significance of shared PCs using common principal components analysis.48-50
Summary statistics for the principal components (PC) analysis Natural logarithm PC1
PC2
Raw PC3
PC1
PC2
PC3
Extant African hominids (n=247) % Variance
96.35
1.14
0.68
97.47
0.71
0.53
% Cumulative
96.35
97.48
98.76
97.47
98.18
99.14
Darroch and Mosimann51 have extended the foundations of Jolicoeur’s multivariate allometry to canonical component space, subsuming the k-group method of canonical variates analysis.52,53 Canonical variates analysis is a k-group extension of Fisher’s linear discriminant analysis for k=2 groups,52,53 and this extension has both practical and theoretical significance in biological anthropology. Conventional application of a two-sample discriminant function analysis (DFA) in forensic assessment of sex or ancestry54-58 proceeds from a series of multidimensional (k=>3) variates under expectations that the predefined ‘sets’ sample discreet multivariate universes.52,53 Nevertheless, substantial overlap exists in observed univariate and multivariate distributions of female and male individuals in all but the most dimorphic mammalian taxa. This observation is confirmed in recent humans by general consistency of classification statistics of about 75–85% in population-specific DFA analyses in sex assessment across the skeletal system and exemplifies the continuous underlying pooled-sample distribution of female and male individuals in multivariate space.54-58 Following the extension outlined in Darroch and Mosimann51, if the GM of any suite of k variates is an appropriate descriptor of size, then an equally satisfying correspondence should exist among the total variance explained by PC1, the classification statistics derived using a DFA, and the underlying pooled-sample distributions of the two GM sets.
Extant Old World monkeys (n=149) % Variance
97.28
0.87
0.64
96.96
1.49
0.69
% Cumulative
97.28
98.14
99.22
96.96
98.45
99.40
Extant Old World felids (n=62) % Variance
97.59
1.35
0.40
98.00
1.01
0.35
% Cumulative
97.59
98.94
99.62
98.00
99.01
99.66
Pan t. troglodytes (n=91) % Variance
76.48
5.52
4.12
78.94
5.06
4.80
% Cumulative
76.48
82.00
89.76
78.94
84.00
92.31
Gorilla g. gorilla (n=102) % Variance
94.88
1.71
0.86
95.42
1.44
0.95
% Cumulative
94.88
96.59
98.17
95.42
96.86
98.66
The Pn. t. troglodytes (M=39/F=52) and G. g. gorilla (M=56/F=48) series were subjected to DFA based on known sex using an earlier version of PAST (v. 2.3).47 DFA equations are given in Supplementary table 13 and the correct percentage classifications for Pan and Gorilla were about 86% and 99%, respectively. The exemplary classification of Gorilla is a clear function of the discreet nature of the intraspecific size distribution (bimodal) and is consistent with extreme sexual size dimorphism. Only a single male specimen was incorrectly classified as female. In contrast, the comparably monomorphic Pan yields a percentage classification that approximates the upper range of a typical DFA classification in recent humans with 12 specimens incorrectly assigned to their respective sexes. Classification statistics for both raw and log data were equivalent across both samples (Supplementary table 13). Both data sets effectively satisfy expectations based upon canonical components of size and shape.51 Exploration of pooled-sample distributions of Pn. t. troglodytes reveals considerable correspondence between incorrect classifications to the respective sets when individual specimens are expressed as zand t-scores of sex-specific means and standard deviations, whereas the
That both Jolicoeur and Mosimann’s conditions are met by the size variate preferred here (GMSize) is equally confirmed by data in Figures 2–4. In all five series, there exists a perfect correspondence between the PC1 scores and GMSize (r=1.00) for the k=8 linear variates of the foreand hindlimb epiphyses (Figures 2–4). Individual variate loadings on the first PC across the data sets reveals a satisfying consistency within each (Tables 1–6), yet their multivariate isometry coefficients are sufficiently distinct to support family-level and even species-specific allometric scaling trajectories of fore- and hindlimb epiphyseal joints, as revealed in the positive and negative loadings of the various samples on PC2 (Figure 2b). These observed distinctions further caution against the universal efficacy of any ‘scaling criterion’ derived from interspecific allometric scaling solutions to a single specimen or a series of specimens. Any universal assumption concerning scaling of the proximal femoral articulation in Pn. t. troglodytes and G. g. gorilla based upon theoretical derivations from pooled-sample analyses of African hominids or Old World monkeys, is not supported by the observation that the proximal femoral articulation scales with negative allometry in these species, as
South African Journal of Science
http://www.sajs.co.za
3
Volume 111 | Number 9/10 September/October 2015
Research Article Page 4 of 10
Determination of a novel size proxy
correspondence in Gorilla is perfect (Supplementary tables 14–17). As in conventional DFA of sex assessment in humans, there is a substantially higher incorrect classification of female specimens (n=8) than male specimens (n=4) in Pn. t. troglodytes. The question logically arises as to whether this phenomenon is typical of all monomorphic mammalian taxa, and is certainly worthy of further comparative exploration.
subtle distinctions in the loadings of the individual variates on the first and subsequent PCs (Tables 7 and 8). Multivariate allometry coefficients also change subtly, underscoring the observations in Figure 2 and in previous analyses that Pan and Gorilla are not allometrically equivalent animals. The potential loss of information in more distinct mammalian taxa is graver, as no assumptions of allometric equivalence are made in the entire k=8 linear series. Stated simply, the geometric mean of the entire k=8 linear dimensions of the fore- and hindlimb epiphyses of the postcranial skeleton retains relevant information pertaining to absolute individual size and equally relevant information about relative joint size, which clearly differs in Pan and Gorilla and within the large-bodied felids (Figure 2b). On the strength of the correlation coefficients, it is clear that any single variate (such as the proximal femoral articulation) can be used to estimate the preferred size proxy in comparative size appraisals of living and fossil taxa via simple bivariate regression of x on y.
Given that the preferred size variate in this analysis is simply the geometric mean (GMSize) of k=8 linear dimensions of the fore- and hindlimb epiphyses, this variate can be reliably constructed from any linear combination of the available series (i.e. k=