Anal. Chem. 2005, 77, 4027-4033
Determination of Bromine Stable Isotopes Using Continuous-Flow Isotope Ratio Mass Spectrometry Orfan Shouakar-Stash,* Shaun K. Frape, and Robert J. Drimmie
Department of Earth Sciences, University of Waterloo, 200 University Avenue West, Waterloo, Ontario, Canada N2L 3G1
A new methodology for bromine stable isotope determination by continuous-flow isotope ratio mass spectrometry (CF-IRMS) was developed. The technique was tested on inorganic samples. Inorganic bromide was precipitated in the form of silver bromide by using silver nitrate in a standard methodology. Bromine stable isotope analysis was carried out on methyl bromide (CH3Br) after converting silver bromide to methyl bromide by reacting it with methyl iodide (CH3I). The system used in this study is an IsoPrime IRMS, with analytical capabilities of both dual-inlet and continuous-flow modes coupled with an Agilent 6890 GC equipped with a CTC Analytics CombiPAL autosampler. This new technique measures samples as small as 0.2 mg of AgBr (1 µmol of Br-). The bromine stable isotope analysis using continuous flow technology showed excellent precision and accuracy. The internal precision using pure methyl bromide gas is better than (0.03‰ ((SD); the external precision using seawater standard is better than (0.06‰ ((SD) for n ) 12. Moreover, the sample analysis time is 16 min, as compared to 75 min needed in previous techniques. This allows for 50 samples to be analyzed in 1 day, as compared to 8 samples using the conventional techniques. A series of natural saline formation waters and brines from sedimentary and crystalline rock environments was measured by this new methodology to test the potential natural range of δ81Br. The bromine isotopic composition of the samples ranged from 0.00 to +1.80‰ relative to standard mean ocean bromide (SMOB). Initial trends and distinctive isotopic difference were noticed between crystalline shield brines and sedimentary formation brines.
INTRODUCTION Most naturally occurring bromine (neglecting the very small contribution from unstable isotopes produced in nature by spontaneous fission and nuclear reactions induced by cosmic radiation) consists of a mixture of two stable isotopes: 79Br and 81Br. Relative abundances of these isotopes are 50.686 and 49.314%, respectively.1 * Corresponding author. Phone: 1-519-888-4567, Ext. 5305. Fax: 1-519-7467484. E-mail:
[email protected]. (1) Commission on Atomic Weight and Isotopic Abundances. Pure Appl. Chem. 1998, 70, 217. 10.1021/ac048318n CCC: $30.25 Published on Web 04/29/2005
© 2005 American Chemical Society
Seawater is the largest natural source of bromine. It contains ∼0.0065% bromine, in comparison to 1.9% of chlorine (representing a chlorine/bromine mass ratio of nearly 300:1).2 There are relatively few minerals composed chiefly of bromide compounds; those that do exist usually contain silver bromide. The natural variation of δ81Br has been reported in only one study. The results are for oil field formation waters and range from +0.08 to +1.27‰ relative to standard mean ocean bromide (SMOB).3 This range is smaller than that reported for stable Cl isotopes but is significant enough to indicate that measurable isotopic fractionation processes exist in natural systems. In this paper, this range has been increased to between 0.00 and +1.80‰ for natural samples and -0.64 to +1.80 ‰ in all samples, including man-made reagents. This range, which is obtained from two studies, shows a potential use of bromine stable isotope in determining sources of natural waters and evaluating geological and hydrogeological processes, especially if used in conjunction with other stable isotopes, such as chlorine. Furthermore, the use of bromine stable isotopes as a tool could be extended to inorganic and organic contamination studies. The use of silver bromide was introduced as early as 1840 in photography, and through this, bromine became an industrial chemical. Its use increased with the advent of the photographic film, motion pictures, and X-ray photography.4 The vast growth of the bromine chemical industry began in 1924 with the commercial application of ethylene dibromide as a lead scavenger additive in gasoline. Since then, other bromine-containing products have followed, including methyl bromide for soil and space fumigation; brominated flame retardants for plastics, textiles, and polymers; high-density clear fluids for oil and gas well completion; and biocides for treating industrial and recreational water, intermediates for agricultural pesticides, and pharmaceuticals.5 Attempts to measure bromine stable isotopes were made as early as 1920.6 In 1936, more attempts were made using a Dempster-type mass spectrograph.7 The measurement was done by analyzing positive and negative ions (Br+, Br2+, Br2+, and Br-), and a precision of (25‰ was reported. Ten years later, another (2) Downs, A. J.; Adams, C. J. The Chemistry of Chlorine, Bromine, Iodine, and Astatine, Pergamon Press: 1975. (3) Eggenkamp, H. G. M.; Coleman, M. L. Chem. Geol. 2000, 167, 393-402. (4) Yaron, F. In Bromine and Its Compounds; Jolles, Z. E., Ed.; Ernest Benn Limited: London, 1966, p 4. (5) Bassett, D.; Chetland, J.; Kyte, A. B.; Marsdon, H. M.; Roberts, P. N.; Summers, W. N.; Watkins, D.; Wylde, L. E. In Bromine Compounds, Chemistry and Applications; Price, D., Iddon, B., Wakefield, B. J., Eds.; Elsevier: Amsterdam, 1975, p 8. (6) Aston, F. W. Philos. Mag. 1920, 40, 628-634. (7) Blewett, J. P. Phys. Rev. 1936, 49, 900-903.
Analytical Chemistry, Vol. 77, No. 13, July 1, 2005 4027
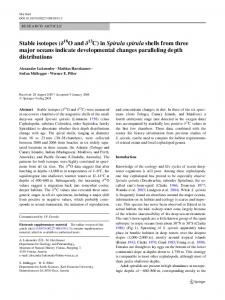
Figure 1. Schematic of the multicollector array on the CF-IRMS (IsoPrime GV Instruments). Collectors 1, 2, and 3 are the standard triple collector, and collectors 4-9 are dedicated collectors for specific masses.
study used a mass spectrograph of the Nier type to analyze bromine stable isotopes.8 Results were obtained from measuring positive ions (Br+, Br2+, and Br2+) formed from electronic bombardment of bromine vapor. A precision of (4‰ was achieved. In 1955, isotopic compositions of elemental bromine from various suppliers and diverse origins were determined by negative thermal ionization mass spectrometers (N-TIMS);9 however, no significant differences between these samples were found, and the reported precision was approximately ( 4‰. In 1964, another study reported the use of TIMS in bromine stable isotope measurement with an improved precision of (1.8‰.10 A much more precise technique was introduced in 1993 by means of positive-TIMS,11 based on measuring positive ions of Cs2Br+. This technique is useful for analyzing very small samples (4-32 µg of Br) and has good precision ((0.12‰) for such small samples. Dual inlet isotope ratio mass spectrometry (DI-IRMS) was used for the first time to determine bromine stable isotope composition in 1978.12 The technique is based on analyzing methyl bromide gas. More recently, in 2000, a descriptive work was published on bromine separation and isotopic determination of bromine by DI-IRMS.3 The study reported the use of 2-8 mg of Br and a precision of (0.18‰. Although the precision reported in the last technique is highly improved in comparison to previous techniques, there is an interest in improving the precision to better benefit from the small range of variation of the bromine stable isotope composition. The previous technique is also limited by the sample size requirement and by the lengthy off-line preparation process. Therefore, there is great interest in lowering the required sample size and shortening and simplifying the analytical preparation time. In the past decade, continuous flow isotope ratio mass spectrometry (CF-IRMS) allowed more rapid analysis, reduced the required sample sizes, and improved the precision on different stable isotope analyses, such as 13C, 15N, 18O, 2H, 34S, and 37Cl.13-16 (8) Williams, D.; Yuster, P. Phys. Rev. 1946, 49, 556-567. (9) Cameron, A. E.; Lippet, E. L., Jr. Science 1955, 121, 136-137. (10) Catanzaro, E. J.; Murphy, T. J.; Garner, E. L.; Shields, W. R. J. Res. Natl. Bur. Stand., Sect. A 1964, 68, 593-599. (11) Xiao, Y. K.; Liu, W. G.; Qi, H. P.; Zhang, C. G. Int. J. Mass Spectrom. Ion Processes 1993, 123, 117-123. (12) Willey, J. F.; Taylor, J. W. Anal. Chem. 1978, 50, 1930-1933. (13) Begley, I. S.; Scrimgeour, C. M. Rapid Commun. Mass Spectrom. 1996, 10, 969-973. (14) Brand, W. A. J. Mass Spectrom. 1996, 31, 225-235. (15) Morrison, J.; Brockwell, T.; Merren, T.; Fourel, F.; Phillips, A. M. Anal. Chem. 2001, 73, 3570-3575. (16) Shouakar-Stash, O.; Drimmie, R. J.; Frape, S. K. Rapid Commun. Mass Spectrom. 2005, 19, 121-127.
4028
Analytical Chemistry, Vol. 77, No. 13, July 1, 2005
The objective of this paper is to present a new technique based on CF-IRMS to determine the bromine stable isotope composition in inorganic samples. This method will allow more work to be done to explore the usefulness of bromine stable isotopes in geochemical, hydrogeological, and ecological studies. EXPERIMENTAL SECTION Materials. The following chemicals are used in the bromine separation process: sulfuric acid (trace EMD, Catalogue no. SX1247-2); potassium hydroxide pellets (J. T. Baker, Catalogue no. 3140-01); potassium dichromate (EM Science, Catalogue no. PX1445-1); and zinc powder, median 6-9 µm (Alfa Aesar, Catalogue no. 10835). For the preparation process of silver bromide (AgBr), the following are used: nitric acid (Omni trace EMD, Catalogue no. NX0407-2), potassium nitrate 99.0% (Alfa Aesar, Catalogue no. 13443), and silver nitrate 99.9+% minimum (Alfa Aesar, Catalogue no. 11414). Methyl iodide 99.5% (Alfa Aesar, Catalogue no. 31876) is used in the methyl bromide preparation. The following items are used in the methyl bromide preparation: 20-mL amber headspace vials, 23 × 75 mm (LabSphere, Inc., Catalogue no. 20-6000); crimp seals, magnetic, 20 mm (Chromatographic Specialties, Catalogue no. SB405038); Tegrabond Disk (septa), 125/10 MIL silicone/Teflon, 20 mm (Chromatographic Specialties, Catalogue no. C8812120M); helium gas (ultrahigh purity 5.0); inflatable glove chamber (I2R Glove Bag, model R-17.17); and 20-mm crimper (Kimble, Catalogue no. 69901-20). Instruments. A CF-IRMS (IsoPrime, Micromass, currently GV Instruments) was used in this study. The mass spectrometer is designed to work in two modes: continuous flow (CF) and dual inlet (DI). This IRMS has nine collectors, consisting of standard triple collectors and six dedicated collectors: two for m/z 50 and 52 (CH3Cl), two for m/z 62 and 64 (vinyl chloride), and two for m/z 94 and 96 (CH3Br) (Figure 1). Methyl bromide gas is toxic and not safe to run in a continuous-flow mode from a reference tank. Therefore, one of the bellows on the dual inlet part of the IRMS is used as a reservoir for the methyl bromide reference gas. An Agilent 6890 gas chromatograph (GC) equipped with a CTC Analytics CombiPAL autosampler was attached to the IRMS. A DB-5 MS gas chromatographic column 60 m × 0.320 mm, 1-µm film thickness (J & W Scientific Inc., Catalogue no. 1235563) was used in the GC for gas separations. A direct injection sleeve, 1.5mm i.d. (Supelco, Catalogue no. 2-0517,05) was used as an inlet liner. The autosampler can hold 32 vials (20 mL), and samples
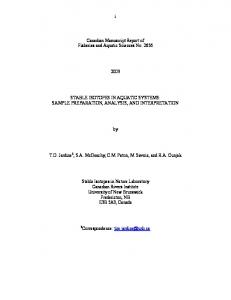
Figure 2. Bromine special distillation apparatus.
were injected into the GC via a 1.0-mL gastight syringe, 23 gauge, part no. 5 (LabSphere, Inc., Catalogue no. L120.00041). A four-way Valco valve with two positions was installed between the GC and the IRMS. The end part of the GC column was connected to one of the two in ports of the valve, while the other in port was connected to the ultrapure helium gas. The two out ports were connected to the IRMS and to a FID detector mounted on the GC. This setup is designed to allow a constant flow of helium into the IRMS. In position A, flow from the GC is directed to the FID, while helium gas is flowing into the IRMS, and in position B, the out flow from the GC is directed to the IRMS, and the helium flow is directed to the FID. This setup is important to direct only desired compounds to flow into the IRMS (CH3Br in this case) and to direct all other compounds to the FID to be burned. A 100-µm deactivated capillary column was used to connect the valve port with the IRMS. An open split was installed on this line to lower the pressure to 2-3 × 10⁻⁶ mbar in the capillary before helium flowed into the IRMS. The open split was vented into the fume hood via a Teflon tube, because CH3Br gas is toxic and should not be vented to the laboratory atmosphere. All vent ports on the GC were vented into a fumehood. The helium flow that feeds the valve was balanced to the flow from the GC column. This is important to ensure the same background level when switching between the two positions, A and B. A separation apparatus (Figure 2), specially designed at the University of Waterloo glass shop, consists of the following: threeneck, round-bottom 500-mL flask; two-neck, round-bottom 500mL flask; simple condenser; 125-mL Erlenmeyer flask; fritted gas dispersion tube; power-controlled mantle; hemispherical heating round-bottom (Glas-Col apparatus company, Catalogue no. 0406), which is controlled by a variable transformer; cooling bath; and glass connection tube. All glassware joints were designed with either a male ball (29/15) or female socket (29/15) to facilitate grease-free connections between all glassware to eliminate any possible contamination. Viton O-rings (Canadian Bearing, Catalogue no. V-210) were used to seal the glassware joints. Bromine Separation. Bromine concentration in natural samples is very low, especially in comparison to chlorine concentration. For example, the Br/Cl ratio in seawater is 0.00342 and it ranges from 0.0002 to 0.04 in different natural water types. Therefore, bromine separation is an essential step. The methodol-
ogy used for bromine separation follows closely the classical technique presented by earlier studies.3,17,18 Briefly, the technique depends on the differences of oxidation-reduction behavior of different halogens. Halide ions with higher atomic masses are easier to oxidize than ones with lower atomic masses. Therefore, Br is oxidized more easily than Cl. The separation is conducted in the special distillation apparatus shown in Figure 2. The threeneck, round-bottom 500-mL flask is filled with sample containing 1-10 mg of Br-. Ultrapure water is added to bring the total volume in the flask to 100 mL. Samples with low Br- concentration are evaporated on a hot plate below boiling (∼80 °C) to concentrate the Br- in solution. Then 10 g of K2Cr2O7 is added, and 6-mm glass beads are added to facilitate gentle boiling. The graduated addition funnel is connected to the flask and filled with 20 mL of 1:1 H2SO4/H2O (ultrapure). A fritted gas dispersion tube is connected to the middle port of the flask to feed a steady flow of ultrapure helium to the flask to facilitate the movement of formed gases forward and to avoid back-flushes. The two-neck, roundbottom 500-mL flask is filled with 200 mL of solution containing 2 g of KOH. A cooling bath filled with crushed ice is placed under the two-neck flask. The two flasks are connected with a condenser, and the cooling ports are connected to the cooling water system. A 125-mL Erlenmeyer flask is filled with 100 mL of solution containing 1 g of KOH and connected to the two-neck flask. The power-controlled mantle, hemispherical heating round-bottom is placed below the three-neck flask. Once all connections are secured and everything is ready, the helium tank is opened, and a flow of 200 mL/min is maintained during the entire separation period. Then the stopcock on the addition funnel is opened to allow the H2SO4/H2O mixture to flow into the flask. After the addition of the mixture, 100 mL of ultrapure water is added via the addition funnel. The flask is then heated slowly to bring the solution to boiling. It is at this stage that bromine gas (Br2) (yellowbrown vapor) starts to form and flow, advancing to the second flask via the condenser. In the second flask, Br2 gas reacts with the KOH solution to form KBr and KBrO. Any escaped Br2 gas will be reduced in the Erlenmeyer flask with KOH solution. The distillation lasts for 20 min after boiling starts to ensure that all Br- in solution has been oxidized and transferred. This has been (17) Dechan, M. J. Chem. Soc. 1886, 49, 682-685. (18) Friedheim, C.; Meyer, R. J. Chemie 1892, 1, 407-422.
Analytical Chemistry, Vol. 77, No. 13, July 1, 2005
4029
tested by calculating the final yield of the Br- from samples with known bromine concentration. Then the solutions from both the second flask and the Erlenmeyer are transferred to a beaker, 3 g of zinc powder is added, and the mixture is boiled for 10 min to reduce all BrO- ions in the solution to Br-. The solution is then filtered through a 0.22-µm Millipore Express Plus (PES). It is important to stress that bromine gas is corrosive to all body tissues and may cause serious burns; chronic exposure may cause pulmonary edema, pneumonia, diarrhea, and rashes. Because of these factors and the danger of dealing with strong acids and bases in this separation method, it is highly recommended that all work be done in a fumehood. Silver Bromide Preparation. After bromine is separated, it is precipitated as silver bromide (AgBr). The technique used is similar to that used in silver chloride precipitation and follows earlier studies.19,20 Briefly, the method aims at precipitating AgBr from solution at fixed Br- content, fixed ionic strength, and fixed pH. The solution containing Br- is first acidified to pH ∼ 2 by adding ultrapure concentrated nitric acid (HNO3). Then 18 g of potassium nitrate (KNO3) is added to the solution to increase the ionic strength, which helps to form small crystals of AgBr. Then 2 mL of silver nitrate (AgNO3) solution (0.2 M) is added to precipitate AgBr. The beakers are stored in a dark place overnight for the precipitation to come to completion. Solutions are tested with a drop of AgNO3 to ensure that all AgBr is precipitated; if not, more AgNO3 is added and allowed to settle. AgBr is stored in a dark place at all times, because it is sensitive to light and will photodecompose. Once precipitation is complete, it is transferred into an amber vial, and AgBr is allowed to settle. Then it is rinsed twice with 5% HNO3 rather than ultrapure water because the rinsing solution should contain electrolyte to avoid the precipitate’s becoming colloidal (nitric acid was chosen because it has no reaction with the precipitate and leaves no residue upon drying). Samples are then placed into an oven at 80 °C overnight to dry. Dried samples are stored in a dark place until CH3Br preparation. Methyl Bromide Preparation. Silver bromide is reacted with methyl iodide (CH3I) to form CH3Br gas. Samples are weighed (0.5 mg) into 20-mL amber crimp vials where the reaction takes place. Vials are stored under vacuum in a desiccator and in a dark place if the samples are not going to be prepared immediately. Once samples are ready to be prepared, they are placed in an inflatable glovebag connected to an ultrapure helium tank. The glovebag should be placed in a fumehood during this procedure because CH3I is toxic. The helium tank is opened, and helium is allowed to inflate the glovebag a few times by sealing the bag then opening it slightly to force the helium to flush out any air in the bag. Finally, the glovebag is sealed, and the helium flow is turned down. Vials are tipped on an angle and flushed gently with a very low stream of helium to avoid losing sample. CH3I (100 µL) is added to the samples, and then the vials are sealed. It is recommended that CH3I be added to 4-6 vials at a time and then these vials be sealed, and so on. Otherwise, the CH3I might evaporate from the early vials by the time addition of CH3I is finished. Vials are checked and retightened once more at the end of the loading procedure. Vials need to be sealed (crimped) very well to avoid any leakage, because the desired (19) Taylor, J. W.; Grimsrud, E. P. Anal. Chem. 1969, 41, 805-810. (20) Eggenkamp, H. Ph.D. Thesis, University of Utrecht, 1994.
4030
Analytical Chemistry, Vol. 77, No. 13, July 1, 2005
final product (CH3Br) is a gas. For the reaction to proceed to completion, vials are placed in an oven for 56 ( 5 h at 80 °C. Sample Analysis. Sample analysis involves three steps. The first step is sample injection, which is done automatically via an autosampler (CombiPAL) following this protocol: filling volume, 750 µL; filling speed, 300 µL/s; filling strokes, 3; pull-up delay, 1000 ms; preinjection delay, 300 ms; injection volume, 750 µL; injection speed, 800 ms; postinjection delay, 5000 ms; postclean with air 4 times; and flush with helium for 6 min. The syringe is flushed with helium (through a hole in the syringe barrel especially designed for the flushing purpose) between samples to eliminate any cross-contamination from one sample to another. The second step is gas separation via the GC. The GC setup is as follows: flow is set at 1.2 mL/min and kept constant during the run. The injection port temperature is set at 270 °C. The oven temperature is programmed as follows: initial 35°C for 7 min.; ramp at 35 °C/min; final 250 °C and hold for 2 min. The oven temperature programming is important for the separation of the CH3Br and CH3I gases and cleaning the column between samples. Split ratio is set at 5. The third step is the analysis of the CH3Br by the mass spectrometer. A method is created for the analysis in a way that allows the flow from the GC to be directed to the FID for the first 360 s (position A). During that time, a set of reference pulses are allowed to occur by opening the dual inlet reservoir for 40 s for each pulse. After 6 min, the flow into the IRMS (position B) is allowed to carry the CH3Br into the source for the bromine isotope composition analysis. At 600 s, the flow is directed again to the FID (position A) to prevent CH3I from flowing into the IRMS. During that time, another set of reference pulses may be added. When the analyses are completed, the vials should be opened only in a fumehood to avoid releasing the residual CH3Br to the laboratory atmosphere. CH3Br is an extremely toxic gas and easily absorbed through the lungs. RESULTS AND DISCUSSION The bromine isotopic compositions are reported in permil (‰) deviation from isotopic standard reference material using the conventional δ notation, where, δ ) (Rsample/Rstandard) - 1) × 1000. 81Br/79Br is the measured isotopic ratio. The reference material is standard mean ocean bromide (SMOB)3. Reaction Vials. Amber headspace vials (20 mL) with crimp caps were used in this technique along with Tegrabond Disk (septa). This combination was chosen because it allowed a very good seal for 2-3 days at 80 °C. This was recommended in an earlier study on the determination of chlorine stable isotopes.16 The septa consist of two layers, silicone and Teflon. Because the Teflon is chemically inert, it was placed facing inside to be in contact with the chemicals. This minimized/eliminated any possible reactions or contamination between the sample/ chemicals and the septa. The thick silicone layer provided a very tight seal to the vials, and at the same time, it is soft enough for the sampling needle to penetrate without being damaged. Blanks. Three different types of blanks were analyzed to determine the potential background contribution of CH3Br other than from samples. The first blank was an empty vial containing only air; two other blanks were placed in the glovebag along with samples. The second blank was sealed with only helium gas in
Figure 3. δ81Br (‰) values versus reaction time (hours). The error bars show that precision is improved significantly at longer reaction time ((0.29‰ at 17 h and (0.05‰ at 66 h).
the vial, and the third one was sealed after the addition of CH3I. None of the blanks showed a CH3Br peak; however, blanks were added to every batch in the daily routine of sample analyses. Reaction Time. The plot of reaction time (hours) versus δ81Br (‰) in Figure 3 shows that the reaction time needed is 56 ( 5 h at 80 °C. This was determined by analyzing one of the in-house standards for different reaction times. Five separate vials were analyzed at each time segment. We found that at short reaction times (18-27 h), the resultant peak area is smaller than expected and the δ values are more depleted than they should be. At midrange time (42 h), the peak area appeared as expected;
however, the δ value is still depleted, which is the result of a preferential reaction with light isotope atoms. Expected peak area and δ values were achieved at reaction times between 51 and 66 h. The error bars in Figure 3 show that precision is improved significantly at longer reaction times ((0.29‰ at 17 h and (0.05‰ at 66 h). Accuracy and Precision. Figure 4 illustrates a run of methyl bromide in the continuous flow mode. The chromatogram shows eight reference pulses and a sample peak. The retention time for the CH3Br peak is around 540 s. The total length of the run is 16 min. Even though one reference pulse was enough during the analysis, the length of the analysis and the retention time of the CH3Br peak permitted the introduction of eight reference pulses, and the average result of their isotopic signature values is used in the calculation of the isotopic value of the sample. An accuracy test was performed using a set of samples with a range of bromine stable isotope composition of 1.8‰ (0.00 to +1.80‰). Figure 5 illustrates a comparison between the results achieved with the new CF-IRMS and those achieved with the traditional off-line technique using the DI-IRMS.3 The high correlation coefficient (R2 ) 0.9899) of the linear regression in Figure 5 indicates that the technique and machine-dependent fractionations are predictable over an ∼1.8‰ range of δ81Br values and can be calibrated by using a simple linear relationship. An internal precision was determined by injecting pure CH3Br gas. A standard deviation better than (0.03‰ ((SD) was achieved (n ) 10). An external precision was determined by analyzing two standards, NBS-977 (δ81BrSMOB ) -0.64 ( 0.06‰
Figure 4. Chromatogram of methyl bromide analysis (NBS-977 standard) in continuous-flow mode. The chromatogram illustrates eight reference pulses and a methyl bromide peak at 8.95 min. Injection time is at time 0. The upper trace is the 94/96 ratio, the middle trace is the m/z 96 ion current, and the last trace is the m/z 94 ion current.
Analytical Chemistry, Vol. 77, No. 13, July 1, 2005
4031
Figure 5. Comparison between δ81Br (‰) values obtained by DIIRMS and CF-IRMS. The comparison indicates a high correlation coefficient (R2 ) 0.9899) of the linear regression.
Figure 7. Test of memory effect of CF-IRMS analysis of bromine stable isotopes of three standards with a bromine isotopic composition that ranges over 2.3‰.
Figure 6. Relationship between δ81Br (‰) values and peak area (Ampere seconds × 10-10). Diamonds represent the raw values obtained from the CF-IRMS, and circles represent the peak area corrected values.
[(SD]) for n ) 12 and an in-house standard EIL-Br-1 (δ81BrSMOB ) +0.24 ( 0.06‰ [(SD]) for n ) 12. Linearity. A linearity test was conducted by analyzing an inhouse standard several times using different sample sizes (2001200 µg) covering 10-90% of the possible peak height and area. The obtained mean value of the raw data is 0.00 ( 0.09‰ (n ) 13). The results from the linearity test in Figure 6 showed a relationship (R2 ) 0.4797) between peak area and δ values. Both δ values (raw and corrected) are plotted versus peak area and shown in Figure 6. When applying peak area correction, the precision improved somewhat, but the corrected δ81Br values were not accurate (-0.11 ( 0.08‰). The plot shows that peak area correction is only needed at peak areas 2 × 10⁻¹⁰ A s does not improve the precision and negatively affects the accuracy of the results. Therefore, it is best to run the samples at peak area >2 × 10⁻¹⁰ A s without applying any peak area correction. Memory Effects. A memory effect test was conducted by analyzing three different in-house standards: EIL-Br-9 (-0.64‰), EIL-Br-1 (+0.24‰), and SS-MI-Br (+1.62‰). The δ bromine range is over 2.3‰ and covers the entire range of reported bromine δ values in the literature. The results showed no memory effects during the analysis of these three different standards (Figure 7). However, a cleaning protocol of the syringe consisting of four 4032 Analytical Chemistry, Vol. 77, No. 13, July 1, 2005
Figure 8. (a) Br (mg/L) versus δ81Br (‰) and (b) δ37Cl (‰) versus δ81Br (‰) values of natural saline formation waters and brines from sedimentary and crystalline rock environments. Triangles represent southern Ontario sedimentary samples, diamonds represent Canadian Shield brines, and circles represent Fennoscandian Shield brines. The line through the Fennoscandian samples is a calculated mixing line between two possible end members.
strokes of air and 6 min of helium flushed through the syringe was applied to avoid any possible memory effect or crosscontamination between consecutive samples. Potential Application and Data on Natural Samples. A series of natural saline formation waters and brines from sedimentary and crystalline rock environments was measured by the method to test the potential natural range of δ81Br. In addition, this range of samples would test the ability of the methodology
to handle very complex chemical matrixes found in these fluids. The isotopic composition of bromine from different samples ranged from 0.00 to +1.80‰. Figure 8a shows several trends that require further investigation external to this paper. The most enriched δ81Br occurs in more dilute saline fluids, often NaCl in composition, from the Fennoscandian Shield. Similar results appear to be found in more dilute sedimentary samples as well. Very concentrated Ca-Cl Canadian Shield brines show very little isotopic enrichment, with a slightly increasing isotopic signature with increasing concentration based on a very limited data set. On the basis of the preliminary data presented here, the two crystalline shield areas appear isotopically distinct from one another. Ages of fluids, rock types, and evolutionary history will have to be examined to further refine the reasons behind the differences. In Figure 8b, when δ81Br is plotted against δ37Cl, the different fluid/rock environments become very distinctive and seem to indicate that these two halogen isotopes used in conjunction should be potentially very useful in distinguishing fluid movement, mixing, processes of fractionation, and possible origin of the chemical components of these very concentrated fluids. A calculated mixing curve between two potential end members is demonstrated in Figure 8b. The calculated mixing curve fits the data obtained from the saline formation waters from the Fennoscandian Shield. Although this is not enough evidence to prove a mixing scenario and further investigation is necessary, it shows promising results and trends worth pursuing. Further work is necessary to improve our understanding of the different processes responsible for bromine stable isotope fractionation and variations in natural systems. CONCLUSIONS In this study, a new methodology was developed for bromine stable isotope determination by CF-IRMS. The bromine stable
isotope analysis using continuous flow technology showed excellent results, particularly with the high precision achieved ((0.06‰ [(SD]), for which precision is very important when dealing with small variations in isotopic range. The small sample size (0.2 mg) requirement is also an asset, especially for samples with very low concentrations of bromide. Furthermore, this technique is faster than previous off-line techniques, which will improve sample throughput. The technique is also very cost-effective. The bromine stable isotope values obtained in this paper extended the range of isotopic variation of stable bromine to values between -0.64 and +1.80‰. Although the range seems to be small, it is large enough to be useful to distinguish differences in standards and samples, especially when combined with the high precision achieved by this new methodology. Isotopic characterization of bromine isotopes could be a powerful tool for determining sources of formation waters and geological and hydrogeological processes, particularly if it is used in conjunction with other isotopes, such as chlorine stable isotopes. Hopefully, this new technique will encourage researchers to explore the use of stable bromine isotopes in both natural and contaminated systems. ACKNOWLEDGMENT Funding and resources for this project in the Environmental Isotope Lab (EIL) were provided by Canadian Foundation for Innovation and Ontario Innovation Trust and by NSERC RPG and MFA funding to Shaun Frape. The authors thank anonymous reviewers for their input. We also thank Mary Ellen Patton, Oya Albak, and Asma Kaghadou for their support and assistance.
Received for review November 15, 2004. Accepted April 7, 2005. AC048318N
Analytical Chemistry, Vol. 77, No. 13, July 1, 2005
4033