ELSEVIER
Marine Chemistry 57 (19971287-297
Determination of dissolved combined amino acids using microwave-assisted hydrolysis and HPLC precolumn derivatization for labeling of primary and secondary amines Niels O.G. Jgrgensen
*, Regitze E. Jensen
Department of Ecology and Molecular Biology, Royal Veterinary and Agricultural C, Denmark
Uniuersity, Thorualdsensvej 40, DK-1871 Frederiksberg
Received 19 September 1996; revised 25 February 1997; accepted 15 April 1997
Abstract Microwave-assisted, vapor phase acid hydrolysis of natural water samples for measurements of individual dissolved combined amino acids (DCAA) was examined and related to standard liquid phase hydrolysis. The microwave technique allowed a labor-saving, simultaneous hydrolysis of 20 samples in 20 min. Relative to liquid phase hydrolysis, a higher reproducibility and lower blanks were obtained with the present procedure. In some samples, the microwave vapor phase hydrolysis produced up to 39% higher DCAA concentrations than did the liquid phase hydrolysis. For HPLC analysis of the DCCA, derivatization with OPA (o-phthaldialdehyde) and AQC (6-aminoquinolyl-N-hydroxysuccinimidyl carbamat), a new reagent for fluorescent labeling of both primary and secondary amines, was tested and compared. Total DCAA concentrations (proline not included) determined with the two derivatization reagents were similar. Proline made up from 6 to 24% of the DCAA pools. Our results indicate that if DCAA are quantified with a derivatization procedure for only primary amines, concentrations of DCAA in natural waters will be underestimated, due to the occurrence of secondary amines such as proline. A reduced fluorescence intensity of AQC derivatives, relative to OPA, implies that AQC should not be used for
quantification of DCAA at concentrations below 200 nM. 0 1997 Elsevier Science B.V.
1. Introduction Dissolved combined amino acids (DCAA, in sensu Degens et al., 1964) are important intermediates in the cycling of nitrogen in natural waters. Concentrations of DCAA are reported to range from 0.1-3.0 PM in open sea water and up to 10 PM or higher in estuarine water and humic freshwaters (Lee and Bada,
* Corresponding
[email protected]. 0304-4203/97/$17.00
author.
Tel.:
+ 45-35282625;
e-mail:
1977; Antia et al., 1991; Tranvik and Jorgensen, 1995). DCAA appear to comprise between 10 and 30% of the pool of dissolved organic nitrogen (DON) in seawater and freshwater (Sharp, 1983; Hubberten et al., 1994). A variable portion of the DCAA is utilized by microbes, but some DCAA are recalcitrant to biological utilization (Keil and Kirchman, 1991, 1994). Recent studies indicate that DCAA may sustain lo-50 and 40-100% of the carbon and nitrogen
requirements
of
(Kroer et al., 1994). 0 1997 Elsevier Science B.V. All rights reserved.
PII SO304-4203(97)00042-X
marine
bacteria,
respectively
288
N.O.G. J@-gensen, R.E. Jensen/Marine
Analysis of the molecular composition of DCAA involves acid hydrolysis and a chromatographic separation of the amino acids. Acid hydrolysis traditionally has been performed by liquid phase digestion of the samples in 6 M HCl at 110°C for about 20 h in O,-free, sealed ampoules (Moore and Stein, 1963; Parsons et al., 1984). The hydrolysis time can be reduced to 1 h, or less, by increase of the temperature to 150-155°C (Lookhart et al., 1982; Cowie and Hedges, 1992). As an alternative to the liquid phase hydrolysis, a vapor phase procedure has been introduced. Tsugita et al. (1987) used HCl and trifluoroacetic acid fumes at a temperature of 158°C and reduced the hydrolysis time to 22.5 min. A comparison of the liquid and vapor phase techniques by Keil and Kirchman (199 1) indicated that traditional liquid phase hydrolysis may have caused up to a 3-fold underestimation of natural DCAA concentrations in marine waters. Recently, vapor phase hydrolysis in PTFE (teflon) reaction vessels heated by microwaves has been suggested for protein hydrolysis (Woodward et al., 1990; Grimm, 1992). Advantages of the microwave technique are a simple sample preparation prior to hydrolysis, a short hydrolysis time (20 min), and simultaneous hydrolysis of a large number of samples. Here we report application of microwave hydrolysis for the determination of DCAA in seawater and freshwater. For analysis of the individual DCAA, a new precolumn derivatization procedure for fluorescence HPLC analysis of both primary and secondary amines was tested.
Chemistry
57 (1997) 287-297
-
Vial Tray
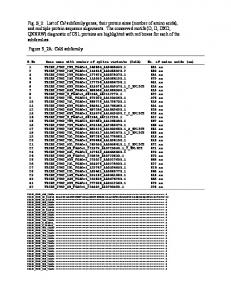
Fig. I. Reaction vessels for vapor phase hydrolysis. The tray inserts allow simultaneous hydrolysis of five samples in each of the four vessels. Six molar HCI was added to the vessels before closing in a ‘capping station’. Reproduced with permission from CEM Corporation, USA.
2. Materials and methods DCAA in seawater and freshwater and in a protein with a known amino acid composition (bovine serum albumin (BSA); Sigma, USA), were hydrolyzed by standard liquid phase and microwave vapor phase techniques. For liquid phase hydrolysis, 1 or 2 ml samples were transferred to 10 ml glass ampoules (baked at 550°C for 4 h). Analytical grade 37% HCl (Merck No. 13386; Merck, Germany) or Suprapur 20% HCl (Merck No. 318) each containing 0.5% phenol (Merck No. 206) to remove oxygen, were added to final concentrations of 6 M. The ampoules were flushed with N, for 2 min, sealed and heated to
110°C (+2”C) for 20 h. After the hydrolysis, the HCl was removed by freeze-drying. The samples were redissolved in borate buffer at pH 8.8 (for derivatization with AQC (6-aminoquinolyl-N-hydroxysuccinimidyl carbamat) or pH 12 (for derivatization with OPA (o-phthaldialdehyde). For microwave hydrolysis, freeze-dried samples of 1 ml in 1.5 ml glass vials were transferred to 45 ml PTFE reaction vessels, each with an insert for 5 vials (CEM Corporation, USA) (Fig. 1). To each reaction vessel was added 5 ml 6 M analytical grade or Suprapur grade HCl, each containing 0.5% phe-
N.O.G. J@rgensen, R.E. Jensen/Marine
nol. After a careful closure in a CEM ‘capping station’ (mechanical device for a tight closing), the vessels were placed on a turntable and transferred to a MSD-81 D microwave oven (CEM Corporation, USA). Oxygen was removed from the vessels by evacuation to about 1 Torr, followed by filling with N, to a pressure of 15 psi. Evacuation and N, addition was repeated three times. At 1.5 psi N, pressure in the vessels, the microwave oven was turned on at full intensity (about 630 W). The upper pressure limit was set to 55 psi, corresponding to a maximum temperature of 150°C. The hydrolysis time was varied from 5 to 30 min to optimize the time required for a complete hydrolysis. Based on these tests, a hydrolysis time of 20 min was found sufficient (see later). After hydrolysis, acid vapor and nitrogen gas were released through a vent valve in the oven. With each hydrolysis of 20 samples (4 reaction vessels) at least one empty, freeze-dried vial was included and served as a blank. The use of 1.5 ml vials in the 5-position inserts were found largely to eliminate drops of condensed HCl from falling into the vials after hydrolysis (often HCl drops are formed on the inside of the teflon vessel caps during cooling). A specific CEM condensation shield that is intended to remove drops of condensed HCl from the samples cannot be recommended. As with the ampoule hydrolysis, the samples were redissolved in borate buffer at pH 8.8 (for AQC analysis) or pH 12 (for OPA analysis) after the hydrolysis. Amino acid content of the blanks (typically a mean value of 5 to 8 blanks were used) was subtracted from the measured amino acid concentrations in the samples. The following precautions were taken to reduce the amino acid background level: (i) Before hydrolysis of a series of samples, a complete microwave cycle was repeated twice with only inserts in the reaction vessels. The acid-phenol mixture was discarded after each run, followed by washing of reaction vessels and inserts in Mini-Q water. (ii) All handling of glass vials and inserts was carried out with gloves and a pair of tweezers, as fingerprints on just one vial was found to contaminate all samples with amino acids. The hydrolyzed amino acids were quantified using a Waters Associates (USA) HPLC system: two 510 pumps, a helium solvent degassing system, a 717 autosampler, a 150 X 3.8 mm RP18 steel col-
Chemistry 57 (1997) 2X7-297
289
umn, a 474 fluorescence detector, a Millennium 2010 data acquisition software, and a temperature control module (for AQC analysis). Two procedures were used for analysis of the amino acids. In the first method, the amino acids were detected as fluorescent primary amines after derivatization with o-phthaldialdehyde (OPA) according to Lindroth and Mopper (1979) and Jorgensen et al. (1993). The hydrolyzed samples were redissolved in a 1.25 M borate buffer at pH 12 and filtered through a 13 mm 0.2 pm pore size membrane filter cartridge. Blanks received a similar treatment. All samples were derivatized in the autosampler, using a 5 to 20 ~1 sample volume and 1 to 4 ~1 OPA mixture (100 mg o-phthaldialdehyde (Merck) dissolved in 1 ml methanol and 1 ml borate buffer at pH 12, followed by addition of 200 ~1 2-mercaptoethanol). Excitation and emission wavelengths were 338 and 460 nm, respectively. An amino acid mixture (AA-S-18, Sigma, USA) to which was added asparagine, glutamine, y-aminobutyric acid (GABA), a-aminobutyric acid (a-ABA), diaminopimelic acid (DAPA), omithine or taurine was used as a standard. In the second method, both primary and secondary amines were measured after derivatization with 6-aminoquinolyl-N-hydroxysuccinimidyl carbamat (AQC). AQC was purchased as part of an AccQ Fluor Kit from Waters, but the compound can rather easily be synthesized (Cohen et al., 1993). Derivatization of the amino acids with AQC was performed manually before HPLC analysis. For standards, 10 ~1 of the AA-S-18 amino acid mixture (original or added individual non-protein amino acids) was adjusted to pH 8.8 with 70 ~1 200 mM borate buffer. The samples were mixed and added 20 ~1 1 mM AQC dissolved in acetonitrile. After an immediate mixing, the samples were heated for 10 min at 55°C to degrade a tyrosine byproduct. Hydrolyzed water samples and blanks (all redissolved in 200 mM borate buffer at pH 8.8 and filtered through a 0.2 pm pore size membrane filter) were typically derivatized by addition of 20 ~1 1 mM AQC to 80 ~1 sample. For analysis, 10 ~1 (standard) or 25 to 50 ~1 (sample) were injected into the HPLC system. Maximum injected volume was about 60 ~1. With greater volumes, a peak broadening was observed. The AQC stock solution is stable for about a week if kept in a desiccator, or for several weeks when stored frozen
290
N.O.G. Jgwgensen, R.E. Jensen/Marine
at - 20°C or lower. The amount of AQC required for the derivatization can be calculated, as a lo-fold excess of AQC is needed. Two solvents were used for separation of AQC the derivatized amino acids. Solvent A consisted of 140 mM sodium acetate with 17 mM triethylamine, titrated to pH 5.05 with phosphoric acid. One mg of disodium EDTA 1-l was added. Solvent I3 was 60% acetonitrile in water (v/v). For separation of the AQC derivatives, a flow rate of 1 ml mini ’ and a temperature of 37°C was applied. The solvent gradient is shown in Table 1. Excitation and emission wavelengths were 250 and 395 nm, respectively. The 395 nm wavelength ensures a low signal for unreacted AQC reagent (peak eluting at about 12 min).
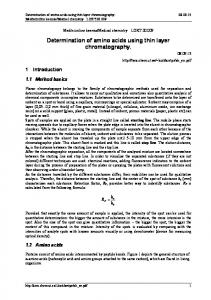
time for various proteins was suggested by Grimm (1992). DAPA and (r-ABA were used as internal standards in some of the analysis. For routine analysis of natural water samples, however, no internal standards were used to reduce the rise of contamination. Trace amounts of several amino acids typically are contained in analytical grade salts of individual amino acids. In addition, (Y-ABA regularly was found as a naturally occurring DCAA. Based on addition of the two internal standards, recoveries of the amino acids after hydrolysis were 96 + 5 (BSA) and 92 -t 7% (DCAA) (means + 1 SD, n = 5; derivatization with OPA). Recoveries of 7 free amino acids (asp, glu, gly, ala, val, leu and lys) after hydrolysis fell within the range obtained for DCAA (data not shown). The sample blank amino acid concentration was found to be highly dependent on the applied technique and the quality of the HCl used. The microwave vapor hydrolysis produced lower blanks than did the ampoule liquid phase hydrolysis, and pure grade HCl contained, as expected, less amino acids than analytical grade HCl (Fig. 2B). The blank DCAA concentrations ranged from 132 nM with vapor phase and pure grade HCl (corresponding to a mean of 0.2 pmol of each amino acid per injection) to 776 nM with liquid phase and analytical grade HCl (corresponding to a mean of 1.3 pmol of each amino acid per injection). Lower blank values were obtained with vapor phase than with liquid phase hydrolysis, whether pure or analytical grade HCl was used (paired t-test; p < 0.01 (pure grade), p < 0.05 (analytical grade)). The higher blanks by the liquid phase procedure may originate from handling of the ampoules, e.g., the NZ flushing, and fumes during the sealing of the ampoules. The measured variation of the blank amino acid content by the two hydrolysis procedures and the
3. Results and discussion 3.1. Comparison
of liquid and vapor phase hydroly-
sis 3.1.1.
Hydrolysis
time, recovery
of amino acids and
blanks
Optimum conditions for the microwave hydrolysis, i.e. the shortest possible hydrolysis time and minimum blank values, were determined by analysis of BSA and natural water samples. Two types of analytical grade HCl were compared. In the test of the HCl quality, the microwave vapor phase technique was related to the traditional ampoule liquid phase technique. Variation of the microwave hydrolysis time from 5 to 30 min demonstrated that a complete hydrolysis of BSA was obtained after 10 min, but for natural water samples a minimum of 15 min was required (Fig. 2A). A hydrolysis time of 20 min was subsequently used for all analyses. A similar hydrolysis
Table 1 Solvent composition
for amino acid analysis
Chemistry 57 (1997) 287-297
with AQC. The flow rate was
1 ml min- ’
Time (min)
0
0.5
15
19
32
33
34
37
38
50
%A %B
100 0
98 2
92.5 1.5
90 10
68 32
67 33
0 100
0 100
100 0
100 0
N.O.G. Jpgensen,
R.E. Jensen/Marine
two
291
Chemistry 57 (1997) 287-297
HCl (estimated by content of amino acids in the evaporated residue of HCl) as has previously been observed by Knecht and Chang (1986). The present sample blank concentrations are lower than those measured by Tsugita et al. (1987) during vapor phase hydrolysis, but they are higher than the extraordinary low blanks reported by Keil and Kirchman (1991). The sample blanks were only to a minor extent influenced by the derivatization procedure, as
qualities of HCl is illustrated in Fig. 2C. The amino acid composition of the pure grade/vapor phase and analytical grade/liquid phase samples indicates that the vapor and liquid phase blanks had different origins. Three amino acids were dominant in the ampoule hydrolysis blanks (asp, glu and gly), while a more homogeneous blank amino acid spectrum was obtained by the microwave hydrolysis. The amino acids appeared mainly to originate from the
1,60 1,40 1.20 1 ,oo 0.80 0,60 0,40 020 0,oo 10
15 Hydrolysis
C 200
f
20
time (min)
T
0 m
z
800
p
600
B
co
150
Liquid phase hydmlysls Microwave hydmlysls
2
5 r/l 0 2
‘$
400
Y : E 1 0 p
.j? 100 E m Y
200 0 i.
Pure grade HCI
Anal. grade HCI
5 a 50
0 ASP
GLU
SER
HIS
GLY
THR
ARG
ALA GABA VAL
PHE
ILE
LEU
ORN
LYS
Fig. 2. Hydrolysis of bovine serum albumin (BSA), seawater DCAA or sample blanks: (A) amino acid yields of BSA and DCAA vs. hydrolysis time with 100% microwave effect, (B) total amino acid blank concentrations by liquid and vapor phase hydrolysis with analytical or pure grade HCI, and (12) individual blank amino acids after analytical grade/liquid phase (white bars) and pure grade/vapor phase hydrolysis (black bars). The amino acids were derivatized with OPA, GABA = y-aminobutyric acid. Means k 1 SD (n = 3) shown.
292
N.O.G. J@rgensen, R.E. Jensen/Marine
total ‘system blanks’ (amino acids in derivatized Milli-Q 185 Plus water (UV exposed), Millipore, USA) typically were < 5 nM. The obtained 28 nM standard deviation of the microwave hydrolysis blanks implies that DCAA cannot be determined with a precision better than this value. However, since DCAA in natural waters in most cases have concentrations in excess of 1 PM, this analytical variation is acceptable. 3.1.2. Hydrolysis of natural water samples The ampoule and microwave techniques were compared by hydrolysis of different natural water samples. The spectra of individual DCAA obtained with the two procedures generally agreed well, but they were not always identical. As an illustration, DCAA in an estuarine water sample after liquid and vapor phase hydrolysis is shown in Fig. 3A. Total
600 700
5s
500
‘E
400
i
f
300
fu
200 I 600
20
Time(h)
Fig. 3. DCAA in natural water samples, hydrolyzed with liquid phase and microwave vapor phase hydrolysis. The amino acids were derivatized with OPA. (A) DCAA composition in estuarine water. Total amino acid concentrations ( + 1 SD shown: n = 3) are indicated. (B) Bacterial reduction of DCAA in triplicate batch cultures of coastal sea water, filtered through 0.8 pm filters and incubated in the laboratory for 43 h. Means+ 1 SD shown in all cases: n = 3. Concentrations of dissolved free amino acids (DFAA) were subtracted from all the DCAA concentrations.
Chemistry 57 (1997) 287-297
DCAA concentrations obtained with the two techniques were different: 2371 nM (ampoule) and 2649 nM (vapor phase) (paired t-test, p < 0.05). The DCAA spectra mainly varied with respect to asp, arg and val. No trends in differences of acidic, neutral and basic amino acids were obvious. A characteristic difference between the two methods was a lower relative standard deviation found by the microwave method (RSD of 4.3%) relative to the ampoule method (RSD of 8.5%). Microwave vapor phase hydrolysis produced higher total DCAA concentrations in some natural water samples than did liquid phase hydrolysis. In 8 of 15 seawater samples and in 5 of 8 freshwater samples it was found that the microwave vapor hydrolysis yielded up to 39 and 22% higher DCAA concentrations, respectively (data not shown). The potential significance of this underestimation is exemplified by concentration changes of DCAA due to bacterial utilization of amino acids in seawater batch cultures (Fig. 3B). Higher concentrations of DCAA were determined by vapor phase than by liquid phase hydrolysis until 30 h in the cultures (paired t-test, p < 0.01). The bacterial reduction of DCAA during this 30 h period was 2202 nM (vapor phase) and 1384 nM (liquid phase). Hence, using the liquid phase procedure, the DCAA uptake would be underestimated by 37%. From 30 to 43 h, when no DCAA uptake was found, similar concentrations of DCAA were measured with the two techniques (paired f-test, p > 0.1). The higher yield of DCAA by microwave vapor phase hydrolysis of some natural water samples probably was due to occurrence of amino acids that did not originate from proteins (although they could be typical protein amino acids), as hydrolysis of a pure protein produced a similar amino acid spectrum with either procedure (Fig. 4, discussed below). A higher DCAA yield of seawater samples by vapor phase hydrolysis, relative to liquid phase hydrolysis, previously has been observed by Keii and Kirchman (1991). These authors ascribed the effect to large molecules (> 100 KDa) with a high content of amino acids not associated with proteins and a reduced susceptibility to liquid phase hydrolysis. The present difference in bacterial utilization of DCAA determined by liquid and vapor phase hydrolysis (Fig. 3B) therefore may indicate that a portion of the
N.O.G. J#rgensen, R.E. Jensen/Marine
bacterial DCAA reduction was due to uptake of amino acids in large, non-protein molecules or organic complexes. DCAA in high-molecular (> 100 kDa) material previously have been found to support bacterial growth in lake water (Tranvik and Jorgensen, 1995). The high-molecular DCAA may include colloidal amino acids, as DCAA are abundant components of colloids in fresh and estuarine waters (Sigleo et al., 1983). The arrested bacterial DCAA uptake after 30 h (Fig. 3C) suggests that a fraction of the natural DCAA pool apparently was not available to bacterial degradation. Similar observations have been made in other studies (Keil and Kirchman, 1993; Kroer et al., 1994). A recalcitrant nature of a fraction of DCAA may explain why a residual DCAA pool always is found in natural waters (Coffin, 1989). Mechanisms that can reduce the biological utilization of amino acids and proteins include an abiotic modification (Keil and Kirchman, 19941, adsorption to mineral surfaces (Wang and Lee, 1993; Taylor et al., 19941, and lack of substrata to which bacteria can attach (Griffith and Fletcher, 1991). The significance of each of these complex processes shall not be dis-
293
Chemistry 57 (1997) 287-297
cussed here, but in order to relate DCAA turnover to total element cycling in natural waters, they must be considered. 3.2. Deriuatization and A&C
of hydrolyzed
DCAA with OPA
3.2.1. Comparison of BSA amino acid spectra, detection limits and DCAA in natural samples The most widely used derivatization procedure for HPLC analysis of amino acids probably is the OPA method (Lindroth and Mopper, 1979). OPA (ophthaldialdehyde) produces highly fluorescent derivatives that are easily separated by HPLC. Unfortunately, only primary amines react with OPA. This means that proline and other secondary amines typically are not included in determinations of DCAA. In 1993, Cohen et al. presented a new reagent, 6-aminoquinolyl-N-hydroxysuccinimidyl carbamat, or AQC, for derivatization of both primary and secondary amines. Before test of this reagent for measurements of DCAA in natural water samples, AQC was used for analysis of amino acids of a protein with a known
20
Bovine serum albumin / -5ZZ m
16
m
Exoected comoosition Liquid phase Hydrolysis (OPA) Microwave hydrolysis (OPA ) Microwave hydrolysis (AQC)
5 12 P :: a 10 E 8 7 8 0 6
ASP
GLU
SER
HIS
GLY
THR
ARG
ALA
TYR
MET
VAL
PHE
ILE
LEU
LYS
Fig. 4. Amino acid composition of bovine serum albumin determined after liquid and vapor phase hydrolysis with either OPA or AQC as the derivatization reagent. Expected amino acid composition from Cohen et al. (1993). Proline (pro) was not included (OPA does not react with proline). Injected amounts were 20 pg BSA (about 200 nmol amino acids). Means k 1 SD shown: n = 3.
294
N.O.G. J@ymw,
R.E. Jensen/Marine
amino acid composition, bovine serum albumin (BSA). BSA was hydrolyzed by the ampoule and the microwave techniques, after which the amino acids were quantified with OPA and AQC (Fig. 4). The HPLC analyses show that the amino acid composition closest to the expected composition (from Cohen et al., 1993) was obtained by microwave hydrolysis and AQC derivatization. The experimental variability of the published amino acid composition of BSA is unknown, but assuming a 10% standard deviation, a statistical analysis shows that the number of measured BSA amino acids falling outside the expected composition was 8 (liquid phase + OPA), 4 (microwave + OPA), and 3 (microwave + AQC) (paired t-test, p < 0.05). This indicates that the most reliable analysis of pure proteins is achieved by microwave hydrolysis and AQC derivatization. The rather deviating liquid phase + OPA data may have been influenced by the relatively high and variable blank DCAA level, as discussed previously. DCAA in microwave-hydrolyzed seawater samples were derivatized with AQC and OPA. HPLC chromatograms of an amino acid standard derivatized with AQC and an estuarine water sample derivatized with both AQC and OPA are shown in Fig. 5. The detection limit of the individual AQC amino acids was found to increase with the retention time. Thus, early eluting amino acids had a detection limit of 250 fmol (e.g., asp and ser), while the last eluting amino acids (e.g., ile, leu and phe) had a detection limit of 30 fmol, compared to an average detection limit of about 20 fmol of the OPA derivatives. The detection limit for AQC cannot be increased by injection of a larger sample volume, as the maximum injected volume should be restricted to about 60 ~1 to avoid a peak broadening. The amino acid composition of the estuarine water sample determined with AQC and OPA derivatization (Fig. 5) is shown in Fig. 6. The two amino acid spectra were different with respect to gly, ala, met and lys (paired f-test, p < 0.05), but the remaining amino acids were similar in concentration within a 5% limit (paired t-test). The total DCAA pools did not differ (OPA, 2097 * 161 nM; AQC, 2305 + 143 nM (not including proline)). The noticeable difference in methionine determined with the two procedures (a 2.5-fold higher methionine concentration was measured with AQC than with OPA derivatiza-
Chemistry 57 (1997) 287-297 AQC
AQC
(amino
(estuarine
Tme
OPA
(estuarine
acid standard)
water
sample)
(mln)
water
sample)
3 ”
I
T,me (“I”)
Fig. 5. HPLC chromatograms of: (A) amino acid standard derivatized with AQC (the individual amino acid concentration was 2 FM), (B) and (C) DCAA in an estuarine water sample, derivatized with AQC (B) or OPA CC). Amm = ammonium, GABA = y-aminobutyric acid. Injection volumes were 25 ~1 (AQC) and 20 ~1 (AQC). The chromatogram graphics software (Chrom Merge, Molnar-Institut, Germany) does not allow an indication of peak baselines.
tion) may be due to co-elution of methionine and an unknown natural amine in the sample. Proline made up 171 nM, or 7.4% of the DCAA derivatized with AQC. In the analyzed freshwater and seawater samples, proline varied from 6 to 24% of the amino acid concentrations. This indicates that measurements of DCAA with a procedure for only primary amines will underestimate natural amino acid concentrations
N.O.G. J@rgensen, R.E. Jensen/Marine
due to a lack of reaction with proline and other secondary amines. Published data on proline in sea water are few, but for dissolved free proline, concentrations of 5 to 186 nM in sea water have been reported (Hobbie et al., 1968; Billen et al., 1980). 3.2.2. Limitations to derivatization of hydrolyzed DCAA with A&C and OPA Derivatization with AQC appears advantageous to OPA for HPLC analysis of protein amino acids and of DCAA in natural waters, as both primary and secondary amines can be quantified with a greater accuracy. The high stability of the AQC derivatives means that reinjections and addition of internal standards can be carried out at intervals of several days. Shortcomings of the AQC procedure are a reduced sensitivity of the early eluting amino acids and a required modification of the solvent gradient if non-standard amino acids like taurine and omithine has to be determined. In addition, separation of histidine from NH,f in samples with a high NH: content (> about 20 PM) requires a pH modification of eluent A (change of pH from 5.05 to 5.80) or a l-2% increase of the gradient time. Alternatively, NH: can be removed before analysis (Burdige and
600
T
Chemistry 57 (1997) 287-297
Martens, 1990). The AQC derivatization includes addition of a buffer and a reagent mixture, followed by a 10 min heating. The heating step implies that the derivatization cannot be automated as easily as the OPA derivatization. If measurement of tyrosine is not required, the heating step can be omitted (the heating removes a tyrosine byproduct). For analysis of trace-level amounts of amino acids, e.g., dissolved free amino acids in oligotrophic sea waters, OPA is still the preferred derivatization reagent due to its high sensitivity, despite that only primary amines are detected. For analysis of BSA, we found that OPA derivatives in most cases indicated a higher glycine and a lower alanine concentration than did the AQC derivatives. Since AQC-glycine and AQC-alanine of BSA were identical to the expected proportion of the two amino acids, our data suggest that HPLC separation of OPA derivatives of glycine and alanine can be misleading. Spiking of the hydrolysates with glycine and alanine standards did not change this result. By manipulation of the chromatographic conditions, we occasionally observed an unknown peak beneath the glycine peak. If this peak typically covaries with glycine, an overestimated, apparent
I
0 m
ASP GLIJ SER
Microwave hydrolysis (AQC) Microwave hydrolysis (OPA)
IIn
n
HIS GLY THR ARG ALA TYR MET “AL
Fig. 6. DCAA composition of a sea water sample derivatized corrected for DFAA content.
295
PHE
ILE
LE”
LYS PRO
with OPA and AQC. Means + 1 SD; n = 3. All DCAA concentrations
were
296
N.O.G. J@gensen, R.E. Jensen /Marine
glycine peak (representing both glycine and the unknown compound) may have occurred in our measurements. For alanine, the derivatization yield may be reduced when a high amino acid concentration in a complex medium, like a protein hydrolysate, is present. The significance of these apparent artifacts should be considered when analyzing DCAA in natural water samples. Acid hydrolysis causes changes of the authentic amino acid composition of proteins and most likely of DCAA as well. Known changes include conversion of asparagine and glutamine to their acidic analogues (aspartic and glutamic acid) and a destruction of tryptophan. In liquid phase hydrolysis, a reduction of serine and threonine and partly of tyrosine has been found (Tsugita et al., 1987). These losses are reduced by vapor phase hydrolysis, probably due to the shorter heating period (Grimm, 1992). A high recovery of the three amino acids was supported by our microwave hydrolysis of BSA proteins. A reduced recovery of histidine during vapor phase hydrolysis reported by Keil and Kirchman (1991) was not observed in the present study. Like other available methods, the combined microwave vapor phase hydrolysis and AQC derivatization probably do not produce fully authentic amino acid spectra of DCAA in natural waters. Relative to other procedures for the determination of individual DCAA, however, the present method appears both simple and sufficiently sensitive for measuring DCAA, including proline, in many natural waters. Considering that DCAA are important intermediates in the cycling of both carbon and nitrogen in aquatic ecosystems (Coffin, 1989; Kroer et al., 19941, the knowledge on fluxes, sources, and biogeochemical significance of DCAA still is limited. The present procedure for analysis of DCAA may stimulate further research in this area.
4. Conclusions A microwave-assisted vapor phase procedure for hydrolysis of dissolved combined amino acids (DCAA) in natural water samples was tested. Relative to standard liquid phase ampoule hydrolysis, a reduced hydrolysis time (20 min), lower blanks and a higher reproducibility was achieved with the present
Chemistry 57 (1997) 287-297
procedure. The microwave vapor phase hydrolysis produced 22 to 39% higher DCAA concentrations in about half of the tested natural samples, than did the liquid phase hydrolysis. Quantification of the hydrolyzed, individual DCAA by HPLC after derivatization with OPA and a new reagent (AQC) for fluorescent tagging of both primary and secondary amines demonstrated a good agreement in DCAA concentrations (excluding proline), and that proline made up from 6 to 24% of the natural DCAA. Hence, derivatization of DCAA with a reagent for only primary amines may underestimate concentrations of DCAA in natural waters.
Acknowledgements The present study was supported by The Danish Strategic Environmental Program. We wish to thank Waters Associates, Denmark, and VEB Analytical for their help and interest in the project.
References Antia, N.J.. Harrison, P.J., Oliveira, L., 1991. The role of dissolved organic nitrogen in phytoplankton nutrition, cell hiology and ecology. Phycologia 30, 1-89. Billen, G., Joiris, C., Wijnant, J., Gillain, G., 1980. Concentrations and microbiological utilization of small organic molecules in the Scheldt estuary, the Belgian coastal zone of the North Sea and the English Channel. Estuar. Coast. Mar. Sci. I I, 219-294. Burdige, D.J.. Martens, C.S., 1990. Biogeochemical cycling in an organic-rich marine basin: 11. The role of amino acids in sedimentary carbon and nitrogen cycling. Geochim. Cosmochim. Acta 54, 3033-3052. Cohen, S.A., De Antonis, K., Michaud, D.P., 1993. Compositional protein analysis using 6-aminoquinolyl-N-hydroxysuccinimidyl carhamate, a novel derivatization reagent. In: Angeletti, R.H. (Ed.), Techniques in Protein Chemistry, IV. Academic Press, New York, pp. 289-298. Coffin, R.B., 1989. Bacterial uptake of dissolved free and combined amino acids in estuarine waters. Limnol. Oceanogr. 34, 531-542. Cowie, G.L.. Hedges, J.I., 1992. Improved amino acid quantification in environmental samples: charge-matche recovery standards and reduced analysis time. Mar. Chem. 37, 223-238. Degens, E.T., Reuter. J.H., Shaw, K.N.F., 1964. Biochemical compounds in offshore California sediments and sea waters. Geochim. Cosmochim. Acta 28, 45-66. Griffith, P.C., Fletcher, M., 1991. Hydrolysis of protein and
N.O.G. Jqtirgensen, R.E. Jensen/Marine model dipeptide substrates by attached and nonattached marine Pseudomonas sp. strain NCIMB 2021. Appl. Environ. Microbial. 57, 2186-2191. Grimm, R., 1992. Amino acid analysis of protein and peptide hydrolyzates - evaluation of accuracy. Hewlett Packard Application Note, Publ. 12-5091.4585E. Hobbie, J.E., Crawford, C.C., Webb, K.L., 1968. Amino acid flux in an estuary. Science (NY) 159, 1463-1464. Hubberten, U., Lara, R.J., Kattner, G., 1994. Amino acid composition of seawater and dissolved humic substances in the Greenland Sea. Mar. Chem. 45, 121-128. Jorgensen, N.O.G., Kroer, N., Cafeen, R.B., Yang, X.-H., Lede, C., 1993. Dissolved free amino acids, combined amino acids, and DNA as sources of carbon and nitrogen to marine bacteria. Mar. Ecol. Prog. Ser. 9, 135-148. Keil, R.G., Kirchman, D.L., 1991. Dissolved combined amino acids in marine waters as determined by a vapor-phase hydrolysis method. Mar. Chem. 33, 243-259. Keil, R.G., Kirchman, D.L., 1993. Dissolved combined amino acids in marine waters: chemical form and utilization by heterotrophic bacteria. Limnol. Oceanogr. 38, 1256-1270. Keil, R.G., Kirchman, D.L., 1994. Abiotic transformation of labile protein to refractory protein in sea water. Mar. Chem. 45, 187-196. Knecht, R., Chang, J.Y., 1986. Liquid chromatographic determination of amino acids after gas-phase hydrolysis and derivatization with (dimethylamino)azobenzenesulfonyl chlorid. Anal. Chem. 58, 2375-2379. Kroer, N., Jorgensen, N.O.G., Coffin, R.B., 1994. Utilization of dissolved nitrogen by heterotrophic bacterioplankton: A comparison of three ecosystems. Appl. Environ. Microbial. 60, 4116-4123. Lee, C., Bada, J.L., 1977. Dissolved amino acids in the equatorial Pacific, the Sargasso Sea, and Biscayne Bay. Limnol. Oceanogr. 22, 502-5 10. Lindroth, P., Mopper, K., 1979. High performance liquid chromatographic determinations of subpicomole amounts of amino
Chemistry 57 (1997) 287-297
291
acids by precolumn fluorescence derivatization with ophthaldialdehyde. Anal. Chem. 51, 1667-1674. Lookhart, G.L., Jones, B.L., Cooper, D.B., Hall, S.B., 1982. A method for hydrolyzing and determining the amino acid compositions of picomole quantities of proteins in less than three hours. J. Biochem. Biophys. Methods 7, 15-23. Moore, S., Stein, H., 1963. Chromatographic determination of amino acids by the use of automatic recording equipment. In: Colowick, S.P., Kaplan, N.O. (Eds.), Methods in Enzymology, vol. 6. Academic Press, New York, pp. 819-831. Parsons, T.R., Maita, Y., Lalli, C.M., 1984. A manual of chemical and biological methods for seawater analysis. Pergamon, Oxford, pp. 44-45. Sharp, J.H., 1983. The distribution of inorganic nitrogen and dissolved and particulate organic nitrogen in the sea. In: Carpenter, E.G., Capone, D.G. (Eds.), Nitrogen in the Marine Environment. Academic Press, New York, pp. l-35. Sigleo, A.C., Hare, P.E., Helz, G.R., 1983. The amino acid composition of estuarine colloidal material. Estuar. Coast. Shelf Sci. 17, 87-96. Taylor, G.T., Troy, P.J., Sharma, S.K., 1994. Protein adsorption from seawater onto solid substrata, I. Influences of substratum surface properties and protein concentrations. Mar. Chem. 45, 15-30. Tranvik, L., Jorgensen, N.O.G., 1995. Colloidal and dissolved organic matter in lake water: Carbohydrate and amino acid composition, and ability to support bacterial growth. Biogeochemistry 30, 77-97. Tsugita, A., Uchida, T., Mewes, H.W., Ataka, T., 1987. A rapid vapor-phase acid (hydrochloric acid and trifluoroacetic acid) hydrolysis of peptide and protein. J. B&hem. 102, 1593-1597. Wang, X.-C., Lee, C., 1993. Adsorption and desorption of aliphatic amines, amino acids and acetate by clay menerals and marine sediments. Mar. Chem. 44, l-23. Woodward, C., Gilman, L.B., Engelhart, W.G., 1990. An evaluation of microwave heating for the vapor phase hydrolysis of proteins. International Laboratory, September, pp. 40-46.