Feb 27, 2011 - As both tech- niques were ... ton helicities. In Eq. (1), ËGM, ËF2, ËF3 are .... data [13] at Q2 = 2.5 GeV2 does not allow to extract an ε-dependent ...
EPJ manuscript No. (will be inserted by the editor)
Determination of two-photon exchange amplitudes from elastic electron-proton scattering data Julia Guttmann1 , Nikolai Kivel1,2,3 , Mehdi Meziane4 , and Marc Vanderhaeghen1,2 1 2 3
arXiv:1012.0564v2 [hep-ph] 27 Feb 2011
4
¨ Kernphysik, Johannes Gutenberg-Universit¨at, D-55099 Mainz, Germany Institut fur Helmholtz Institut Mainz, Johannes Gutenberg-Universit¨at, D-55099 Mainz, Germany Petersburg Nuclear Physics Institute, Gatchina, St. Petersburg 188350, Russia Physics Department, College of William and Mary, Williamsburg, VA 23187, USA Received: date / Revised version: date Abstract. Using the available cross section and polarization data for elastic electron-proton scattering, we provide an extraction of the two-photon exchange amplitudes at a common value of four-momentum transfer, around Q2 = 2.5 GeV2 . This analysis also predicts the e+ p/e− p elastic scattering cross section ratio, which will be measured by forthcoming experiments. PACS. 25.30.Bf Elastic electron scattering – 13.40.Gp Electromagnetic form factors – 14.20.Dh Protons and neutrons
The electromagnetic form factors (FFs) of the nucleon q = k − k0 , and choose Q2 = −q2 and ν = K · P as the have been explored extensively during the last 50 years independent kinematical invariants. Neglecting the elecwith ever increasing accuracy. The tool to extract the elec- tron mass, the elastic ep scattering amplitude can be extromagnetic FFs is provided by the one-photon (1γ) ex- pressed through 3 independent structures [8] : change approximation to elastic electron-nucleon scattering. Precision measurements of the proton electric to magTh, λ0 λ N = (e2 /Q2 ) u¯ (k0 , h)γµ u(k, h) netic FF ratio at larger momentum transfers using poN � � larization experiments [1, 2, 3, 4] have revealed significant Pµ γ · KPµ + F˜3 u( p, λ N ), discrepancies in recent years with unpolarized experiments × u¯ ( p0 , λ0N ) G˜ M γµ − F˜2 M M2 using the Rosenbluth technique [5, 6, 7], when analyzing (1) both within the 1γ-exchange framework. As both techniques were scrutinized and their findings confirmed by different experimental groups and using different set-ups, with e the proton charge, M its mass, h = ±1/2 the elecit became clear that some other explanation was needed tron helicity and λ (λ0 ) the incoming (outgoing) proN N to explain the difference. It was proposed that two-photon ˜ M , F˜2 , F˜3 are complex functions ton helicities. In Eq. (1), G (2γ) exchange processes are the most likely explanation 2 we also use G˜ E ≡ G˜ M − of this difference [8, 9, 10]. Their study has received a lot of ν and Q . For convenience, 2 2 ˜ of attention lately, see [11] for a recent review (and refer- (1 + τ ) F2 , with τ ≡ Q /(2M ) . To separately identify the ences therein), and [12] for a global analysis of elastic ep 1γ- and 2γ-exchange contributions, we use the decomposition G˜ M = G M + δ G˜ M , and G˜ E = GE + δ G˜ E , where scattering including a model for the 2γ corrections. G M and GE are the usual proton magnetic and electric In recent years dedicated experiments were performed 2 to test the Rosenbluth method [7] and to measure the 2γ- FFs, which are functions of Q only and are defined from matrix elements of the electromagnetic current. The amcorrections to the polarization observables [13]. Using the ˜3 , δ G˜ M , and δ G˜ E , originate from processes inplitudes F theoretical framework to describe elastic ep scattering beyond the 1γ-approximation, as laid out in Ref. [8], both volving the exchange of at least two photons, and are of 2 experiments allow for the first time to provide an em- order e . When calculating observables beyond the 1γapproximation, it is convenient to express the real parts ( pirical determination of the 2γ-amplitudes at a common 2 2 R ) of the 2γ-amplitudes relative to the magnetic FF as : value of the momentum transfer, Q = 2.64 GeV . We extract the resulting 2γ-amplitudes in this work and pro� � vide predictions for forthcoming experiments. YM ≡ R δ G˜ M /G M , YE ≡ R δ G˜ E /G M , 0 0 � � To describe the process, l (k) + N ( p) → l (k ) + N ( p ), � Y3 ≡ ν/M2 R F˜3 /G M . (2) we adopt the definitions : P = ( p + p0 )/2, K = (k + k0 )/2,
2
J. Guttmann et al.: Determination of two-photon exchange amplitudes from elastic electron-proton scattering data
(3)
where ε is the virtual photon polarization parameter. The corresponding expression for the elastic e+ p → e+ p cross section is obtained by changing the sign in front of the 2γ-amplitudes in Eq. (3). In the 1γ-exchange (Born) approximation, the double polarization observables are given by : PlBorn
=
p
1 − ε2 (2h)
r PtBorn
=−
ε GE2 1+ τ G2M
! −1
ε GE2 2ε(1 − ε) (2h) 1 + τ τ G2M
, ! −1
(4) GE . (5) GM
Including 2γ-corrections, the polarization transfer ratio can be written as [8]: r τ (1 + ε) Pt G G − = E + YE − E YM 2ε Pl G GM �M � 2ε GE + 1− Y3 + O(e4 ). (6) 1 + ε GM
-μp
σR ε GE2 G = 1 + + 2 YM + 2ε E YE 2 2 τ GM τG M GM � � G + 2ε 1 + E Y3 + O(e4 ), τG M
τ(1+ε) Pt 2ε Pl
The reduced e− p → e− p cross section including the 2γ-corrections becomes [8]
fit GEp-2γ GEp-I
0.75
0.70
0.65 0
0.2
0.4
0.6
0.8
1.0
ε p
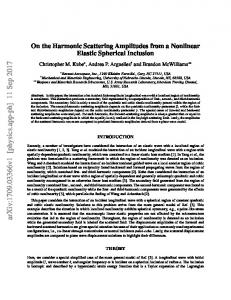
Fig. 1. The ratio −µ p τ (1 + ε)/(2ε) Pt /Pl as a function of ε for Q2 = 2.5 GeV2 . The data are from GEp-I (blue triangle) [1, 2], and GEp-2γ (red circles) [13] : the error bars (grey band) show the statistical (systematic) errors respectively. The solid curve is an ε-independent fit, given by Eq. (9).
p a fit of −µ p τ (1 + ε)/(2ε) Pt /Pl assuming an ε-independent part R, which in the 1γ-limit equals µ p GE /G M , with µ p = 2.793 the proton magnetic moment, supplemented with an ε-dependent part : r τ (1 + ε ) Pt /Pl = R + Bεc (1 − ε)d . (8) − µp 2ε
Using a range of values for c and d, we found that the value B of is zero within the present error, and the extracted values of R are all equal within their error bars. For Pl separately, its expression relative to the 1γ-result Therefore we conclude that the precision of the present of Eq. (4) is given by : data [13] at Q2 = 2.5 GeV2 does not allow to extract an ε-dependent part, in addition to the constant value ! −1 R. To extract the GE /G M ratio from the constant R, we ε GE2 Pl = 1 − 2ε 1 + are guided by the Regge limit assumption that the 2γ2 Born τ GM Pl correction to Pt /Pl vanishes for ε → 1. We therefore fit (" ! # Pt /Pl by its 1γ-value and obtain at Q2 = 2.5 GeV2 : GE2 ε GE × 1− + Y 3 1+ε τG M τG2M R = µ p GE /G M = 0.693 ± 0.006stat. ± 0.010syst. . (9) � �� GE GE + YE − YM + O(e4 ). (7) To determine the ε-dependence of Pl , we conventionτG M GM ally divide by PlBorn , which is calculated according to Eq. (4), We can make an estimate of the 2γ-amplitudes from the using the value of Eq. (9) for GE /G M . Furthermore, the recent data for the ε-dependence of Pt /Pl and Pl /PlBorn at 2γ-contribution to Pl is expected to be zero in both limits ε → 0 and ε → 1. A perturbative QCD calculation Q2 = 2.5 GeV2 , as measured by the JLab/Hall C experBorn − 1 → (1 − ε )1/2 iment [13], and combine them with the precision Rosen- (pQCD) [14, ?] gives as limits : Pl /Pl Born − 1 → ε2 for ε → 0. Although bluth measurements of σR performed at JLab/Hall A [7], for ε → 1, and Pl /Pl Born 2 2 do show a decrease for ε → 0, in where data exist at a similar value Q = 2.64 GeV . The the data for Pl /Pl combination of both experiments allows for the first time qualitative agreement with pQCD, the empirical fall-off to have three observables at a same Q2 value to extract at Q2 = 2.5 GeV2 is faster than the pQCD prediction. the ε-dependence of the three 2γ-amplitudes YM , YE , and Therefore, we fit the data for Pl /PlBorn using two different functional forms : Y3 , which are functions of both Q2 and ε. We start with the data for Pt /Pl as shown on Fig. 1. It Fit 1 : Pl /PlBorn = 1 + al ε4 (1 − ε)1/2 , is clearly seen how the data of the dedicated JLab/Hall C GEp-2γ experiment [13] improve on the precision of the Fit 2 : Pl /PlBorn = 1 + al ε ln(1 − ε) (1 − ε)1/2 . (10) pioneering GEp-I result [1, 2]. Within their error bars of order 1 %, the JLab/Hall C experiment does not see any The fit to the data yields : al = 0.11 ± 0.03stat. ± 0.06syst. systematic 2γ-effect on this observable. We effectively tried (Fit 1), and al = −0.032 ± 0.008stat. ± 0.020syst. (Fit 2).
fit 1+al ε ln(1-ε)(1-ε)1/2 fit 1+ al ε4(1-ε)1/2 GEp-2γ
1.02
3
1.25
σR / (μp GD)2
Pl / PBorn l
J. Guttmann et al.: Determination of two-photon exchange amplitudes from elastic electron-proton scattering data
1.00
1.20
1-γ
1.15
0.98 0
0.2
0.4
0.6
0.8
1.0
1.10
ε Fig. 2. The ratio Pl /PlBorn as a function of ε for Q2 = 2.5 GeV2 . The data points are from the GEp-2γ experiment (red circles) [13] : the error bars show the statistical errors, the grey band shows the systematic errors. The star indicates the ε-value at which the data have been normalized to the value 1. The curves are two fits described in Eq. (10) : Fit 1 (solid curve), Fit 2 (dashed curve).
0
0.2
0.4
0.6
0.8
1.0
ε Fig. 3. Rosenbluth plots for elastic e− p scattering: σR divided by µ2p /(1 + Q2 /0.71)4 at Q2 = 2.64 GeV2 . Solid curve : linear fit to the JLab/Hall A cross section data (circles) [7]. Dashed curve : 1γ-result, using the slope from the polarization data for GE /G M [1,2,3]. The grey band shows the systematic errors.
We next fit the JLab/Hall A Rosenbluth measurements of σR [7], shown on Fig. 3 for Q2 = 2.64 GeV2 . The σR data show the result of this analysis for the 2γ amplitudes, toshow a linear behavior in ε, suggesting the fit : gether with their 1σ error bands. One sees from Fig. 4 that the amplitude which is best constrained by the available 2 σR /(µ p GD ) = a + b ε, (11) data is YM . This is because the amplitude YM is mainly where we follow the convention to factor out the dipole driven by the 2γ-effect in the cross section data, Eq. (3), 2γ FF GD ≡ 1/(1 + Q2 /0.71GeV2 )2 . The fit to the data in which to good approximation is given by : σR ∼ YM + ε Y3 . One notices that the error bands on YM resulting Fig. 3 yields : a = 1.106 ± 0.006 and b = 0.160 ± 0.009. from the two different fits of Eq. (10) for Pl largely overTo extract the three 2γ-amplitudes as well as GE /G M lap. Except in the large ε region, the dominance of YM by 2 and G M from the above three observables at a same Q the Rosenbluth data results in its approximate linear rise value we have to make two assumptions. The first asin ε. For ε → 1, YM has to become non-linear provided sumption was made in Eq. (8), where the ε-independent YM + ε Y3 remains linear in the limit ε → 1, which we as2 term R fixes GE /G M , see Eq. (9). To fix the value of G M , sumed in our present analysis. How far the linearity of we make the assumption, that for ε → 1 (Regge limit) the the Rosenbluth plot extends when approaching ε → 1 2γ-correction to σR vanishes, i.e. σR (ε = 1, Q2 ) = G2M + is of course an open question, which will be addressed GE2 /τ. Using the GE /G M value extracted from the fit to by the results of a dedicated experiment [16]. In contrast Pt /Pl , and the fitted values of a and b entering Eq. (11), to YM , the amplitudes YE and Y3 are mainly driven by then allows to extract the value of G2M as : the polarization data. One sees from Fig. 4 that the error bands overlap in the range (ε > 0.6) where data exist for � � GM 2 a+b all three observables. In the smaller ε range, where there = . (12) is no constraint from the polarization data, one sees clear µ p GD 1 + (1/τ )( GE /G M )2 deviations between the two different functional forms for 2 2 the ε-dependence. We checked that the same conclusion For Q = 2.64 GeV , our fit yields : is reached for other forms. One further notices that in the � � region constrained by the polarization data, the ampliGM 2 = 1.168 ± 0.010. (13) tudes YE and Y3 are at the 2-3 % level and have opposite µ p GD signs. This can be easily understood from Eq. (6) when Having specified in Eqs. (3, 6, 7) the fits of the ob- neglecting the small terms in the 2γ-amplitudes which servables Pt /Pl , Pl /PlBorn , and σR , we next proceed to ex- are multiplied by GE /G M . The leading 2γ-correction to tract the 2γ-amplitudes YM , YE , and Y3 . The data allow Pt /Pl is to very good approximation proportional to YE + Y3 . The absence of 2γ-corrections in the data for Pt /Pl us to perform this analysis at a common value of Q2 = then implies YE and Y3 being of equal magnitude and of 2 2.64 GeV , where we neglect the small difference in Pt /Pl opposite sign. Furthermore, the value of Y is nearly en3 and Pl /PlBorn between their values at Q2 = 2.64 GeV2 tirely driven by the data for Pl . One indeed obtains from and their measured values at Q2 = 2.5 GeV2 . In Fig. 4, we Eq. (7), when again neglecting the small GE /G M terms,
J. Guttmann et al.: Determination of two-photon exchange amplitudes from elastic electron-proton scattering data
4
data, we therefore assumed that Pt /Pl can be fitted by its 1γ-value proportional to GE /G M as extracted in [1, 2, 3]. We see from Fig. 5 that, for a fixed value of ε, the extracted ratio Re+ e− increases with Q2 .
0.02
YM
0
Q2 = 4.10 GeV2
1.25
−0.02
1.20
Re+ e-
−0.04 0.04
YE
0.02
1.15
Q2 = 2.64 GeV2
1.10
0
1.05
−0.02
1.00
Y3
−0.04 −0.06
Q2 = 3.20 GeV2
0
0
0.2
0.4
0.6
0.8
1.0
! 0.2
0.4
0.6
0.8
1.0
Fig. 5. Predictions for the e+ p/e− p elastic cross section ratio Re+ e− as a function of ε, together with their 1σ error bands.
ε Fig. 4. The extracted 2γ-amplitudes as a function of ε for Q2 = 2.64 GeV2 for the two fits of Pl in Eq. (10), with their 1σ statistical error bands. Fit 1 : grey bands; Fit 2 : red bands. The horizontal bands at the bottom of the plots indicate the systematic errors.
2γ
Pl ' −2ε2 /(1 + ε) Y3 , therefore determining Y3 . To improve on the extraction of YE and Y3 will require a further improvement in precision of the polarization experiments. We next discuss the ratio Re+ e− of e+ p/e− p elastic scattering cross sections. The e+ p elastic scattering observables are obtained from the ones for e− p by merely changing the sign in front of the 2γ-amplitudes. A measurement of the ratio Re+ e− therefore provides a test of the 2γ-amplitudes and is planned in the near future by several experiments [17, 18, 19]. In particular, the Olympus Collaboration at DESY plans to measure the e+ /e− ratio for a value Q2 ' 2.5 GeV2 [19]. Our extraction of the 2γ-amplitudes at Q2 = 2.64 GeV2 allows to predict the ratio Re+ e− , which is shown in Fig. 5, using Fit 1 in Eq. (10). We notice that for Q2 = 2.64 GeV2 , Re+ e− rises linearly to small ε, reaching Re+ e− = 1.053 ± 0.004 for ε = 0.5. In Fig. 5, we also show results for the two other values of Q2 where the JLab high-precision Rosenbluth experiment [7] has taken data. At these higher values of Q2 , a systematic measurement of the ε-dependence of the polarization observables has not yet been performed. For our analysis of the Q2 = 3.2 GeV2 and Q2 = 4.1 GeV2
Summarizing, in this work we provided a first combined analysis of high precision Rosenbluth data for elastic electron-proton scattering and recent measurements of the 2γ-corrections to the polarization observables. As both experiments were performed at a similar Q2 value, we were able to perform an extraction of the three 2γamplitudes at Q2 = 2.64 GeV2 using empirical results for three observables and assuming that for ε → 1 (Regge limit) the 2γ-amplitudes vanish. We found that one amplitude (YM ) can be reliably extracted from the correction on the unpolarized cross section. The other two amplitudes are at the 2-3 % level and of opposite sign, partially cancelling each other in the polarization transfer ratio. Our extraction allowed us to provide a prediction of the e+ p/e− p elastic cross section ratio, for which dedicated measurements by the Olympus@DESY experiment are underway. Over the measured range of this experiment, the 2γ-corrections to the e+ p/e− p elastic cross section ratio are predicted to vary in the 1 - 6 % range.
Acknowledgments The work of J.G. was supported by the Research Centre “Elementarkraefte und Mathematische Grundlagen” at the University Mainz. The authors like to thank J. Arrington, R. Milner, L. Pentchev, and C. Perdrisat for helpful communications and discussions.
J. Guttmann et al.: Determination of two-photon exchange amplitudes from elastic electron-proton scattering data
References 1. M. K. Jones et al. [Jefferson Lab Hall A Collaboration], Phys. Rev. Lett. 84, 1398 (2000). 2. V. Punjabi et al., Phys. Rev. C 71, 055202 (2005) [Erratumibid. C 71:069902 (2005)]. 3. O. Gayou et al. [Jefferson Lab Hall A Collaboration], Phys. Rev. Lett. 88, 092301 (2002). 4. A. Puckett et al., Phys. Rev. Lett. 104, 242301 (2010). 5. L. Andivahis et al., Phys. Rev. D 50, 5491 (1994). 6. M. E. Christy et al. [E94110 Collaboration], Phys. Rev. C 70, 015206 (2004). 7. I. A. Qattan et al. Phys. Rev. Lett. 94, 142301 (2005). 8. P. A. M. Guichon and M. Vanderhaeghen, Phys. Rev. Lett. 91, 142303 (2003). 9. P. G. Blunden, W. Melnitchouk and J. A. Tjon, Phys. Rev. Lett. 91, 142304 (2003). 10. Y.C. Chen, A. Afanasev, S.J. Brodsky, C.E. Carlson and M. Vanderhaeghen, Phys. Rev. Lett. 93, 122301 (2004). 11. C. E. Carlson and M. Vanderhaeghen, Ann. Rev. Nucl. Part. Sci. 57, 171 (2007). 12. J. Arrington, W. Melnitchouk and J. A. Tjon, Phys. Rev. C 76, 035205 (2007). 13. M. Meziane et al., arXiv:1012.0339 [nucl-ex]. 14. D. Borisyuk and A. Kobushkin, Phys. Rev. D 79, 034001 (2009). 15. N. Kivel and M. Vanderhaeghen, Phys. Rev. Lett. 103, 092004 (2009). 16. JLab experiment E-05-017, spokesperson J. Arrington. 17. J. Arrington et al., arXiv:nucl-ex/0408020. 18. JLab/CLAS experiment E-07-005. 19. Proposal at DESY [Olympus Collaboration], (2008).
5