Determining a Checkout Register Opening Policy to Maximize Profit In convenience Stores Chains E. Ruelas-Gonzalez*1, J. Limon-Robles2, N. Smith-Cornejo3 1
ITESM Campus Monterrey, Center for Quality and Manufacturing. CIAP 6th floor. 2501 Eugenio Garza Sada South Av., Monterrey, Nuevo León. Mexico. 64849. Phone: 8358.2000, 83581400. Ext. 5197. *
[email protected]. 2 ITESM Campus Monterrey. Engineering School. CIAP 6th floor. 2501 Eugenio Garza Sada South Av. Monterrey, Nuevo León. Mexico. 64849. 2 ITESM, Campus Monterrey. Engineering School. CEDES 4th floor. 2501 Eugenio Garza Sada South Av. Monterrey, Nuevo León, Mexico. CP. 64849. ABSTRACT A major concern for convenience store managers is lost sales due to balking. Convenience stores customers pay high margins expecting fast service. If waiting lines are too long for their tolerance level at their arrival, they balk and the sale is lost as a result. In order to reduce lost sales, the length of the waiting line is usually controlled by opening additional checkout registers when the number of customers standing in the line exceeds a specified number and maintaining them open until they are no longer needed . This paper presents an applied approach to model the probability that customers actually enter the store and define the optimal opening level ( -policy) of the second checkout register based on several factors including the particular waiting line length tolerance level of usual customers, the average hourly arrival rate of customers to the store and the average gain per customer transaction. Several performance measures are computed. The total expected cost function per unit time is proposed to determine the optimal operating -policy at minimum cost. The model is applied in a real case of a convenience store chain. Keywords: Convenience store, balking process, customer service model, queuing control, removable servers, Npolicy. RESUMEN Uno de los mayores retos que enfrentan los administradores de las tiendas de conveniencia o servicio rápido es la pérdida de clientes debida al fenómeno conocido como “balking”. Los clientes pagan altos costos en éste tipo de tiendas esperando un servicio rápido así que su tolerancia a la espera no es muy alta. El “balking” se presenta cuando un cliente decide no llevar a cabo la compra del producto o servicio porque considera que la fila de espera, a su llegada, es demasiado larga para su tiempo disponible y paciencia. Con la finalidad de reducir las ventas perdidas, la fila de espera es controlada abriendo cajas adicionales cuando ésta excede un número determinado de clientes. La caja se mantiene abierta hasta que ya no hay más clientes esperando. Este artículo presenta una metodología aplicada para modelar la probabilidad de que el cliente decida ingresar a la línea de espera para pagar y así mismo, define la política de apertura óptima de la segunda caja ( -policy) basada en diversos factores incluyendo la tolerancia específica de los clientes típicos de éste tipo de servicios, la tasa promedio de llegadas por hora a la tienda y la ganancia promedio por venta al cliente. Se calculan varias medidas de desempeño y adicionalmente una función del costo total esperado es propuesta para determinar la política óptima de operación al mínimo costo. El modelo se aplica a una cadena de tiendas de conveniencia mexicana con gran presencia en el norte del país.
1. Introduction A major concern for service industries is lost sales due to balking or reneging of impatient customers. Balking is the phenomenon that occurs when a potential customer decides not to enter the waiting line because he/she considers it is too long.
406
Vol.8 No.3 December 2010
Reneging occurs when a customer decides to leave the waiting line after entering because the waiting time has exceeded his/her tolerance level. Pazgal & Radas (2008) made an empirical study to compare balking and reneging behavior. They
Determining a Checkout Register Opening Policy to Maximize Profit In convenience Stores Chains, E. Ruelas‐Gonzalez et al., 406‐415
A common approach in convenience stores is to have more checkout registers available to open when the waiting line is too long. This measure reduces lost sales but requires more personnel to operate the additional checkout registers, thus increasing labor cost. The problem is to find the checkout register opening policy that reduces the total cost: the cost of making the customer wait plus the cost of providing the service (Budnick, 1977), (Fitzsimmons, 1982), (Davis, 1991).
that includes the cost of waiting and the cost of switching the number of servers. They first introduced the concept of an -policy which turns the server on when ( ≥ 1) or more customers are present and turns the server off when no more customers are waiting for service. Steady-state probabilities and some performance measures were derived. Gebhard (1967) considers two particular service-rate-switching policies, assuming a Poisson input and exponential service times. The first policy is a single level control and the second one, a bilevel hysteretic control. The bilevel hysteretic control is stated as follows: when the system size reaches a level of from below, use , rate , and when the system size drops to switch to . He compares both policies for specific cost functions that include service and waiting line costs. Heyman (1968) analyzes an M/G/1 system with removable server under several discount cost over time. Sobel (1969) generalizes it to G/G/1. Several authors, Bell (1979), Boots and Tijms (1999), Feinberg and Kella (2002) and Wang (2003) present more queue control strategies based on similar cost functions.
This decision could appear simple and there exists several models to address this problem in literature based on a small set of variables such as average arrival rate and predefined balking models, among others. However, in a practical case, the convenience store manager must consider many other elements in order to find the right policy. These elements include the particular waiting tolerance of the usual customers in the area, the behavior of the arrival rate during the day, the average labor cost, and the average profit per transaction in the store.
Other authors model customer impatience including balking or reneging models. Naor (1969) and Hassin (1986) present a model with balking in which customers will join the waiting line only if its length is less than a fixed constant that depends on the system utilizations factor, the reward obtained upon completion of service and the customer waiting cost. Van Tits (1979) assumes that the probability that a customer enters the waiting line when there are customers in it is = 1/( + 1) .
found, that when the waiting it line length is observable as is the case in convenience stores, very few participants renege and most participants balk when line is longer than some critical length determined by the customer. Lost sales due to balking can be very high, for example, a 1% balking rate in a drive-through of a fast food restaurant can reduce the net income around $100 million dollars per year (Jones, 1999). Due to this, it is very important to develop efficient methods that allow estimating and reducing lost sales caused by balking.
In this paper we address this problem from the perspective of the manager of a real convenience store chain with hundreds of stores. Given that an average increase of a single dollar per hour per store can represent a profit of millions of dollars for the company, the focus is on finding a practical, precise and effective approach to find the best policy to manage the checkout registers. 2. Related literature Several authors model customer impatience introducing cost functions rather than balking. Yadin and Naor (1963) consider a cost function
Gross and Harris (1985) analyze M/M/m queuing systems with balking assuming a general balking probability function (1 − ) when there are customers in a single line. Some common models are summarized. One for staying probability model assumes a common balking level K for all customers as assumed in M/M/1/K model; however, “rarely do all customers have the same discouragement limit all the time” (Gross, 1985). Other models take the form of monotonically decreasing functions on the waiting line length as ⁄ and . They also 1⁄( + 1), 1⁄( + 1) < . present the ( , , , ) policy, where , a When the length of the waiting line reaches
Journal of Applied Research and Technology
407
Determining a Checkout Register Opening Policy to Maximize Profit In convenience Stores Chains, E. Ruelas‐Gonzalez et al., 406‐415
shift from to line falls to level
servers is done. When the waiting , we shift back to .
Bae, Kim & Lee(2001) model balking assuming that a customer enters only if the expected waiting time is less than a fixed bound, common to all customers. Wang & Chang (2002) propose a staying probability that depends on system utilization and the number of customers waiting. The aim of this article is to present a new model for balking probabilities that can be fitted to the particular impatience characteristics of the customers of a convenience store and can be used to model the waiting line behavior. It is used to estimate the expected loss profit per balking and determine the policy to open checkout registers that minimizes the total cost under the practical environment found in real convenience stores, including the changes in the demand rate during the day and the particular impatience model for its customers. 3. System Description Consider a convenience store. Let = ; ≥0 be the customer arrival process. Customers usually arrive one at the time. When more than one customer arrives at the same time, we assume that only one pays and we count them as a single arrival. There are so many different customers that we can assume that arrival times are independent; therefore, we can assume that the mapping ⟶ ( ) has jumps of unit magnitude for almost all , and that for any , ≥ 0, − is ; ≤ . Due to the above, it independent of can be assumed that the arrival process is a NonStationary Poisson Process (Cinlar, 1975). The customer arrival rate changes during the day. If, for modeling purposes, we split the day in short enough time intervals, we can assume that the rate is constant within each interval. Without loss of generality, we will assume intervals of one hour. Let denote the arrival rate of customers during hour ℎ . The service time of a customer in each checkout register is assumed to be exponential with media = 1⁄ . Also, we define , then service rate is the System Utilization assuming one checkout register opens as = ⁄ . Each customer that
408
Vol.8 No.3 December 2010
enters the system (convenience store) observes the waiting line and based on its size, decides whether or not to enter. If the customer decides not to enter (balks), the sale is lost. The waiting line length at which a customer balks depends on his/her particular tolerance level to waiting. Let ( ) denote the staying probability, the probability that a customer does not balk and enters the convenience store when the number of customers in the waiting line is . The behavior of ( ) varies among stores depending on the tolerance level to waiting of the usual customers and the proximity of another convenience stores. To reduce lost sales, the convenience store has two checkout registers and at least two employees. One of the checkout registers is permanently opened and operated by one employee with service rate . A second employee does product replenishment, cleaning and complementary tasks during low demand periods and opens and operates the second checkout counter when the number of customers in waiting line , reaches certain level which we will call the opening level . The second checkout register remains open until it is no longer needed, when = 1 . If the opening level for the second checkout register is low, the customer service level will be higher but the presence of the operator at the second checkout counter will be required more frequently, reducing the time available for complementary tasks. This may eventually require more employees, increasing the cost. On the other hand, if the opening level for the second checkout register is high, the labor cost of this checkout register will be reduced but the service level will also be reduced. As a consequence, lost sales due to balking would increase. The objective is to determine the optimal opening level ∗ for the second checkout register in order to minimize the total cost (lost sales plus labor cost). 4. Modeling balking behavior A sampling study was performed to obtain empirical data about balking behavior. Models found in reviewing literature did not fit well to the observed data. Empirical values of ( ) could be used if there were enough information. However, the
Determining a Checkout Register Opening Policy to Maximize Profit In convenience Stores Chains, E. Ruelas‐Gonzalez et al., 406‐415
sample size needs to be quite large in order to observe the monotone decreasing values that are expected. A mathematical function that could be adjusted to fit the observed behavior was proposed and the parameters of the model were obtained to validate the goodness of fit. Let denote the probability that a customer enters the store when the average . number of customers per checkout register is The proposed model is =
=
(1)
Where and are parameters of the model that provide flexibility to fit the empirical data. is the indifference level, the waiting line length per checkout register at which the probability to enter or balk is equal (Observe that when = , the probability of staying is equal to 0.5). is the model parameter that adjusts the rate of probability of declining close to .
Let ( ) be the observed staying probability when the waiting line length per checkout counter is = and be the number of observations used to compute ( ). Let = ( , ) denote a set of model parameters, and ( , ) the probability predicted by the model. We define the Weighted Sum of Square Errors as ( ) = ∑∞
( )− ( , )
∙
(2)
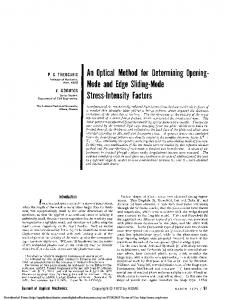
Where the ∗ = ( , ) that minimizes can be obtained using a numerical fitting algorithm. To validate the adequacy of the model, a real convenience store was sampled. At the time of each arrival, the decision of the customer (staying or balking), the number of checkout registers open, and the number of customers waiting in line was recorded. The parameters that minimize were obtained: N 9.46 y 4.78 . Figure 2 compares the observed and predicted probability. The number of observations for the highest values of the waiting line length was small because during the observed period the waiting lines rarely reached those values. This explains the high variability in the last values.
Figure 1. Staying Probability Model.
Journal of Applied Research and Technology
409
Determining a Checkout Register Opening Policy to Maximize Profit In convenience Stores Chains, E. Ruelas‐Gonzalez et al., 406‐415
Figure 2. Observed and Predicted Staying Probability
5. Modeling Waiting line Dynamics An approach based on Markov process analysis was used to model the waiting line dynamics. We define the following random variables as follows: = occupancy (number of customers waiting in line at checkout register one) during instant , ∀ ∈ = number of checkout registers opened at instant , ∀ ∈
,
=
Customer enters the system =1 +1 (3)
Vol.8 No.3 December 2010
=
We suppose that the arrival process can be approximated as a Poisson process with arrival rates constant per interval. We define the , , ∀ ∈ . Given stochastic process as = that the arrival stream is assumed Poisson and service times are assumed exponentially distributed, the process is a Markov Process.
Figure 3. Observed and Predicted Staying Probability.
410
= ,
Determining a Checkout Register Opening Policy to Maximize Profit In convenience Stores Chains, E. Ruelas‐Gonzalez et al., 406‐415
Figure 3 presents the transition diagram of the process during hour ℎ. The circles represent the , among which the process can states evolve and the values in the arches represent the rates at which the process “jumps” between one state and another. Observe that the effective arrival rate when the state of the system is ( , ) is = , and 1− , represents the dropout rate. We define as the maximum amount of customers that the system can handle and as the service rate of a single checkout register (customers per hour).
Let be the expected number of checkout register open during hour ℎ,
This system can be analyzed using standard represents the Markov Processes results. Generator Matrix of the Process. Define as the steady-state probability distribution of the process at hour ℎ. Then can be obtained solving the following system:
The total cost to run the store during hour ℎ would be the sum of the cashiers cost plus the lost profit, then,
=0 ∑
(4)
( )=1
∈
(5)
6. Performance Measures The steady-state probability distribution of the is used to process at hour ℎ defined as compute several performance measures: Expected value of lost sales, cashier cost and optimal ∗ ( ). opening level function When the system is in state ( , ), the probability that a customer enters the system is ( , ). Then, the probability of losing a customer is 1 − ( , ). represent the probability of losing a Let customer arriving during hour ℎ . Then, = ∑∀( ,
)∈
( , ) 1− ( , )
(6)
Given that is the average unitary gain per customer, the expected profit lost per customer balking during hour ℎ is Ε
=
Lost Profit in hour ℎ =
(7)
= 1 ∑∀
( , 1) + 2 ∑∀
( , 2)
(8)
be the labor cost per employee working Let hour. The cost of operating the checkout registers during hour ℎ is =
Cashiers Cost in hour h = (9)
Ε
= Ε
ℎ = Ε
+
(10) Both costs depend on the opening level of the second checkout register but the effects are in opposite directions. Increasing increases the average lost profit but decreases the required number of cashiers. Decreasing decreases the average lost profit but increases the average number of cashiers required. It is necessary to determine the optimal opening level ∗ that minimizes the expected value of the total cost. In order to obtain this value for hour ℎ, Ε is obtained for several values of and the value that minimizes the total cost is optimal value ∗ . In order to avoid computing the optimal ∗ value for each particular case, it is better to compute function ∗ ( ) that maps utilization to the optimal ∗ value. Then, in each particular case (one specific hour in one specific store in which the staying probability model applies) all that is = ⁄ and necessary is to compute utilization ∗ value from function to identify the optimal ∗ ( ). A typical plot of this function is shown in figure 9. It is based on data from the case study presented in the next section. In practice, choosing different opening levels for each hour could be complicated to manage. In this
Journal of Applied Research and Technology
411
Determining a Checkout Register Opening Policy to Maximize Profit In convenience Stores Chains, E. Ruelas‐Gonzalez et al., 406‐415
case, an alternative approach is to choose a single level for the day (selecting the value that minimizes the total cost per day) or use one level per shift during the day and a different level at night according to the arrival rates in each period. 7. Results of the practical case study
arrival rate changes with the day and hour of the = ⁄ . day. It affects the utilization per hour Now, we will analyze the behavior of the performance indexes for several values. We assume an average sale of 2.50 dollars and a unitary gain of 1.00 dollars per sale. We suppose is 2.50 dollars per hour. also that labor cost
The proposed approach was implemented in a real convenience store in Mexico using a computational code specially designed for this purpose. The
Figure 4 presents the total cost per hour per store (sum of labor cost plus sale loss) for different values of the opening level N of the second checkout register and different utilization values.
Figure 4. Total cost per hour.
Observe that the curve of minimum cost depends on the utilization. The optimal value is shown in figure 5.
Utilization
Figure 5. Optimal opening level for second checkout register.
412
Vol.8 No.3 December 2010
Determining a Checkout Register Opening Policy to Maximize Profit In convenience Stores Chains, E. Ruelas‐Gonzalez et al., 406‐415
For utilization levels close to 2 or higher, we suggest analyzing the incorporation of a third checkout register in the model. It is not considered at this point. These results are valid under the cost relationship established and for the staying probability considered. Figure 6 matches optimal opening level ∗ (shown on the right side of the plot) with the transactions per hour during the week in a real store. A detailed policy could be to use the opening level indicated in Figure 6 for each hour. In practice, the store manager could decide to use a simpler policy that uses the same value for longer periods of time, for example: •During the first two shifts, between 6:00 a.m. and 10:00 p.m., use = 4, except from 6:00 to 8:00, from Monday to Friday, where = 2 should be used due to the recurring peak. It is suggested to perform cleaning and replenishment activities before this hour in order to have available both checkout registers (cashiers) available at peak hours. •Between 10:00 p.m. and 6:00 a.m., use
= 6.
8. Conclusions and managerial implications The approach proposed in this paper has been developed from the perspective of the manager of a convenience store chain with hundreds of stores.
Given that a single dollar in lost sales per hour can represent millions of dollars for the company, the focus has been more in precision and practical applicability rather than on simplicity. The mathematical function proposed to model the probability that a customer actually enters the system approximates the observed staying probabilities in real cases in best way than other models found in literature. The proposed approach behavior of the system performance measures determining the optimal second checkout register for a specific hour.
to predict the dynamic allows estimating key of the system and opening value of the for a convenience store
The model is also used to model the dynamic behavior of the system for different values of the opening level and different levels of utilization. It allows estimating the lost sales, the number of checkout registers required, and the total cost for different combinations of values and levels of utilization . The model is used to decide the best practical policy to open a second checkout register throughout the entire week. The model can also be easily extended to more checkout registers. Finally, a practical case was presented to demonstrate the applicability of the model.
Figure 6. Number of transactions per week in a typical week.
Journal of Applied Research and Technology
413
Determining a Checkout Register Opening Policy to Maximize Profit In convenience Stores Chains, E. Ruelas‐Gonzalez et al., 406‐415
References [1] J. Bae and S. Kim. Average cost under the plambda,tau(m) policy in a finite dam with compound poisson inputs. Journal of Applied Probability, 40:519.526, 2003. [2] C.E. Bell. Characterization and computation of optimal policies for operating an m/g/1 queueing systems with removable server. Operations Research, 19:208.218, 1971.
[15] A.R. Pazgal. Comparison of customer balking and reneging behavior to queueing theory predictions: An experimental study. Computers and Operations Research, 35:2537.2548, 2008. [16] M. Sobel. Optimal average-cost policy for a queue with start-up and shut-down costs. Operations Research, 17:145.162, 1969. [17] M. Van Tits. Simulation of a queueing problem with balking. ACM SIGSIM Simulation Digest, 11:58.64, 1979.
[3] K. Boots and H. Tijms. A multiserver queueing system with impatient customers. Management Science, 49:444.448, 1999.
[18] K. Wang and Y. Chang. Cost analysis of a finite m/m/r queueing system with balking, reneging and server breakdowns. Mathematical Methods of Operations Research, 56:169.180, 2002.
[4] F. Budnick and R. Mojena. Principles of operations research for management. Richard D. Irwin, Inc., Homewood, IL., 1977.
[19] K. Y. Wang. Optimal control of an m/hk/1 queueing system with a removable server. Mathematical Methods of Operations Research, 57:255.262, 2003.
[5] Erhan Çinlar. Introduction to Stochastic Processes. Prentice-Hall, Inc., Englewood Cli¤s, N.J., 1975.
[20] M.N. Yadin. Queueing systems with a removable service station. Opl Res Q, 14:393.405, 1963.
[6] M. Davis. How long should a customer wait for service? Decision Sciences, 22:421, 1991. [7] E. Feinberg and O. Kella. Optimality of d-policies for an m/g/1 queue with a removable server. Queueing Systems, 42:355.376, 2002.
Acknowledgments This research and divulgation has been supported by ITESM Campus Monterrey Research Fund CAT128.
[8] J. S. Fitzsimmons. Service Operations Management. McGraw Hill Co., New York, 1982. [9] R. Gebhard. A queueing process with bilevel hysteretic service-rate control. Nav. Res. Log. Quart, 14:55.68, 1967. [10] D. Gross and Carl M. Harris. Fundamentals of Queueing Theory. Wiley Series in Probability and Mathematical Statistics. John Wiley & Sons, Inc., second edition, 1985. [11] R. Hassin. Consumer information in markets with random product quality: The case of queues and balking. Econometrica, 54:1185.1195, 1986. [12] D.P. Heyman. Optimal operating policies for m/g/1 queueing systems. Operation Research, 16:362.382, 1968. [13] L.K. Jones. Inferring balking behavior from transactional data. Operations Research, 47:778, 1999. [14] P. Naor. The regulation of queue size by levying tolls. Econometrica, 37:15.24, 1969.
414
Vol.8 No.3 December 2010
Digitally Controlled Integrated Electronic Ballast with Dimming and Power Factor Correction Features, C. Aguilar‐Castillo et al., 295‐309
Authors´ Biographies
Eileen Ninette RUELAS-GONZALEZ Eileen N. Ruelas-Gonzalez is a research assistant at the Quality and Manufacturing Center at Instituto Tecnológico y de Estudios Superiores de Monterrey, Campus Monterrey in Mexico. She holds an undergraduate degree in industrial and systems engineering from Monterrey Tech and a M.S. and Ph.D degrees in Industrial Engineering from Arizona State University and Monterrey Tech. Her research interests are in the areas of operations research logistics and continuous improvement applications. She is a Master Black Belt by Arizona State University. She has published in journals such as the IEE and has taught undergraduate and graduate level courses in statistics and dynamic systems. She works for the private sector at a transnational chemical company. Neale Ricardo SMITH-CORJENO Neale R. Smith is an assistant professor at the Quality and Manufacturing Center at Instituto Tecnológico y de Estudios Superiores de Monterrey, Campus Monterrey in Mexico. He holds an undergraduate degree in industrial engineering from the University of Arizona and M.S. and Ph.D degrees in industrial engineering from Georgia Tech. His research interests are in the areas of operations research and logistics. He has taught both undergraduate and graduate level courses in operations research, logistics and supply chain management and statistical process control. He has published in journals such as the International Journal of Production Research and the European Journal of Operational Research. Jorge LIMON-ROBLES Jorge Limon-Robles holds a Ph.D. degree in industrial engineering from Instituto Tecnológico y de Estudios Superiores de Monterrey, Campus Monterrey (1998). Dr. Limon has been a full profesor at Tecnológico de Monterrey since 1989 and has taught in the automatization and industrial engineering fields. He coordinated the doctoral program in engineering sciences specializing in industrial engineering. He was director of the Division of Systems and Industrial Engineering from 2003 to 2008. At present, Dr. Limon is the director of the Graduate Studies and Academic Extension of the School of Engineering and Information Technologies. He has tutored several theses, published papers from fields of industrial engineering and automatization and provided advisory services to several organizations regarding the improvement of their processes following fundamentals of industrial engineering and automatization.
Journal of Applied Research and Technology
415