4626
Work 41 (2012) 4626-4632 DOI: 10.3233/WOR-2012-0757-4626 IOS Press
Determining anthropometric variables as a tool in the preparation of furniture and designs of interior spaces: the case of children 6 to 11 years old of Vicosa, State of Minas Gerais, Brazil Sharinna Venturim Zanuncioa, Simone Caldas Tavares Mafrab 1 , Carlos Emílio Barbosa Antôniob, Jugurta Lisboa Filhob, , Elza Maria Vidigal Guimarãesb, Vania Eugênia da Silvab, Amaury Paulo de Souzab, Luciano José Minetteb a,b
Department of Home Economics, Federal University of Vicosa, Avenue Peter Henri Rolfs, s/n, 36570-000, Vicosa, State of Minas Gerais, Brazil.
Abstract. The adequacy of facilities and the individual securities in their different age groups is importance to ensure greater functionality to them, allowing full development of daily activities. For this to occur more efficiently it is necessary the use of ergonomics which can ensure more comfort and safety for end users of products and spaces. The present study aimed to measure body dimensions of a representative sample of children aged 6 to 11 years old, children of graduate and pos graduate students, faculty and staff of the Federal University of Vicosa and also residents of the city of Vicosa, State of Minas Gerais, Brazil, coming from different municipalities of State of Minas Gerais, to organize a database that will provide the furniture industry, anthropometric variables more appropriate to design products for both the leisure activities, and for the school sector. To realize this research we used the methodology proposed by the authors Panero and Zelnik, based on samples distributed in six age groups, and providing a measurement of 10 variables. By applying the methodology to the field was possible to compare the observed data, with the tables of the aforementioned authors. The main results revealed a significant variation of the 10 variables analyzed, and it is believed that this variation could lead to possible flaws in the designs of products that use the data from these authors. The completion of the study provided data on Vicosa considered more appropriate for the design of products and environments for the population of the study, considering age and region, of Brazil (State of Minas Gerais) and it is believed that the future may expand to the Brazilian population, with the progress of study of this nature. Keywords: Anthropometry; Ergonomics; Planning Interior Spaces; Quality of Life
1. Introduction The adequacy of the work environment and leisure, and products that compose them are developed by ergonomic studies, which associated with anthropometry and biomechanics allow more efficient planning of the man. According to Couto (1996, cited in Falcão, 2006) [2] anthropometry measures human studies, which is 1
an essential and important variable in determining a workplace, whereas work is detached from any action by the individual to live in the place, be it survival, interaction with their environment daily, or even leisure. In this study, in particular, workplace environment that is every child from 6 to 11 years experience and interact to perform their daily activities.
Corresponding author:
[email protected]
1051-9815/12/$27.50 © 2012 – IOS Press and the authors. All rights reserved
4627
S.V. Zanuncio et al. / Determining Anthropometric Variables as a Tool in the Preparation of Furniture and Designs
Considering these aspects to be presented and the population of children 6 to 11 years exposed to risk situations in interaction with their daily environments, it is believed that this study using data obtained may contribute to the reduction of these risks and thus ensure better health comfort, safety and quality of life. 1.1 General Aims Measuring body size of a representative sample of children 06 to 11 years old, in order to get proper dimensions to design spaces, products and work surfaces effective for them. 1.2 Specific Aims - Evaluate anthropometric variables predefined for children 06 to 11 years old, the city of Vicosa, State of Minas Gerais, Brazil; - Compare the data obtained in this research study, with the authors' data Panero and Zelnik. 2. Methodology 2.1. Selection and description of the study area and sample This study was carried out in Vicosa, located in the State of Minas Gerais, region southwest. Its development is due to the presence of the Federal University of Vicosa with a population of approximately 12,000 inhabitants, plus the city's population that according to preliminary data presented by the IBGE Census 2010 [3] is around 70,923 inhabitants, numbering about 80,000 inhabitants. The city has a close relationship with the University. There are several projects in the area of services designed to meet the demand from students, professors and others employees of the Federal University of Vicosa. In the city of Vicosa, it can be seen high rates of urbanization and social and economic life influenced by the student community, especially the university. To collect the data from this study, we used a sample of children aged 06 to 11 years old, children of employees, professors or students of the Federal University of Vicosa, as well as residents of this city, coming from the different municipalities of the State of Minas Gerais, considering this age group to be in frequent situations of risk, due to the use of inappropriate products and spaces that often lead to accidents because children should be seen as a developing human being in need of constant protection.
Of a total of 1,124 children, who formed the study population, 597 were boys and 527 were girls. These were randomly chosen a value of 54.3% boys and 65.3% of girls to be measured and composed the study sample. The Table 1 presented below shows the distribution of the sample in question. Table 1
Boys Girls Total
Distribution of the sample measured by age 6 7 8 9 10 11 years years years years years years 59 51 55 61 48 50 68 53 59 73 48 43 127 104 114 134 96 93
Total 324 344 668
2.2. Description of Study Variables As the study aims to compare, we used the same 10 anthropometric variables suggested by Panero and Zelnik (2002) [5], which are described in the following Table 2: Table 2 Definition of anthropometric analyzed measured in the study VARIABLES 1 – Stature
2 – Weight (Kg) 3 – Elbow width (seated)
4 – Hip width (seated) 5 – Distance buttock-knee (sitting position) 6 – Distance buttockpopliteal (seated) 7 – Sitting height
8 – Knee height (sitting) 9 – Popliteal height (sitting) 10 – The thigh
DEFINITION Height is vertical distance from the floor to the top of the head, with the individual in a position lifted his gaze directed ahead. Product of the mass of a body by the acceleration of gravity Width of the lateral surface between the elbow of an individual sitting with arms folded forward and horizontally supported slightly against his own body. Maximum width of the hips of an individual sitting. This measure can also be obtained with the patient in standing position. It is the horizontal distance from the posterior surface of the buttocks to the front of the knees. It is the horizontal distance, considering the posterior surface of the buttocks to the back of the knees. Vertical measurement, considering the initial surface of the seat to the top of the head (the individual must be seated in normal position). It is the vertical distance that is obtained from ground to the kneecap. Vertical distance from the floor to the posterior knee of the individual sitting with the trunk upright. Considering the vertical distance from seat surface to the top of it, where it meets the abdomen.
4628
S.V. Zanuncio et al. / Determining Anthropometric Variables as a Tool in the Preparation of Furniture and Designs
2.3. Methods and procedures for data collection The study data were collected through anthropometric measurements of the sample in question, using anthropometric instruments suitable for such, as suggested by Panero and Zelnik (2002) [5]. To measure children beyond parental permission considering letter of invitation was requested support from the school to give space for the realization of the case study. Was adopted to study the same research methodology of Panero and Zelnik (2002) [5], since the principal aims would be to compare the study data, considering the data presented by both. The authors consider two types of body size as being essential for the design of products and spaces, the structural or static, or dynamic and functional, for this study specifically used the static measurements, which are those that are collected body measurements human in standardized positions, as shown in Table 2. To gather the data necessary for the study, children were measured in a static position, is standing for height and weight, and sitting for width measurements of hip, elbow, thigh, buttock-knee distance, and buttock-popliteal knee height, popliteal, sitting position. The procedures mentioned herein may be better understood from Table 3 and Figures 1 to 6, showing the positions of the individual during the collection process and instruments used. Table 3 Description of methods for obtaining anthropometric measurements, considering the use of anthropometry VARIABLES POSITION OF THE POSITION INDIVIDUAL ANTHROPOMETRY 1 – Stature Individual standing, Vertical, with the base arms at your sides, floor, and the stem look to the skyline. touches the hoghest part of the head. 2 – Weight Guy with feet (Kg) positioned on the scale. 3 – Elbow Individual standing. Horizontally, with the width (seated) Arms forming an depression that forms angle with the the basis of the union forearms forward, of the arm and forearm and the shaft on hands clasped. depression of the other back. 4 – Hip width Subject seated, torso Horizontal, with the (seated) upright, feet flat on base and stem in the floor, legs at a right maximum width of the angle with your hips, back. things – hands on thighs.
5 – Distance buttock-knee (sitting position) 6 – Distance buttockpopliteal (seated)
Subject seated, torso upright, feet flat on floor, legs at a right angle with your things. Subject seated, torso upright, feet flat on floor, legs at a right angle with your things.
7 – Sitting height
Subject seated, torso upright, feet flat on floor, legs at a right angle with your things.
8 – Knee height (sitting)
Subject seated, torso upright, feet flat on floor, legs at a right angle with your things. Subject seated, torso upright, feet flat on floor, legs at a right angle with your things. Subject seated, torso upright, feet flat on floor, legs at a right angle with your things.
9 – Popliteal height (sitting)
10 – thigh
The
Horizontal, with the base and stem in the maximum width of the hips, back. Horizontally, seat height, the wall with the base and stem in the popliteal fossa (read as superior to the stem). Horizontally, seat height, the wall with the base and stem in the popliteal fossa (read as superior to the stem). Vertical, with the base floor, side leg, and the stem in the popliteal fossa (read as superior to the stem). Vertical, with the base floor, side leg, and the stem in the popliteal fossa (read as superior to the stem). Vertical, with the seat base and stem in the highest part of the thing.
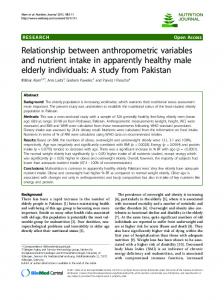
For the measurement of children were used the following equipment: digital scale; anthropometry; seat; measuring tape fiberglass; anthropometry small; trine and caliper. That allowed us to obtain the necessary variables to the study. Some of the equipment can be seen in the following figures:
Figure 1 - Equipment used to measuring children (seat, different kinds of anthropometers, different kind of meters tape, digital scale)
After data collection, based on the study Panero and Zelnik (2002) [5], using the descriptions of variables and the suggested equipment for the same setting, it was the determination of 5 and 95%
S.V. Zanuncio et al. / Determining Anthropometric Variables as a Tool in the Preparation of Furniture and Designs
percentiles, which indicate the percentage of test sample which has smaller and larger body size. 3. Procedure for data analysis After the measurement of 10 anthropometric variables to children in the study were able to calculate the mean and standard deviation for each variable and all age groups. The data obtained allowed the definition of 5 and 95 percentiles, ie, we could define the smallest and largest measured respectively, and the number of children among the population studied, inserted in each percentile. This data allows the designer to make decision about which percentile to use considering a greater number of end users, using particular space or object. For according to Panero and Zelnik (2002) [5] percentiles show the number of individuals in a given population that are part of a given body size. 4. Data collection period Data collection occurred from April 2006 to September 2010, with frequent visits to schools to obtain the necessary variable in quality and quantity sufficient to achieve effective results, were performed in parallel tabulation and analysis of data obtained. 5. Results and discussion The children measured were selected according to the parental bond with the Federal University of Vicosa, ie, were measured in children aged 6 to 11 years, children of faculty, staff or students at Federal University of Vicosa. However, these were not sufficient to fill the sample to be measured. Then children were sought in two public schools in the city observing the requirement that families should have their origin in the State of Minas Gerais. Being measured a total of 668 children, divided into different age groups as can be seen in the table below. Table 4 Sample measured considering the period of the April/2006 to September/2010 6 7 8 9 10 11 Total years years years years years years 59 51 55 61 48 50 324 Boys 53 59 73 48 43 344 Girls 68 Total 127 104 114 134 96 93 668 Source: Survey data (2006-2010)
4629
The anthropometric variables measured throughout the study were a total of 10, whose description was presented in the methodology (Table 2). However, the table below (Table 5) presents the application of the variables measured, considering its use in projects, and recommended percentile, as suggested by the study of Panero and Zelnik (2002) [5]. Table 5 Application of the measured anthropometric measurements and selection of percentiles VARIABLES APLICATION SELECTION PERCENTILES 95 1 – Stature Used for setting the minimum heights of doors, among other obstacles above. Determine areas of work, considering the height and the same layout. 2 – Weight To determine the (Kg) strength of materials, products and equipment, as well as area of movement and scaling of widths. 95 3 – Elbow Space occupation of width (seated) chairs around tables to determine the number of seats, given a desk or leisure. 95 4 – Hip width Widths of chairs and (seated) seats used in different everyday situations of the individual. 95 5 – Distance Depth of seats in general, and circulation buttock-knee area considering (sitting developing the position) individual sitting activity. 95 6 – Distance Seat width in general. buttockpopliteal (seated) 95 7 – Sitting Used to determine the height possible time to place an obstacle in order not to obstruct access to other users. 95 8 – Knee height It is essential to delineate (sitting) the distance from the floor to the lower base of a table for the individual to be seated in comfort. The degree of closeness between the user and the object is directly related to the knee and thigh of the user. 5 9 – Popliteal Determination of seat height (sitting) height to the ground, considering the highest
4630
S.V. Zanuncio et al. / Determining Anthropometric Variables as a Tool in the Preparation of Furniture and Designs
10 – The thigh
point. Important in determining the height between the work surface and seat, to allow movement of the legs.
5.2 Weight 95
In this study, we sought to define the 5th percentile, ie, the percentage of children in the sample, with the smaller body size, as well as those that fit the 95 percentile, which would be the percentage of children with the highest body size, and later to compare data Panero and Zelnik (2002) [5]. With the calculation of percentages for each age group and also separated by gender (boys and girls), it was possible to develop graphics that will be presented throughout this work, to provide a better comparison of data obtained with the field determined by Panero and Zelnik (2002) [5], as if the proposed study. These graphs also allow to observe the trend of variation of data obtained with the of Panero and Zelnik (2002) [5]. According to Alvarez and Pavan (2003) [1] is necessary to use measures of lengths and heights for the preparation of projects and products, whether for home or work. The authors emphasize that the measures used in the project will cover most of the population. In this respect, it is believed that use the 5 percentile for determining patterns of height measurements, to allow much higher, as the lowest use the space comfortably. And width measurements for the 95 percentile, to include both thinner people as those who are overweight, use and development activities effectively in everyday environments. Considering the survey data obtained in this study were presented from 10 variables measured, using graphs. These will be responsible for presenting the data and enable comparison of the same with those presented by Panero and Zelnik (2002) [5] for the same age group. 5.1 Height By comparing measurements of stature collected and determined by Panero and Zelnik (2002) [5] can be observed that children of both sexes showed higher values than those determined by the authors. As they have higher measures of stature, products and spaces designed from the table values Panero and Zelnik (2002) [5] will not be attending the children in the study sample, may become a risk to the physical integrity of same.
With regard to weight, the data obtained during the research shows that boys tend to lose weight over the years, however, there is a considerable increase in weight at the age of 10 years old for boys and girls of larger body size. Girls who are included in the group of smaller body size (5% percentile) have lower weight compared to those determined by the authors. But the girls of 11 years old, 5 percentile, showed a tendency to decrease the weight. According to with the data, in some age groups will increase the weight from the data Panero and Zelnik (2002) [5], if used the author’s data as the basis for the manufacture of chairs, the strength of the security may not be sufficient to provide security for this sample. 5.3 Width of elbows Of the children measured in this study, all showed greater than elbow width measurements obtained by Panero and Zelnik (2002) [5]. The authors explain that this measure is useful for determining space needed for distribution of chairs around the tables, for example. As the table values are smaller than citizens, the use of data Panero and Zelnik (2002) [5] for considering children of Vicosa projects, would generate the same discomfort, and incompatibility of the work surface to develop activities for the same. 5.4 Width of hip The variable width of the hip was higher both for girls and for boys evaluated, with a rising trend over the years, being a little smaller for the age of 11 years old in girls higher percentiles. According to Panero and Zelnik (2002) [5] this measure is very important when sizing the width of chairs and stools, so the designer must be aware of the variations presented for space planning or product considering the end user. To ensure comfort and safety for users in the study, due to the variation found among the measurements, it is necessary to use specific measures of the sample in the case of projects for the local population.
S.V. Zanuncio et al. / Determining Anthropometric Variables as a Tool in the Preparation of Furniture and Designs
4631
5.5 Distance buttock-knee
5.8 Height of knee
The measure of buttock-knee distance is greater than in the population studied in particular the study of Panero and Zelnik (2002) [5], with a decrease in the age group 10 years old and an increase in the next track. This measure helps to calculate the depth of seats, is essential for maintaining good posture, considering the activity performed sitting in this case by using the measures defined by the authors of the study would be impaired, since it has higher values and can therefore discomfort during the time of activities while seated. According to Panero and Zelnik (2002) [5] also contributes to this measure to determine the required distance from the back seat to the object that is in front of the knee, for example.
The boys presented for this variable, height greater than those determined by the study of Panero and Zelnik (2002) [5], this fact also being observed for the data of the girls evaluated. According to the authors Panero and Zelnik (2002) [5] measured the height of the knees is essential to establish the distance from the floor to the inside of a table, desk or counter, as well as the width of the thighs. And if the data used are not compatible with the user, and generate discomfort during use of the furniture mentioned above may worsen the case of deep vein thrombosis (WORK, 2007) [6]. Considering the aspect emphasized Nicholl and Boueri (2001) [4] conclude that in some cases you must use data from larger individuals, ie within the 95th percentile, with emphasis, the authors cite the calculation of free space on the lower surface of the table to receive the subject seated. Thus, we see the need, in the case of children measured in Vicosa, using their own measures, as measures of the authors of the tables would not be appropriate to provide the necessary space for comfort while walking legs on the bottom surface of a desk, for example.
5.6 Distance buttock-popliteal By comparing the measured distance buttockpopliteal, there was minor variation of the measures of research data and data Panero and Zelnik. Considering the variable in the analysis, we found that the children analyzed in Vicosa, State of Minas Gerais, Brazil, showed a lower value than those determined by the authors mentioned above. Because they are not compatible values of the research data and those of Panero and Zelnik (2002) [5], could not be used in a project, for example, a seat is a chair, bench, benches, etc., The authors' data because they do not guarantee the optimal length of the seat for these children. 5.7 Height sitting normal position The average height of boys and girls field obtained in the sitting position proved to be lower in almost all age groups for both the highest percentile (95%) and as for the lower percentiles (5%) considering the comparisons with the data presented by Panero and Zelnik (2002) [5]. The variable in question is very important for the calculation and measures considering the production of bunk beds, heights of walls, height of the backs of chairs, among others, so it is important to use measures that satisfy the users of the products, so the measures tables the authors would not be appropriate for children of Vicosa, since there was a variance between the measures, which would bring the user back pain due to poor posture.
5.9 Popliteal Height Both boys and girls assessed in the field, showed higher values of the variable popliteal height, in relation to the higher percentile, considering the data table Panero and Zelnik (2002) [5]. The data for this variable are critical for estimating the height of chairs, or the like on the floor, so the measures proposed by the authors would not give the necessary comfort to the sample measured in Vicosa, as this is presented with higher values. 5.10 Thigh height (sitting position) While working in a sitting position, it is sometimes necessary to modify the position of the legs under the surface where the activity takes place, so it is essential that there is space for a good positioning of the legs (Panero and Zelnik, 2002) [5]. The measures of the population obtained in this research, thigh alternated between equivalent measures smaller or even larger than those presented by the authors in their tables, this fact indicates that the use and planning of products that were based on measures of Panero and Zelnik (2002) [5],
4632
S.V. Zanuncio et al. / Determining Anthropometric Variables as a Tool in the Preparation of Furniture and Designs
considering this study, would cause discomfort to use them. When considering all data presented and discussed throughout this study realized, that it is essential to preparation of products for the age group analyzed, anthropometric measures that would provide them comfort and security, so that activities are carried out more efficiently and efficiency, without compromising the health of ourselves. During the measurement of children in schools has been observed that many of them do not use furniture suited to their physical dimensions, which forces the use of awkward positions, which can compromise their health and academic performance. Given this, it is necessary to perform further studies to enable the correct use of measures for children in this age group, since the elaboration of projects using U.S. measures could compromise their safety, considering the physical characteristics of the children. 6. Final Considerations This study aimed to measure body size of children aged 6 to 11 years old to provide the end subsidies for project development of products considered most appropriate for the population studied, and thus ensure comfort, safety, efficiency and effectiveness. According to the results obtained, it was noted during the interactive process that there is a trend of variation between the data of the study carried out in Vicosa, State of Minas Gerais, Brazil, with the data presented in the Panero and Zelnik’s research (2002) [5]. This fact can be constituted as a risk factor for the user space and products, which are generally designed using data tables of the authors in question. Therefore, the use of anthropometry in the development of products and work spaces, it is necessary to promote the user well-being and quality of life, ensuring their safety. It is believed that studies like this that seek to compare international data with the Brazilian reality, arise as urgent to demystify the idea of the inadequacy of data, or otherwise display the points where they would not be recommended, considering the physical type of the Brazilian people. With the completion of the measurements of children 06 to 11 years old and the subsequent comparison with data provided by Panero and Zelnik (2002) [5], has as the next stage of the project, structure a software with the data to support the industry furniture in the process of manufacturing
furniture as well as the definition of work situations to children (6 at 11 years old), thus providing, a tool that will allows comfort, safety and convenience for users of products and spaces in your daily life, intend to provide theoretical basis for more comprehensive studies related to the subject anthropometry. Noting also that the present study, as well as its later stages aims to provide the CD-ROM anthropometric variables to be used as a tool in the process of drafting of work situations, because it believes it will be an enabling better quality of life for the subjects users of these projects. Knowledgment This research receive the financial support of National Council for Scientific and Technological Development (NCSTD).
References [1] Alvarez, Barbara R., and Pavan, Andre Luis heights and lengths. In: Edio Luiz Petroski, editor. Anthropometry: techniques and standards. 3rd ed. Blumenau: New Letter, 2007. p. 31-44. [2] FAlcão, Franciane. Problematization of SHTM. FUCAPI, Manaus. Available at: , access: 10 November 2010. [3] IBGE - Brazilian Institute of Geography and Statistics. Census 2010. 2010. Available at: . Accessed: November 09, 2010. [4] Nicholl, Robert Anthony, and Boueri Filho, José Jorge. Sizing of Equipment and Housing Securities. Magazine Human Settlements. Marilia, v.3, n.1, p. 75-92, 2001. [5] Panero, Julius, and Zelnik, Martin. Scaling to human indoors. Translation: Anita R. Di Marco. Barcelona: Gustavo Gilli, 2002. 320p. [6] Work sitting increases risk of blood clots, says study. Available at: . Accessed: November 13, 2010.