SAARC J. Agri., 13(1):162-173 (2015)
DETERMINING BEHAVIOUR OF MAIZE GENOTYPES AND GROWING ENVIRONMENTS USING AMMI STATISTICS P. Kumar and N.K. Singh* Department of Genetics and Plant Breeding, G. B. Pant University of Agriculture & Technology, Pantnagar-263145, Uttarakhand, India
ABSTRACT Thirty three maize genotypes including hybrids and pure lines were evaluated to assess the grain yield performance under four -1 environments; normal nitrogen (NN 120 kg ha ), high nitrogen (HN 160 -1 -1 kg ha ), low nitrogen (LN 80 kg ha ) and excess water (EW). Environment wise analysis revealed significant variance for grain yield. Analysis of data across the environments using additive main effect and multiplicative interaction (AMMI) statistics revealed significant variance for genotypes, environment and genotype x environment (GxE) interaction. Genotype main effects had the largest contribution (55.23%) to the total sum of square for grain yield followed by GxE interaction (22.73%) and environment (22.02%). The interaction component was further divided into three interaction principal component axes (IPCAs), IPCA I, IPCA II and IPCA III which accounted for 45.24%, 29.60% and 25.16% of GxE interaction component, respectively. The AMMI 1 biplot analysis using genotype main effect and IPCA I scores indicate that genotypes had high variance compared to the variance due to environments as evidenced by the distribution as well position occupied by the 33 hybrids and 4 environments on biplot display. The AMMI 2 biplot analysis identified three hybrids SCH-10, SCH-21, SCH-19 with relatively stable performance across the environments. AMMI 2 biplot analysis also categorized hybrids specifically adapted to NN, LN, HN and EW environments. However, all the hybrids exhibited specific adaptability to LN and EW environments having lower grain yield than the average yield. The inbred lines identified to have stable performance across the environments were IL-5 and IL-10, however it is interesting to note that none of the inbred lines exhibited specific adaptability to NN and HN environments which may due to inherently poor nitrogen use efficiency of inbred lines in comparison to hybrids. Keywords: Maize, AMMI analysis, IPCA, Biplot, Stability
*
Corresponding author email:
[email protected]
Received: 11.02.2015
DETERMINING BEHAVIOUR OF MAIZE GENOTYPES
163
INTRODUCTION Exploitation of heterosis in the form of single cross hybrids has now become a focused agenda in maize (Zea mays L.) improvement programme even in developing countries where composite varieties are mostly grown. Inbred parents performance, combining ability and genetic diversity among them are considered to be important factors determining success of single cross hybrid development programme (Devi and Singh, 2011). Due to involvement of only two parents, the adaptability of single cross hybrids to the existing environmental conditions due to global climate change has been questioned. Moreover, over 80 per cent of maize is cultivated during the stress prone environment of rainy season in India which necessitates development and deployment of single cross hybrids with adequate buffering potential to ensure the stability of production and productivity of maize. Excess or low water availability during the rainy season also influences the application of nitrogenous fertilizers. Thus, evaluation in many environments are requires to be conducted to analyse yield potential and also to identify adaptation and stability of maize hybrids and their parental lines. Changes in the relative behavior of the genotype in different environments are usually noticed if experiments are conducted over the years and locations. This phenomenon is generally referred genotype by environment interaction (GxE). The GxE interaction makes it difficult to select genotypes that produce high yields across the environments and that are more stable in breeding programs. This, of course, reduces the selection progress. Due to changing climate and inclement weather conditions throughout the year in general and during the rainy season in particular, the criteria for selection based on general as well as specific stability and adaptability parameters seem to be more relevant in improvement programme in case of single cross hybrids where only two parents are involved. Thus, determination of GxE of single cross hybrids as well as parental inbred lines have become extremely important, because it can be used to establish the breeding objectives, such as the choice of parental lines, identification of the ideal test conditions and recommendations for regional adapted cultivars (Yan et al., 2000). Because of many options of technical interpretations, the AMMI (additive main effect and multiplicative interaction) statistics based on the use of biplots seems to be better choice than the other statistical models for the investigation of the GxE (Zobel et al., 1988). AMMI analysis interprets the effect of the genotype (G) and environment (E) as additive effects plus the GxE as a multiplicative component and submits it to principal component analysis. Its biplot is identified as GxE biplot which combines the yield stability parameters (Yan et al., 2000). Gauch & Zobel (1988) opined that the use of AMMI model to evaluate multi-environment data are as effective as with the data recorded from two to five times more replications. Further, Gauch (2006) argued that AMMI statistics is better than the site regression analysis because it allows distinguishing the effects of the genotype and the environment and then assessing the GxE interaction in a reduced dimensional space with minimum error. The present investigation was therefore aimed to apply AMMI statistics to
164
P. Kumar and N. K. Singh
determine the stability and adaptability of 33 maize genotypes across the four environments MATERIAL AND METHODS Thirty one maize genotypes comprised of 10 inbred lines designated as inbred line (IL-1 to IL-10) and 21 single cross hybrids (designated as SCH-1 to SCH-21) were evaluated along with 2 released single cross hybrids namely Pant Sankar Makka1(PSM-1) and Vivek Maize Hybrid- 9 (VMH-9) in randomized complete block design (RCBD) with two replications at NE Borlaug Crop Research Centre, Pantnagar. Each set of 33 genotypes were exposed to four environments namely normal nitrogen (NN 120 kg ha-1), high nitrogen (HN 160 kg ha-1), low nitrogen (LN 80 kg ha-1) and excess water (EW), thus four evaluation experiments were conducted. Ponding water of 5.0 cm was applied for seven days since 35 days after sowing to test the genotypes under EW stress. In case of EW condition, N @ 120 kg ha-1 was used. Evaluation experiments were conducted in plot size of 3.0 m2 and all the recommended cultural practices except stress conditions were followed to ensure optimum growth and development of the crop. The recommended cultural practices include pre-sowing irrigation, field preparation and proper leveling, line sowing, spray of pre-emergence herbicide Atrazine at 0-4 days after sowing (DAS), maintained five plants per running meter in rows having between row distance of 0.75cm, hoeing at 28-32 DAS, earthing after 32-36 DAS, drained out excess water during continuous rainfall, irrigation as and when required especially during the dry spell, application of nitrogen in three split doses and harvesting of fresh cob at maturity. Fresh cobs were harvested at physiological maturity and finally grain yield/ha at 15% moisture was calculated using formula given below:
FCY/plot (kg) x (100-MC) x 10000 (m2) x SC Grain yield (kg ha ) = 85 x Plot area (m2) x ha -1
FCY MC
= Fresh Cob Yield/plot = Moisture content (%) in grains at harvest
SC
= Shelling coefficient
The grain yield (kg ha-1) of each treatment replication wise thus obtained was used for single site analysis while AMMI analysis was used to analyse G×E interaction (Zobel et al., 1988). The data were analysed using CROPSTAT version7.2 software (IRRI, 2009). RESULTS AND DISCUSSION Single site analysis indicated significant variance for grain yield among maize genotypes in all the four environments. The single cross hybrid SCH-11 recorded
DETERMINING BEHAVIOUR OF MAIZE GENOTYPES
165
highest grain yield of 9505 kg ha-1 when averaged over the four environments. The other promising hybrids which exhibited grain yield from 9424 to 7959 kg ha-1 and higher than the overall mean of the hybrids (7943 kg ha-1) across the environments, were SCH-20, SCH-12, SCH-3, SCH-2, SCH-7, SCH-19, SCH-21, SCH-13, SCH10, SCH-14, VMH-9 and PSM-1. Of the 21 hybrids, 10 hybrids exhibited grain yield lower than the mean yield of all hybrids. Inbred lines per se performance across the environments varied from minimum of 4333 kg ha-1 (IL-8) to maximum of 5782 kg ha-1 (IL-3). Environment wise analysis of mean indicated that HN had more favorable environment as environmental means and index were found to be maximum of 8476 kg ha-1 and 1316, respectively, whereas EW condition was identified to be most unfavorable environment because of the lowest environmental mean as well environmental index of 6166 kg ha-1 and -990.2, respectively. Nitrogen fertilizer is universally accepted as a key component of high maize grain yield and optimum economic return (Gehl et al., 2005). Therefore, high nitrogen dose may provide better growth and development along with high grain yield per unit area. On the other hand, water stagnation in maize field right from sowing to flowering and grain filling stage is considered to be an important stress environment on plant and depending on stress severity, growth, development as well productivity of maize is affected significantly (Zaidi et al., 2001). Looking over the data across the environments, it was noticed that the rank of genotypes did not remain same from one environment to another environment. The differential response of the inbred lines and hybrids over the environments in the present investigations therefore indicate the existence of genotype x environment interaction for grain yield. AMMI statistics was therefore used to quantify the total G×E interaction effect of yield data of each genotype and also to partition it into interaction effects due to individual environments (Zobel et al., 1988). Linear regression model is the commonly used method for determination G×E interaction and identification of stable cultivars (Eberhart and Russel, 1966; Mani and Singh, 1999; Babic et al., 2006). This model states that a stable genotype should have low deviation from regression. Considering this criterion, a high yielding genotype often gets rejected due to high deviation from regression over the range of environments. It is likely that high deviation from regression may occur when a genotype showing high positive interaction in some environments and negative interaction in others and therefore the genotype is classified as unstable. However, data analysis with AMMI model provides estimate of total G×E interaction effect of each genotype and also further partitions it into interaction effects due to individual environments (Zobel et al., 1988). Low G×E interaction of a genotype indicates its stability over the range of environments. A genotype showing high positive interaction in an environment obviously has the ability to exploit the agro-ecological or agro-management conditions of the specific environment and is therefore best suited to that environment.
166
P. Kumar and N. K. Singh
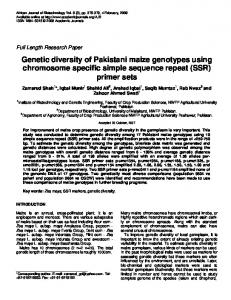
AMMI analysis of variance of grain yield data of the 33 maize genotypes tested over the environments indicated significant variance due to genotypes (G), Environments (E) and the G×E interaction (Table 1). Thus, the circumstantial evidence exhibited the importance of all sources of variance in differential response of the maize genotypes. However, genotype main effect (G) emerged as the most important source of variance due to its largest contribution (55.23 %) to the total sum of squares (TSS). The contribution of GxE interaction to the TSS was observed to be 22.73% which was marginally higher than those contributed by main effects of environment (22.02%). This indicates that differences among mean and rank across environments was largely due to genotypic effect followed by interaction and environment effects. A large sum of squares for genotypes indicated that the genotypes were diverse with large differences among genotypic means causing variation in grain yield. The range of variation for grain yield in the present investigation was noted be from minimum of 4333 kg ha-1 in IL-8 to maximum of 9505 kg ha-1 in SCH-11. This wide range of variation for grain yield was observed because of inclusion of both inbred lines and hybrids in evaluation trial. The magnitude of the genotype x environment interaction sum of squares was slightly larger than that for environments indicating that there were substantial differences in environmental and GxE responses toward genotypes. The similar observations were also noted earlier by Arulselvi and Selvi (2010) and Khaldun (2012). Nzuve et al. (2013), Jha et al. (2013), Abuali et al. (2014) and Kumar et al. (2014) also observed significant variance due to G, E and GxE interaction however the magnitude of SS due to environment was noted to be higher than the G and GxE. The interaction variance was further dissected into Interaction Principal Component Axes (IPCAs). Three IPCA axes were adequate to explain whole variance of G x E interaction. The first axis consisted of 45.24% of G x E interaction SS whereas IPCA2 and IPCA3 explained 29.6% and 25.16% variance of the interaction SS, respectively. IPCA1 and IPCA2 together with accounted for total of 74.68% variance of G x E interaction. In AMMI model, the biplot analysis is considered to be the most impressive and objective tool in analysis of G×E interaction. IPCA1 scores of genotypes and environments are plotted against their respective means in case of AMMI I biplot analysis, whereas in AMMI II biplot, the IPCA1 and IPCA2 scores of genotype and environments are plotted against each other. In the biplot display, genotypes or environments that occupy horizontal line of the AMMI 1 graph had similar mean yields and those that fall almost on a perpendicular line had similar interaction. AMMI I biplot analysis for grain yield of the 33 maize genotypes tested in four environments in the present investigation showed relatively higher variance due to genotypes than the variability due to environments as evidenced from the distribution pattern of 33 genotypes and 4 environments on biplot display (Figure 1). Genotypes or environments on the upper half of the horizontal lines have means higher than those occupied position on the lower half of the horizontal line. All the hybrids
DETERMINING BEHAVIOUR OF MAIZE GENOTYPES
167
except SCH-1, SCH-8, SCH-9 and SCH-16 had higher mean grain yield since they occupied place above the horizontal line on AMMI 1 biplot. However, only 13 hybrids namely SCH-2, SCH-3, SCH-7, SCH-10, SCH-11, SCH-12, SCH-13, SCH14, SCH-19, SCH-20, SCH-21, VMH-9 and PSM-1 were identified to be high yielding when means of only hybrids were taken as horizontal line. Zobel et al. (1988) pointed out that the AMMI expected yield for any genotype and environment combination can be calculated from AMMI I biplot. Large negative or positive IPCA1 scores of genotypes or environment indicate high negative or positive interactions, while those with IPCA1 scores near zero indicate little interaction across environments. Of the 33 genotypes, the hybrid SCH-7 exhibited minimum IPCA1 score and grain yield higher than the average of hybrids and therefore considered adaptability of SCH-7 across the environments. The other promising hybrids having grain yield above the horizontal main effect line were SCH-10, SCH-12, SCH-19 and SCH-20 along with low positive interaction and SCH-3 with low negative interaction. The hybrid SCH-11 had maximum yield and largest positive interaction indicating its adaptability to HN favourable environment. The other hybrids exhibited high yield and adaptability to favourable environments were SCH-13, VMH-9 and PSM-1. These hybrids may prove to be promising cultivars in maximizing productivity in area where farmers are access to input supply. Inbred lines are generally low yielding and therefore occupied position on lower half of the horizontal line on AMMI 1 biplot. The distribution of inbred lines on lower half of the AMMI I biplot seems to be justified since inbred lines are inherently poor due relatively lesser tolerance against abiotic stresses and also low responsive to nitrogen. The IL-3, IL-4, IL-5, IL-7 and IL-10 exhibited mean grain yield higher than the average when only mean inbred lines were considered. The IL-8 among the inbred lines seems to be relatively more stable than the others however, the grain yield potential of IL-8 was the lowest. Of the four environments, NN and HN were placed on upper half with positive interaction whereas LN and EW environments occupied position at lower half of the AMMI 1 biplot with positive and highly negative interaction, respectively. The highest positive main effect was recorded by the environment HN followed by LN and NN whereas the environment EW recorded maximum negative interaction. Based on the biplot observations, it can be said that HN environment is the most favourable whereas NN is the average environment. Similarly, EW environment followed by LN environments emerged as the most unfavourable conditions for maize cultivation probably because of emergence of hypoxic condition in root zone due to excess water leading to interference with nutrients as well water supply (Zaidi et al., 2001; Gehl et al., 2005). Further, maize is a high nitrogen demanding crop that is why LN environment is also not conducive for optimum growth and development of hybrids. The IPCA 1 and IPCA 2 scores of genotypes and environments were aligned for AMMI II biplot analysis to demonstrate the relative magnitude of the G x E interaction (Fig 2). The closer the score to the center of the biplot II, the genotypes
168
P. Kumar and N. K. Singh
are assumed to be more stable than the score of the genotypes away from the centre. Further, angles between the genotype and environment vectors determine the nature of the interaction as it is positive for acute angle, negligible for right angle, and negative for obtuse angle. Similarly, the angle between the vectors of two environments determines the relationships between pair of environments. The environments HN, LN and EW identified to be the most discriminating as indicated by the longest distance of these environments from the origin point. In contrast, environment NN identified to have little discriminating power and genotypic differences at NN remains to be highly consistent with those averaged yield over environments, because it had less IPCA scores compared to other three environments. Similar observations were also noted earlier by Arulselvi and Selvi (2010). Further because of the obtuse angle between environmental vectors of HN and EW, the response of these two environments are opposite in direction. The HN and NN environments exhibited positive association to each other since the angle between these two environmental vectors was acute. Analysis of genotypes in reference to environmental vectors exhibited adaptability of hybrids SCH-1, SCH-6, SCH-9, SCH-17 and SCH-18 to poor yielding environment of EW. However, yield of these hybrids were lower than the average yield of all hybrids. In contrast, three single crosses namely SCH-7, SCH-14 and SCH-20 were found to occupy positions around vector of NN environment with grain yield higher than the average of hybrids. These hybrids are therefore considered to have adaptability to NN environment. The angle between NN and HN environments is acute and therefore it is assumed that these hybrids will also exhibit positive response under HN condition. The hybrids namely SCH-11, SCH-13 and VMH-9 had yield higher than the average were found to be specifically adapted to HN environment. These hybrids are expected to have high nitrogen use efficiency and grain yield per unit area can be maximized by applying higher dose of nitrogen. Two hybrids namely SCH-16 and SCH-8 were specifically adapted to LN environment but have grain yield lower than the average of hybrids. These hybrids may be useful for cultivation on marginal land or area where farmers generally use low fertilizers. PSM-1 and SCH-15 exhibited adaptability in between the HN and LN. The hybrids SCH-12, SCH-10, SCH-21, SCH-19 and SCH-5 were found to be confined relatively close to the origin point in the AMMI II biplot indicating minimal interactions of these hybrids with the environments. Thus, the hybrids SCH-12, SCH-10, SCH-21, SCH-19 and SCH-5 were identified to have less influence of environmental change and said to stable. However, yield potential of hybrids SCH-12 and SCH-5 were lower than the average of hybrids and therefore do not qualify for stable hybrids. The other three hybrids namely SCH-10, SCH-21 and SCH-19 had high grain yield as well as low IPCA 1 and IPCA 2 scores and therefore assumed to be high yield performance across the environments. Further, these hybrids may be potential alternatives for cultivation under different environmental conditions. The adaptability of the hybrids to specific or over all the environments may be due to diversity of
DETERMINING BEHAVIOUR OF MAIZE GENOTYPES
169
parents and sources from where inbred lines have been derived, allelic homeostasis and complementation of the yield related genes upon bringing together the allelic forms from the two parents. The IL-1 and IL-5 of the 10 inbred lines, occupied place relatively closer to origin of the AMMI II biplot indicating less interaction with the environments, however, grain yield of IL-1 was noted to be lower than the mean of the inbred lines. Thus, the inbred lines identified to be stable across the environments were IL-5 and IL-10. The inbred line IL-2 exhibited adaptability to LN environment though yield was slightly lower than the average yield of inbred lines. Most of the inbred lines positioned on the AMMI II graph in between the environmental vectors of EW and LN. However, none of the inbred lines exhibited adaptability to NN or HN environment. In the present investigation, AMMI analysis has been used successfully for determining behavior four environments and 33 maize genotypes. AMMI statics has also been used earlier to quantify complexity of GxE interactions and to identify genotypes adapted to specific or broad environmental conditions (Balestre et al., 2009; Babic et al., 2010; Kandus et al., 2010; Jha et al., 2013; Abuali et al., 2014; Kumar et al., 2014). CONCLUSION The 33 maize genotypes exhibited differential yield response over the environments indicating GxE interaction. Hybrid SCH-11 noted to be highest yielding across the environment. Environmental index and mean indicated HN as the most favourable whereas EW condition at pre-flowering stage as the most unfavourable environment for maize cultivation. All the three components namely genotype, GxE interaction and environment exhibited significant variance however genotype had maximum contribution to the total variance. Of the three IPCAs, IPCA 1 and IPCA 2 together with accounted for 74.68% of GxE interaction variance. AMMI biplot analysis indicates HN, LN and EW as the most discriminating environments. Because of the obtuse angle between environmental vectors of HN and EW, the response of these two environments seems to be opposite in direction. The hybrids namely SCH-11, SCH-13 and VMH-9 had yield higher than the average were found to be specifically adapted to HN environment. These hybrids are expected to optimize productivity under favourable environmental conditions. The hybrids namely SCH-10, SCH-21 and SCH-19 had high grain yield as well as low IPCA 1 and IPCA 2 scores and therefore can be used for cultivation across the environments. The inbred lines identified to be stable across the environments were IL-5 and IL-10 which may be potential genetic resources in developing hybrids for cultivation in diverse environmental conditions. In the present investigation, AMMI analysis therefore categorized the environments and identified genotypes adapted to specific environment or to all the environments and therefore AMMI analysis can be used successfully in plant breeding experiments for determining yield stability of inbred lines as well as hybrids over the diverse environmental conditions.
170
P. Kumar and N. K. Singh
REFERENCES Abuali, A. I., Abdelmula, A. A., Khalafalla, M. M., Hamza, N. B., Abdalla, A. H. and Idris, A. E. 2014. Assessment of yield stability and adaptability of parental inbred lines and F1- hybrids of grain maize (Zea mays L.) Using AMMI Analysis. British Biotechnology Journal, 4:338-349 Arulselvi, S. and Selvi, B. 2010. Grain yield stability of single cross maize (Zea mays L.) hybrids over three different environments. Electronic Journal of Plant Breeding, 1:577584 Babic V., Babic M. and Delic N. 2006. Stability parameters of commercial maize (Zea mays L.) hybrids. Genetika, 38:235-240 Babic, V. Babic, M. Ivanovic, M. Kraljevic-Balalic, M. and Dimitrijevic M. 2010. Understanding and utilization of genotype-byenvironment interaction in maize breeding. Genetika, 42:79-90 Balestre, M., Von Pinho R.G., Souza J.C. and Oliveira R.L. 2009. Genotypic stability and adaptability in tropical maize based on AMMI and GGE biplot analysis. Genetics and Molecular Research, 8: 1311-1322 Devi, P. & Singh N.K. 2011. Heterosis, molecular diversity, combining ability and their interrelationships in short duration maize (Zea mays L.) across the environments. Euphytica, 178:71-81 Gauch, H.G. Jr. and Zobel, R.W. 1988. Predictive and postdictive success of statistical analyses of yield trials. Theoretical and Applied Genetics, 76: 1-10 Gauch, H.G. Jr. 2006. Statistical analysis of yield trials by AMMI and GGE. Crop Science, 46: 1488-1500 Gehl, R.J., Schmidt, J.P., Maddux, L.D. and Gordon, W.B. 2005. Corn yield response to nitrogen rate and timing in sandy irrigated soils. Agronomy Journal, 97:1230-1238 IRRI. 2009. IRRISTAT version 7.2. Tutorial manual part I and II. Crop Research Informatics Laboratory. International Rice Research Institute, Philippines. 379p Jha, S.K., Singh,N.K. Arun Kumar, R., Agrawal ,P.K., Bhatt, J. C., Guleria, S.K., Lone, A.A., Sudan, R.S., Singh, K. P. and Mahajan, V. 2013. Additive Main Effects and Multiplicative Interaction (AMMI) analysis for grain yield of short duration maize hybrids in North-Western Himalayas. Indian Journal of Genetics and Plant Breeding, 73:29-35 Kandus M., Almorza, D. Boggio Ronceros, R., Salerno, J.C. 2010. Statistical models for evaluating the genotype-environment interaction in maize (Zea mays L.). International Journal of Experimental Botany, 79:39-46 Khaldun, A.B.M., Banik, B.R., and Mondal, A.A. 2012. Genotype-by-environment Interaction Assessment Using Additive Main Effects and the Multiplicative Interaction Model (AMMI) in Maize. Jordan Journal of Agricultural Sciences, 8:22-32 Kumar, R., Singode, A., Chikkappa, G.K., Mukri1, G., Dubey, R.B., Komboj, M.C., Singh, H.C., Olakh, D.S., Ahmad, B., Krishna, M., Zaidi, P.H., Debnath, M.K., Seetharama, K. and Yadav, O.P. 2014. Assessment of genotype × environment interactions for grain
DETERMINING BEHAVIOUR OF MAIZE GENOTYPES
171
yield in maize hybrids in rainfed environments. SABRAO Journal of Breeding and Genetics, 46:284-292 Mani, V.P. and Singh, N.K. 1999. Stability analysis in maize (Zea mays L.). Indian Journal of Agricultural Sciences, 69:34-35 Nzuve, F., Githiri, S., Mukunya, D. M., and Gethi, J.. 2013. Analysis of Genotype x Environment Interaction for Grain Yield in Maize Hybrids. Journal of Agricultural Science, 5(11):75-85 Yan W, Hunt LA, Sheng Q and Szlavnics Z. 2000. Cultivar evaluation and mega-environment investigation based on the GGE biplot. Crop Science, 40: 597-605 Zobel, R.W., Wright, M.J. and Gauch, H.G. Jr. 1988. Statistical analysis of a yield trial. Agronomy Journal, 80: 388-393 Eberhart S.A. and Russel W.A 1966. Stability parameters for comparing varieties. Crop Science, 6: 36-40. Zaidi, P.H. and Singh, N.N. 2001. Effect of water-logging on growth, biochemical compositions and reproduction in maize. Journal of Plant Biology, 28: 61-69
Table 1. AMMI ANOVA for yield in maize Source of variance
DF
SS
MS
% of G-E SS
% of GxE SS
Genotypes
32
243502000
7609440
55.23
Environment
3
97113000
32371000
22.02
Genotype x Environment
96
100229000
1044050
22.73
AMMI 1
34
45342400
1333600
45.24
AMMI 2
32
29663300
926979
29.60
AMMI 3
30
25223100
840771
25.16
Total
131
440844000
SS- Sum of square, MS- Mean square, DF- Degree of freedom
172
P. Kumar and N. K. Singh
9000
Points represents hybrids and vectors represent environments Represent mean of hybrid Represent mean of all genotypes Represent mean of inbred lines SCH3
SCH11
SCH20 SCH12
SCH2
HN
SCH19 SCH13 SCH7 SCH21 VMH9 SCH10 SCH14 PSM1
8000 SCH4
SCH5
SCH6
SCH15 NN
SCH18 SCH17
Grain Yield (kg/ha) SCH1
7000
SCH16 SCH8
SCH9
LN EW 6000
IL3 IL7
IL10 IL4 IL6 IL5 IL2
5000 IL1
IL9
IL8 4000 -65.0
-52.0
-39.0
-26.0
-13.0
0.0
13.0
26.0
39.0
IPCA 1 (45.24%)
Figure 1. AMMI I biplot of main effects and G×E interaction of 33 maize genotypes
52.0
65.0
DETERMINING BEHAVIOUR OF MAIZE GENOTYPES
173
65.00 Points represents hybrids and vectors represent environments 52.00
39.00 SCH14 SCH7
26.00
IPCA2 (29.60%)
EW SCH6
13.00
SCH3 SCH18 SCH1
SCH9 IL7
IL9 -13.00 SCH3
SCH5 SCH19
IL1
IL3
0.00
HN SCH20 NN
SCH17
IL5
SCH21
IL8 IL10 IL4 IL6
VMH9 SCH13
SCH11
SCH12 SCH10 PSM1 IL2
SCH15
SCH8 -26.00
SCH2
SCH16
-39.00
-52.00
-65.00 -65.0
LN -52.0
-39.0
-26.0
-13.0
0.0
13.0
26.0
39.0
IPCA1 (45.24%)
Figure 2. AMMI II biplot of G×E interaction of 33 maize genotypes
52.0
65.0