Cornell University. Introduction. Feed efficiency can be described as the efficiency of use of the energy consumed from the ration fed for maintenance and growth ...
DETERMINING POST-WEANING FEED EFFICIENCY IN BEEF CATTLE D. G. Fox, L. O. Tedeschi, and M. J. Baker Department of Animal Science Cornell University Introduction Feed efficiency can be described as the efficiency of use of the energy consumed from the ration fed for maintenance and growth. Selection procedures are needed that result in identifying animals with improved efficiency of use of absorbed (metabolizable) energy for maintenance and growth without altering body weight at the target chemical composition. However, it is not practical to determine feed metabolizable and net energy values for maintenance and growth for individual animals on farms. Therefore indirect measures must be used to estimate energetic efficiency. We can compute the average expected feed required for the observed daily gain and body weight, using equations developed from experimental data to predict average expected maintenance and growth requirements for the observed body weight and daily gain, and net energy values derived from feeds (Guiroy et al., 2001; Perry and Fox, 1997). Individually fed animals that consume less than the average across a group being evaluated for feed efficiency would have a higher efficiency of use of the feed consumed and/or a lower maintenance requirement; those with a higher intake than expected would likely have a lower efficiency of use of the feed consumed and/or a higher maintenance requirement. Residual feed intake (RFI) has been proposed as a procedure to estimate this difference by subtracting observed DMI of an individual from DMI predicted by an equation developed from the relationship between DMI, ADG and metabolic mean body weight across individually fed contemporaries (Archer et al., 1999; Carstens et al., 2002). In most progeny tests, however feed efficiency for individual animals must be estimated from information available for animals fed in pens under typical feedlot conditions. In this case, a ratio of expected feed required to the observed gain is the only practical measure of feed efficiency. Because our feed required procedure accounts for differences in the effect of body weight and composition of gain on energy requirements, animals with a lower feed to gain ratio may have had a greater intake over maintenance, a greater efficiency of use of the energy consumed, or a combination of both. Accurate determination of feed required for the observed growth to the target body composition requires accounting for factors affecting animal requirements and feed energy values for maintenance and growth. This paper focuses on determination of feed required for individual animals when pen-fed, using the Cornell Value Discovery System (CVDS), which is a mechanistic model we have developed for that purpose.
Predicting animal requirements and feed energy values Because of the wide variations in breed types and their crosses used for beef production in North America and environmental conditions in which they are fed prior to marketing as finished beef, modeling systems to predict feed requirements and cost of gain must be able to account for differences in basal maintenance requirement, the effect of environment on maintenance requirement, the effect of body size, implant program and feeding system on finished weight and growth requirements, feed energy values, and dry matter consumption. Accounting for body composition at the marketing target. The critical first step for predicting feed required for the observed growth and incremental cost of gain and body composition as cattle grow is to identify the body composition at the marketing target. Carcass value in most markets and cost of gain can be related to proportion of protein and fat in the carcass. Body fat in finished cattle when marketed typically varies from 16 to 21% empty body fat (EBF) in the French (INRA, 1989) and Brazilian (Leme et al., 2000) markets to over 30% EBF in segments of the Japanese and Korean Markets. Most other markets range between these two. The single most recognizable quality grade in the world is USDA choice. Premium brand name products typically utilize the prime and upper 2/3 of the Choice grades and are increasing the value of U.S. beef products. Table 1 shows a summary of data from our experiments (Guiroy et al., 2001) that support the value of the Choice and prime grades level of fatness to minimize the percent of the beef that is unacceptable to consumers in the U.S. Table 1. Relationship of carcass and empty body fat to quality grade (total of 1,355 animals; Guiroy et al., 2001). Values in a row are means for that grade b Percent Number USDA Mean carcass Mean EBF , EBF Taste c fat, % % SEM panel unacceptable of Quality a c score animals Grade u 45 3.5 23.55 21.13 0.63 5.3 40 470 4.5 28.98 26.15v 0.19 5.6 13 w 0.20 5.8 8 461 5.5 31.64 28.61 x 0.29 6.2 0 206 6.5 33.02 29.88 xy 0.44 90 7.5 34.23 31.00 y 0.59 51 8.5 35.24 31.94 z 0.74 32 9.5 35.80 32.45 a Standard = 3 to 4; Select = 4 to 5; low Choice = 5 to 6; mid Choice = 6 to 7; high Choice = 7 to 8; low Prime = 8 to 9; mid Prime = 9 to 10. b Column means with different superscripts are significantly different at P < 0.05. c Taste panel scores (from 1 to 8) and percent unacceptable values are from a subset of this data base. This analysis showed that EBF was significantly (P < 0.05) higher with each incremental increase in grade up to the mid Choice grade. Taste panel scores and percent unacceptable followed the same trend. This data also indicated we can
correlate grade to changes in body composition as cattle grow. The most critical factor in this table for our model is the percent EBF at Standard (21.1%), Select (26.2%), and low Choice (28.6%) USDA grades since these are the body composition endpoints for different marketing targets used to identify feed requirements during growth. Accounting for differences in requirements for growth. Previous studies indicate cattle of different mature sizes have different fat and protein content of the weight gain at the same weight during growth (Fox and Black, 1984). Therefore we developed a size-scaling procedure to account for differences in energy and protein requirements for growth among cattle of different frame sizes and sexes (Fox and Black, 1984; Fox et al., 1988; Fox et al., 1992; Fox et al., 1999; Tylutki et al., 1994) which was adapted by the National Research Council Nutrient Requirements of Beef Cattle (NRC, 2000). This growth model was also found to be accurate for predicting requirements for dairy heifers (Fox et al., 1999), and was adapted for use in the Nutrient Requirements of Dairy Cattle (NRC, 2001). In this model, the animal’s weight at 28% fat (or mature weight if replacement heifers) is divided into the weight of the standard reference animal at that composition. This ratio is then multiplied by the animal’s actual weight to adjust it to the standard reference animal for use in the energy requirement equation developed by NRC (1984). The standard reference animal represents the cattle body size used to develop the equations to predict the net energy content of weight gain. Table 2 shows an example of requirements for growth computed with this model for two mature sizes of cattle. This table shows that as mature size increases, weight at the same energy content of gain increases, because larger size animals are at an earlier stage of growth at the same weight and therefore have more protein and less fat in the gain. It also shows that energy requirements increase with increasing stage of growth and rate of gain. Table 2. Relationship of stage of growth and rate of gain to body composition 28% fat weight, lb Weight during growth, lb 1100 lb 600 800 1000 1300 lb 708 944 1180 % of 28% fat wt. 55 73 91 ADG, lb/day 2.0 3.0 4.0
Net energy required, Mcal/day 3.23 4.01 4.74 5.04 6.26 7.40 6.92 8.58 10.14
Three data sets were used to test this system (NRC, 2000). With two of the data sets (82 pen observations of Bos taurus implanted steers and heifers varying in breed
type, body size and diet type and 142 serially slaughtered nonimplanted steers, heifers and bulls varying in body size aggregated by slaughter groups), this system accounted for 94% of the variation in energy retained with only a 2% underprediction bias. However, it cannot be assumed that this accuracy will apply to individual animals at a particular point in time during growth, since these results were obtained from pen averages and total energy retained. Many factors can alter estimates of finished weight of individuals, such as previous nutrition, implant programs, level of intake and energy derived from the diet, limits in daily protein and fat synthesis, and daily energy retained. The challenge is to be able to predict those effects in individual animals based on information that will be available in feedlots and is practical to apply. As a first step, Guiroy et al. (2002) has developed adjustments to finished weight for the effect of anabolic implants, which changes the finished BW from 31 to 92 lb for steers and 66 to 85 lb for heifers, depending on implant strategy. Accounting for differences in requirements for maintenance. The model used for this purpose is described by Fox and Tylutki (1998). The effects of breed type are 0.75 BW for Bos accounted for by adjusting the base NEm requirement of 77 kcal/kg indicus and dairy types (-10 and +20% compared to Bos taurus). The effects of previous nutrition are accounted for by relating body condition score to NEm requirement. On a 1 to 9 scale, maintenance requirement is reduced 5% for each condition score below 5 and is increased 5% for each score above 5. The effects of acclimatization are accounted for by adjusting for previous month’s average 0.75 BW at 30 oC to 105 kcal/kg0.75 BW at -20 oC). temperature (ranges from 70 kcal/kg o This adjustment is continuous, with no effect at 20 C. Current environmental effects are accounted for by computing heat lost vs heat produced, based on current temperature, internal and external insulation, wind, and hair coat depth and condition. This becomes important when the animal is below the computed lower critical o temperature, and can range from no effect at 20 C to twice as high (thin, dirty hide at o 12 C and 1 mph wind). Determining ration energy values. Accurate predictions of dry matter intake (DMI) and NEg are highly dependent on having feed net energy values that accurately represent the feeds being fed. Tedeschi (2001) evaluated the accuracy of alternative methods for determining feed energy and protein values: NRC level 1, which uses tabular values; NRC level 2, which uses the Cornell Net Carbohydrate and Protein System (CNCPS) model; and a summative equation commonly used by feed analysis laboratories to predict feed energy values from chemical composition (Weiss, 1993, 1999; Weiss et al., 1992). The regression analyses of observed and predicted ADG are shown in Table 3. Metabolizable energy (ME) was predicted by the CNCPS to be first limiting in 19 treatment groups. Across these groups, the observed ADG varied from 1.76 to 3.17 lb/d (0.8 to 1.44 kg/d). When ME was first limiting, the ADG predicted by the CNCPS model accounted for more of the variation (80%) than did the summative equation or tabular (73 and 61%, respectively). Metabolizable energy allowable ADG predicted with the tabular system gave an overprediction bias of 11%, but the bias was less
than 2% when predicted with the CNCPS or summative equation. The MSE were similar in all predictions, but the CNCPS model had the highest accuracy (lowest RMSPE). Metabolizable protein was predicted by the CNCPS to be first limiting in 28 treatment groups (Table 3). Across these groups, the observed ADG ranged from 0.26 to 3.0 lb/d (0.12 to 1.36 kg/d). The ADG predicted by the CNCPS model accounted for more of the variation (92%) than did the summative equation or tabular (79 and 80%, respectively). Metabolizable protein-allowable ADG predicted with the tabular gave an overprediction bias of 4%, whereas the bias was less than 2% when predicted with the CNCPS or summative equation. Similar to the ME first limiting analysis, the CNCPS model had the highest accuracy (lowest RMSPE: 0.11).
Table 3. Evaluation of the use of feed tabular energy values or predicted by a summative equation or by the rumen fermentation simulation model of the Cornell Net Carbohydrate and Protein System (CNCPS) to estimate ADG (kg/d) a when ME or MP are first limiting Min.
ADG, kg/d Mean ± SE
Max.
Regression statistics b r2 MSE bias,%
ME first limiting (n = 19) Observed NRC, 2000 Weiss et al., 1992 CNCPS v. 4.0
0.80 0.73 0.74 0.79
1.11 ± 0.04 1.25 ± 0.06 1.13 ± 0.06 1.10 ± 0.05
1.44 1.78 1.62 1.48
0.61 0.73 0.80
0.01 0.01 0.01
-11.4* -2.2 0.4
0.23 0.14 0.10
MP first limiting (n = 28) Observed NRC, 2000 Weiss et al., 1992 CNCPS v. 4.0
0.12 0.11 0.13 0.12
0.78 ± 0.07 0.81 ± 0.09 0.78 ± 0.09 0.77 ± 0.07
1.36 1.78 1.73 1.45
0.80 0.79 0.92
0.03 0.03 0.01
-4.3 -0.5 1.9
0.21 0.22 0.11
RMSPE
a
Data were obtained from Boin and Moura (1977), Fox and Cook (1977), Danner et al. (1980), Lomas et al. (1982), Abdalla et al. (1988), Ainslie et al. (1993), and Wilkerson et al. (1993) (only in the MP sub-dataset evaluation). b Observed values (Y) were regressed on predicted ADG (X) using tabular TDN (NRC, 2000) or predicted TDN by the Weiss et al. (1992) equation or CNCPS v. 4.0. A positive bias means that Y values (observed) are greater than X values. MSE is the mean square error from the regular regression, SE is the standard error, and RMSPE is the root of the mean square prediction error. Asterisks indicate statistical difference from zero using the t-test (unequal variance) at α=0.01 (**), α=0.05 (*), or no difference (no asterisk).
Predicting individual animal feed requirements The system of equations we developed (Guiroy et al., 2001) to predict individual animal feed requirements is summarized in Table 4, which is implemented in the
Cornell Value Discovery System (Tedeschi et al., 2002). Feed net energy values used in this model are determined as described in the previous section. Individual feed required is the sum of the feed required for maintenance (FFM), and the feed required for growth (FFG). Feed for maintenance is a function of the net energy required for maintenance and the net energy value of the diet for maintenance (NEm). Similarly, FFG is a function of the energy retained in the weight gain (NEg) and the NEg concentration of the diet. Animal differences in mature body size are accounted for as described previously. Perry and Fox (1997) and Guiroy et al. (2001) presented a detailed description of the development of these equations. Table 5 shows a summary of the calculations for an actual Angus steer fed in a group pen. a
Table 4. Equations to predict individual dry matter requirements (1) EBW = 1.316 HCW + 32.29; (Garrett, 1987) (2) EBF, % = 17.76207 + 4.68142 FT + 0.01945 HCW + 0.81855 QG – 0.06754 LMA (3) AFSBW = (EBW + ((28 - EBF%) x 14.26)) / 0.891 (4) EQSBW = SBW (478/AFSBW); (NRC, 2000) (5) RE = 0.0635 x EQEBW0.75 x EBG1.097; EQEBW is 0.891xEQSBW; (NRC, 2000) (6) FFG = RE/diet NEg (7) FFM = NEm required/diet NEm; NEm required can be calculated as described by Fox et al. (1992) and NRC (2000) (8) Individual DM required is FFM + FFG (9) Adjusted individual DM required = individual DM required x (total actual pen DM consumed/ total pen DM required) a EBW = empty body weight; EBF = empty body fat; FT = fat thickness (cm); HCW = 2 hot carcass weight; QG = quality grade; LMA = Longissimus dorsi muscle area (cm ); SBW = shrunk body weight; AFSBW = weight at 28% body fat; EQSBW or EQEBW = shrunk or empty body weight equivalent to the standard reference animal; EBG = empty body gain; RE = retained energy, Mcal/day; FFM = feed for maintenance; FFG = feed for gain; and DM = dry matter. Evaluation of the CVDS feed required model. The set of equations to predict dry matter required by individuals (Table 4) was evaluated with data from the studies of Nour (1982), Perry et al. (1991), Perry and Fox (1997) and Guiroy et al. (2001). This data set included 365 individually fed steers of diverse biological types in which chemical body composition was determined and carcass measurements were taken, and complete information on feeds fed were available to accurately predict diet net energy values in each experimental group. Guiroy et al. (2001) presented a complete description of this data base. Table 5. Example calculation with the feed requirement model Inputs Results Initial shrunk weight = 713 lb Daily gain = 4.64 lb
a
Final shrunk weight = 1265 lb 28% fat weight = 1241 lb Days on feed = 119 Net energy for gain = 10.82 Mcal/day Hot carcass weight = 803 lb Feed DM for gain = 17.64 lb/day Quality grade = 5.0 Net energy for maintenance = 6.83 lb/day Rib eye area = 79.4 cm2 Feed DM for maintenance = 7.49 lb/day Backfat depth = 1.5 cm Total feed DM required = 25.16 lb/day Diet NEm = 0.91 Mcal/lb Feed efficiency = 5.42 Diet NEg = 0.61 Mcal/lb a Group inputs included pen dry matter intake for the entire feeding period, and ration NEm and NEg values. We evaluated DM requirements predicted by the Cornell Value Discovery System against actual DM consumed (Guiroy et al., 2001). The equations presented in Table 4 accounted for 74% of the variation in actual DM consumed, with essentially no bias (0.34%) and a coefficient of variation of 8.18%. The equation shown in Table 4 to predict EBF percentage from carcass measurements commonly taken in U.S. packing plants was developed with a large database (Guiroy et al., 2001). This equation accounted for 61% of the variation in EBF with a coefficient of variation of 11.9% and no bias since the intercept and the slope of the regression equation were not different (P > 0.10) from zero and one, respectively. This equation was validated with a separate data base of 951 steers and heifers from a variety of breeds and diets fed; it explained 51% of the variation in EBF%, with a coefficient of variation of 10.7% and no bias. The 39% of the variation in EBF in the development data base and 49% of the variation not explained by this equation in the evaluation data base can be explained by the variation in the carcass measurements used by the equation at a similar empty body fat (Guiroy et al., 2001). When the same analysis to predict individual feed requirements evaluated using this predicted rather than the observed EBF (%), the variation accounted for by the model was not reduced. This result indicates that we can accurately predict individual feed requirements using a prediction of EBF from carcass measurements available from U.S. packing plants. However, an alternative approach is needed to predict AFSBW. A small data set was available to evaluate the ability of model equations that use hip height and age to predict AFSBW. The data set consisted of 29 bulls of five different breeds fed to finished weights. When only SBW, hip height and age were available to predict AFSBW, the regression accounted for 58% of actual AFSBW variation. However, when carcass measurements from ultrasound on the live animal were used to generate inputs for the equation of Guiroy et al. (2001) to predict AFSBW, the regression 2 between observed and predicted AFSBW had an r of 0.75. Feed required for the observed ADG with AFSBW computed with hip height and age or with ultrasound used to predict carcass fat depth, rib eye area and quality grade accounted for 93 and 96%, respectively of the variation in feed required with AFSBW computed from actual carcass measures. These results suggest the use of ultrasound can be used to obtain fat depth, rib eye area, and marbling values required by the Guiroy et al. (2001) equation to predict AFSBW.
In common feedlot situations, each owner owns more than one animal in a pen. Therefore a concern is the accuracy of predicting the total of their animals’ share of the total feed consumed by the pen. A reduction in the error of prediction of DM required is expected when predicting groups of animals instead of individuals within a pen. To measure this reduction, the predicted and observed individual DM requirements of the 365 individually fed animals used to validate our feed allocation model were summarized by groups of 5, 10, 20, 40, or 80 animals; these groups were randomly created for this analysis. The coefficient of variation was reduced more than 50% (from 8.18 to 3.76%) when predicting DM required for groups of 5 animals instead of individuals, and was less than 2% in groups of more than 20 animals. This analysis showed that even though we can account for 74% of the variation in individual animal feed requirements with a coefficient of variation of 8.18, the error in our prediction is greatly reduced when predicting groups of animals, which is an important concept for producers using this system to allocate feed consumed among groups of cattle within a pen. A feedlot data set of 12,105 steers and heifers was developed to evaluate the feed allocation model in the CVDS. The feedlot data was provided by Dr. Matt Cravey, Micro Beef Technologies, Inc. (Amarillo, TX), which was collected with their computerized electronic individual cattle-tracking system. Total feed DM delivered vs the sum of each individual animal predicted DM required was compared using our model. Results from this evaluation shows DM required was predicted with very little bias with our modified model (underprediction of –0.91% for steers, and overprediction of 0.89% for heifers). The small bias for each sex indicates the model works equally well for steers and heifers. An underprediction bias of up to 2% in the total DM consumed by feedlot cattle can be expected due to feed fed that was lost and not consumed by cattle (bunk cleaning, wind, etc). A bias is also expected by using a 0.75 SBW, which likely varies within fixed maintenance requirement of 0.077 Mcal/d/kg and between feedlots due to animal interactions with actual environmental conditions. However, in this data set evaluated, the effects of environment are accounted for in the diet NEm and NEg provided by the feedlot consultant, since those values reflect diet NE values required to have predicted and observed ADG agree in the historical data base used to develop their performance projection program.
Using the Cornell Value Discovery System DAYSTEP model to predict feed required over the same stage of growth During most post-weaning growth programs (progeny tests in feedlots; bull tests) calves are fed for either a fixed period of time (bull and heifer tests; commodity fed in commercial feedlots) or until finished (individual cattle management systems; ICMS). For example, a calf fed post weaning from 500 to a 28% fat weight of 1200 lb had a mean body weight of 850 lb (71% of 28% fat weight), while another calf fed from 700 to a 28% fat weight of 1200 lb had mean body weight of 950 lb (79% of 28% fat weight). The expected feed required for the second calf would reflect an average higher fat content of the gain because of being farther along the growth curve when started. Therefore adjustments are needed to be able to compare their feed requirements over the same stage of growth. The CVDS contains a DAYSTEP model that utilizes the maintenance and growth and feed energy models described previously along with an feed intake model to predict daily gain, body weight, and feed required on a daily basis as an animal grows (Fox et al., 2001; Tedeschi et al., 2002) to their observed final weight. Because the CVDS model computes daily energy requirements, DMI, and body weight, the computation of the predicted feed required during a common stage of growth (from 60 to 80% of mature or finished weight) for each animal allows us to compare animal performance, accommodating the wide range of post-weaning feeding programs under which progeny are evaluated. Within the CVDS is a DAYSTEP model that predicts DMI and ADG for each day while on feed. The predicted DMI is iterated until predicted and observed ADG of that period match. The predicted DMI is internally interpolated using the relative DMI (RDMI) factor. Then feed required is computed from 60 to 80% of their 28% fat weight. The NRC (2000) provided DMI equations that can be used to account for the effects of variables that influence individual animal performance in each production situation: diet energy density, degree of maturity, and environment (temperature and mud effects). Therefore, we used a modified version of the DMI equations and adjustments adopted by NRC (2000) in our DAYSTEP model. Table 6 summarizes the sequence of calculations in the DAYSTEP model used to predict days required to reach a target composition.
Step 1 2 3 4
5 6 7 8 9 10 11
Table 6. Sequence of calculations in the DAYSTEP model Description Determine NEm and NEg concentration of the diet using the CNCPS model Determine the expected shrunk body weight (SBW) at 28% body fat (Choice AFSBW) Predict daily DMI based on current SBW, diet energy, environmental conditions, and Choice AFSBW Predict feed required for maintenance (FFM, kg) based on current SBW and environmental conditions as follows: FFM = NEm required / diet Nem Predict NE available for gain (NEFG, Mcal) from DMI and diet NEg ; NEFG = (DMI – FFM) × diet Neg Predict daily Shrunk Weight Gain (SWG) from NEFG and the current SBW equivalent to the standard reference animal (EQSBW) Compute the new SBW of the animal by adding SWG in step 6 to the initial SBW Repeat steps 5 to 9 for each additional day until animal reaches actual finished SBW Adjust predicted DMI until actual and predicted ADG match Compute body weight at 60 and 80% of 28% fat weight Predict ADG and feed required for the growth period between 60 and 80% of 28% fat weight.
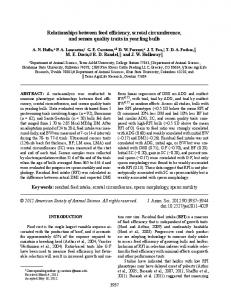
Evaluation of the DAYSTEP model in predicting growth and feed efficiency predictions. The previously described data base containing 365 individually fed steers with measured body composition and feed energy values predicted with the CNCPS version 4.0 were used to evaluate the DAYSTEP model predictions. The model accounted for 90% of the variation in individual animal ADG with no bias and deviation tendency. As a result, the observed weight at the actual total days on feed was 2 accurately predicted (r of 0.86) with no bias and no deviation tendency. When ADG was predicted using the mean body weight and actual DMI, the variation accounted for was reduced to 80%, compared to the model daily DMI adjusted for the overall ratio of actual/predicted DMI. This approach results in a higher DMI early and lower DMI later in the feeding period relative to body weight and compposition, in agreement with the data of Thornton et al. (1985). We then evaluated observed vs predicted feed efficiency in this data set using the DAYSTEP model. The model accounted for 83% of the variation in actual feed efficiency with no systematic bias (Figure 1). These results indicate the use of Cornell Net Carbohydrate and Protein System model (Fox et al., 2000) to predict feed energy values and the Cornell Value Discovery System model (Fox et al., 2001; Tedeschi et al., 2002) to predict individual animal feed requirements from body weight, ADG and body composition accounted for all but 17% of the differences in feed efficiency.
Observed feed efficiency, lb/lb
12 10 8 y = 1.0144x - 0.0888 2 R = 0.8301
6 4 2 0 -2 4
6
8
10
12
Predicted feed efficiency, lb/lb
Figure 1. Comparison of observed and predicted feed efficiency (DMI lb/ ADG lb) (_) and residual (+, observed minus predicted) of 297 individually-fed steers. The variation not accounted for in this system (17%) is due to individual animal variations that the system cannot fully account for, including differences in maintenance requirements, diet digestibility and metabolizability, and body composition. Adjustment for prediction errors are made when determining individual animal costs by multiplying the ratio of the total actual pen DM consumed to the total pen DM required times each animal’s DM required (Equation 9 in Table 4). The acceptance by producers of this approach to allocating feed has been high. As indicated earlier, predicted feed efficiencies to be used for genetic evaluation should be computed over the same stage of growth. We used this data base of individually fed animals to regress actual feed efficiency on three alternative criteria for evaluating feed efficiency (Figure 2). First, the DMI, ADG and mean SBW were computed over the same stage of growth (SRu) (from 0.6 to 0.8 degree of maturity) with the DAYSTEP model, using 28% EBF as the mature weight. Then three variables related to feed efficiency were computed, including (a) DMI/ADG, kg/kg; (b) ADG/DMI, g 0.75 0.75 of mean SBW. /kg; and (c) ADG/SBW , g /kg
y = 0.6 469x + 2.44 48 R 2 = 0.71 88
15
C
13 11 9 7 5 3 3
8
Obs. overall feed eff., kg/kg
Obs. overall feed eff., kg/kg
A
13 11 9 7 5 3 5
13
D
15 -0 .6 0 56
y = 140.68x R2 = 0.708
13 11 9 7 5 3 50
150
250
SRu feed efficiency, g/kg
Obs. DMI - Pred. DMR, kg
Obs. overall feed eff., kg/kg
15
25
35
Me tabo lic fee d efficiency, g/kg0.75/d
SRu fe ed e fficien cy, kg/kg
B
y = 33.81 7x-0.5997 R 2 = 0.69 25
15
y = -0.1302x + 1.0 492 R 2 = 0.070 2
2 1.5 1 0.5 0 -0.5 -1 -1.5 -2 5
10
15
Pred. DM re quire d, kg
Figure 2. Comparison of overall feed efficiency with feed efficiency at same stage of growth in DMI/ADG (A) and ADG/DMI (B), metabolic feed efficiency (C), and (D) residual analysis of DMI observed and DMR predicted by the model. Because an average of 30% of the variation in feed efficiency was not accounted for by these measures, figure 2 panels A, B, and C indicate that the feed efficiency computed over the same stage of growth is needed, whether expressed as kg DMI/kg 0.75 ADG, g ADG/kg DMI, or g ADG/kg BW . Panel C also shows that dividing the ADG by the metabolic mean BW gives a value that is highly related to feed efficiency. The logic of this measure is that maintenance requirement is accounted for by dividing ADG by metabolic body weight during the same stage of growth. The animals with a high ADG per unit of metabolic body weight had better overall feed efficiencies with less variation, suggesting this value could be used to select for feed efficiency. Using the same data base, panel D of Figure 2 shows no bias in prediction of dry matter required for individual steers, indicating the CVDS model consistently predicted actual dry matter intake across wide variations in animal type. Due to the interest in evaluating individuals for differences in residual feed intake (RFI), we used our data base to compare our feed required approach with the residual feed intake approach to identifying differences in feed efficiency. First, actual DMI or DMI required was regressed on ADG and metabolic body weight. Then actual
DMI for each animal was subtracted from DMI predicted with each of these two equations. The feed required approach accounted for more of the variation with less bias (figure 3), likely because of accounting for differences in composition of gain. Thus the advantages of predicting feed efficiency from feed required to evaluate animals for feed efficiency are: 1) it is not necessary to measure individual feed intake, and 2) differences in body composition are accounted for, and 3) feed required values reflect the effects of environment on maintenance requirements and diets fed to the animals being compared. A
B
2.0
1.5
1.5
1.0
1.0
Residual, kg
Residual, kg
2.0
0.5 0.0 -0.5
0.5 0.0 -0.5
-1.0
-1.0
-1.5
-1.5
-2.0
-2.0 5
7
9
Predicted DMI, kg
11
5
7
9
11
Predicted DM Required, kg
Figure 3. Residual feed intake analysis with 284 individually-fed steers. (A) 0.75 Regression of dry matter intake on ADG and mean BW . The regression was Y = 0.75 with an R2 of 0.72 and MSE of 0.45. (B) Regression 0.83 + 2.33_ADG + 0.068_BW 0.75 of dry matter required on ADG and mean BW . The regression was Y = 5.45 – 0.75 + 0.051_ADG_BW0.75 with an R2 of 0.80 and MSE of 0.37. 1.68_ADG - 0.0095_BW
Example application of the Cornell Value Discovery System in evaluating pen fed bulls Data from the New York State Bull test conducted from December 16, 2000 to April 7, 2001 with 93 bulls are used to demonstrate how the CVDS is used to predict feed efficiency for individual bulls being evaluated. The diet ingredients were analyzed for NDF, lignin, crude protein, soluble protein, and cell wall-bound protein for use in the CNCPS model to predict the diet energy content (ME of 1.25 Mcal/lb DM). The diet formula and CNCPS ME value were entered into the CVDS program along with each individual animals’ information (initial and final body weight, hip height and age, and ultrasound fat depth, ribeye area, and marbling, and body weight at the time of ultrasound). Empty body weight (EBW) was computed from shrunk body weight (SBW) multiplied by 0.891 and hot carcass weight (HCW) was computed from EBW using
Garrett’s equation (Garrett, 1987, Table 4). Hip height and age was used to compute frame score and 28% fat weight as described by Fox et al. (1992), and the ultrasound information was used to predict 28% fat weight using the equations of Guiroy et al. (2001) as described in Table 4 (steps 2 and 3). The DAYSTEP model in the CVDS was then used to compute the feed required for each animal over the actual feeding period, and during the same stage of growth, as described in Table 5.
Percentage of actual feed fed
Before computing individual feed efficiencies and cost of gain, we first determine if the sum of individual feed requirements agree with the total of the feed actually fed over the feeding period. This provides a check on the accuracy of the inputs (diet energy values, and animal inputs and measurements), and how well the model is working in this situation. Figure 4 shows the percentage of the total feed DM consumed that was predicted by the sum of the individual bull predicted feed required for the observed ADG.
100 90 80 70 60 50 40 30 20 10 0 Actual
Using ultrasound Using frame score
Mean BW
Daystep model
Prediction methods
Figure 4. Comparison of feed actually fed and required as predicted by the Cornell Value Discovery System using ultrasound or frame score to predict 28% fat weight. The actual amount fed was 244,930 lb. Two approaches of predicting feed required were compared; using mean body weight or using body weight accumulated on a daily basis with the DAYSTEP model. Within each, 28% fat weight was predicted by the two methods (hip height and age or ultrasound). Feed actually fed was predicted within 1 to 2% whether using mean BW or DAYSTEP approaches. The accuracy was not affected by using either frame score or ultrasound to predict AFBW. Our results indicate the DAYSTEP model accurately predicted the amount of feed required across all bulls, and gives us confidence in the individual bull feed efficiencies predicted by the CVDS model.
The animal performance data (average, minimum, maximum, and SD) are summarized in Table 7. The feed required data are computed for each animal for the entire 112 day test and the feed efficiency data are for the same stage of growth. Table 7 shows that there was considerable variation in age and initial and final weight, indicating differences in stage of growth during the test. Thus the large differences in feed required reflect differences in average weight and stage of growth as well as intake over maintenance. For that reason, the feed efficiency for each bull that was computed for the same stage of growth by the CVDS model is the value that should be used in genetic evaluations for feed efficiency. Then, the most efficient animals post weaning are those that have the highest feed efficiency and are within the window of acceptability on finished weight at the target composition and grade. a
Table 7. Description and performance of bulls during a performance test Variables Average Min Max SD Age, mo 9.4 7.6 11.5 1.2 Initial BW, lb 857 551 1158 133 Final BW, lb 1280 860 1620 161 b 1337 1091 1467 80 AFBW by FS , lb b 1304 951 1643 138 AFBW by US , lb ADG, lb/d 3.63 2.21 4.73 0.47 Feed Required, lb/d 24.1 15.6 30.8 2.74 c Feed efficiency DMI/ADG, lb/lb 6.68 5.81 7.53 0.31 ADG/DMI, g/kg 150.1 132.8 172.1 7.05 0.75 0.75 21.6 20.8 25.5 0.99 ADG/BW , g/kg a Database contained 93 bulls fed during a 112 d test. b Adjusted final BW based on Frame Score (FS) and Ultrasound (US). c Using AFBW computed by frame score.
Summary The Cornell Value Discovery System provides a method for determining feed required for individuals fed in a group on a biological basis, considering differences known to affect requirements (breed type, body weight and mature size, stage and rate of growth, and diet composition). An analysis of our data indicated these variables accounted for 83% of the variation in feed efficiency; the remaining 17% of the variation in feed efficiency (primarily differences in basal maintenance requirement and efficiency of use of absorbed energy) are, at present, impractical to measure in commercial feeding situations. The only way we know of for estimating ME efficiency is to measure individual feed intake and diet metabolizability at maintenance and production levels of intake.
For steer and heifer progeny finished in feedlots, feed required for individuals can be determined by using a prediction of final EBF from carcass measures to determine feed required for growth for the purposes of accurately allocating cost to individual animals. For herd replacement animals, feed required for individuals can be determined by using ultrasound measurements needed by the equation used to predict body fat and expected 28% fat weight. In both situations, the DAYSTEP model in the CVDS can be used to predict feed efficiency over the same stage of growth.
References Abdalla, H. O., D. G. Fox, and M. L. Thonney. 1988. Compensatory gain by Holstein calves after underfeeding protein. J. Anim. Sci. 66:2687-2695. Ainslie, S. J., D. G. Fox, T. C. Perry, D. J. Ketchen, and M. C. Barry. 1993. Predicting amino acid adequacy of diets fed to Holstein steers. J. Anim. Sci. 71:1312-1319. Archer, J. A., E. C. Richardson, R. M. Herd, and P. F. Arthur. 1999. Potential for selection to improve efficiency of feed use in beef cattle: a review. Aust. J. Agric. Res. 50:147-161. Boin, C. and M. P. Moura. 1977. Comparação entre dois níveis de proteína bruta e entre dois níveis de energia para zebuínos em crescimento. B. Indústr. Anim. 34:155-163. Carstens, G. E., C. M. Theis, M. B. White, T. H. Welsh Jr., B. G. Warrington, R. D. Randel, T. D. A. Forbes, H. Lippke, L. W. Greene, and D. K. Lunt. 2002. Residual feed intake in beef steers: I. Correlations with performance traits and ultrasound measures of body composition. in Proc. of the Western Section of American Society of Animal Science (in press). Danner, M. L., D. G. Fox, and J. R. Black. 1980. Effect of feeding system on performance and carcass characteristics of yearling steers, steer calves and heifer calves. J. Anim. Sci. 50:394-404. Fox, D. G. and J. R. Black. 1984. A system for predicting body composition and performance of growing cattle. J. Anim. Sci. 58:725-739. Fox, D. G. and R. J. Cook. 1977. Performance of steer calves fed corn silage treated with three sources of anhydrous ammonia. Research Report No. 328. Michigan State University, East Lansing. Fox, D. G., C. J. Sniffen, and J. D. O'Connor. 1988. Adjusting nutrient requirements of beef cattle for animal and environmental variations. J. Anim. Sci. 66:1475-1495. Fox, D. G., C. J. Sniffen, J. D. O'Connor, J. B. Russell, and P. J. Van Soest. 1992. A net carbohydrate and protein system for evaluating cattle diets: III. Cattle requirements and diet adequacy. J. Anim. Sci. 70:3578-3596. Fox, D. G., L. O. Tedeschi, and P. J. Guiroy. 2001. A decision support system for individual cattle management. Pages 64-76 in Proc. Cornell Nutr. Conf. Feed Manuf., Rochester, NY. Fox, D. G. and T. P. Tylutki. 1998. Accounting for the effects of environment on the nutrient requirements of dairy cattle. J. Dairy Sci. 81:3085-3095. Fox, D. G., T. P. Tylutki, M. E. Van Amburgh, L. E. Chase, A. N. Pell, T. R. Overton, L. O. Tedeschi, C. N. Rasmussen, and V. M. Durbal. 2000. The Net Carbohydrate and Protein System for evaluating herd nutrition and nutrient excretion: Model documentation. Mimeo No. 213. Animal Science Dept., Cornell University, Ithaca, NY. Fox, D. G., M. E. Van Amburgh, and T. P. Tylutki. 1999. Predicting requirements for growth, maturity, and body reserves in dairy cattle. J. Dairy Sci. 82:1968-1977. Garrett, W. N. 1987. Relationship between energy metabolism and the amounts of protein and fat deposited in growing cattle. Pages 98-101 in Proc. Energy Metab., 10, Virginia.
Guiroy, P. J., D. G. Fox, L. O. Tedeschi, M. J. Baker, and M. D. Cravey. 2001. Predicting individual feed requirements of cattle fed in groups. J. Anim. Sci. 79:1983-1995. Guiroy, P. J., L. O. Tedeschi, D. G. Fox, and J. P. Hutcheson. 2002. The effects of implant strategy on finished body weight of beef cattle. J. Anim. Sci.:(in press). INRA. 1989. Ruminant nutrition. Recommended allowances and feed tables. Institut National de la Recherche Agronomique, John Libbey Eurotext, Montrouge, France. Leme, P. R., C. Boin, R. C. C. Margarido, L. O. Tedeschi, J. C. O. F. V. Hausknecht, G. F. Alleoni, and A. Luchiari Filho. 2000. Growth performance in feedlot and carcass characteristics of beef cattle from several crossbreds slaughtered in three body weight ranges. Rev. Bras. Zootec. 29:2347-2353. Lomas, L. W., D. G. Fox, and J. R. Black. 1982. Ammonia treatment of corn silage. I. Feedlot performance of growing and finishing steers. J. Anim. Sci. 55:909-923. Nour, A. Y. M. 1982. Bovine carcass characteristics, quality, yield, palatability, chemical composition, and mineral profile of early and late maturing breeds of cattle fed two diets in two locations and serially slaughtered over a wide weight range. Ph.D. Dissertation, Cornell University, Ithaca. NRC. 1984. Nutrient Requirements of Beef Cattle (6th ed.). National Academy Press, Washington, DC. NRC. 2000. Nutrient Requirements of Beef Cattle (updated 7th ed.). National Academy Press, Washington, DC. NRC. 2001. Nutrient Requirements of Dairy Cattle (7th ed.). National Academy Press, Washington, DC. Perry, T. C. and D. G. Fox. 1997. Predicting carcass composition and individual feed requirement in live cattle widely varying in body size. J. Anim. Sci. 75:300-307. Perry, T. C., D. G. Fox, and D. H. Beermann. 1991. Effect of an implant of trenbolone acetate and estradiol on growth, feed efficiency, and carcass composition of Holstein and beef steers. J. Anim. Sci. 69:4696-4702. Tedeschi, L. O. 2001. Development and Evaluation of Models for the Cornell Net Carbohydrate and Protein System: 1. Feed Libraries, 2. Ruminal Nitrogen and Branched-Chain Volatile Fatty Acid Deficiencies, 3. Diet Optimization, 4. Energy Requirement for Maintenance and Growth. Ph.D. Dissertation, Cornell University, Ithaca, NY. Tedeschi, L. O., D. G. Fox, and M. J. Baker. 2002. The Cornell Value Discovery System: A decision support system for individual cattle management. Cornell University, Ithaca, NY. Thornton, J. H., F. N. Owens, and D. R. Gill. 1985. Feed intake by feedlot beef steers: Influence of initial weight and time on feed. Animal Science Research Report No. MP-117. Oklahoma State University, Stillwater, OK. Tylutki, T. P., D. G. Fox, and R. G. Anrique. 1994. Predicting net energy and protein requirements for growth of implanted and nonimplanted heifers and steers and nonimplanted bulls varying in body size. J. Anim. Sci. 72:1806-1813. Weiss, W. P. 1993. Predicting energy values of feeds. J. Dairy Sci. 76:1802-1811. Weiss, W. P. 1999. Energy prediction equations for ruminant feeds. Pages 176-185 in Proc. Cornell. Nutr. Conf. Feed Manuf., Rochester, NY.
Weiss, W. P., H. R. Conrad, and N. R. St. Pierre. 1992. A theoretically-based model for predicting total digestible nutrient values of forages and concentrates. Anim. Feed Sci. Technol. 39:95-110. Wilkerson, V. A., T. J. Klopfenstein, R. A. Britton, R. A. Stock, and P. S. Miller. 1993. Metabolizable protein and amino acid requirements of growing cattle. J. Anim. Sci. 71:2777-2784.