Oct 8, 1999 - By Do-Hun Lee*, Eun-Tae Lee** and Joo-Heon Lee***. Abstract. In the stream-aquifer setting entered by nonpoint source contaminants, ...
I KSCEJournal of Owl[ Enr Vol 2, No 2 / J ~
1998
[pp 137~152
[WaterEn~nserlng I
[
Determining the Relationship between Average Concentration of Saturated Aquifer and Groundwater Outflow subject to Nonpoint Source Contaminants By Do-Hun Lee*, Eun-Tae Lee** and Joo-Heon Lee***
Abstract In the stream-aquifer setting entered by n o n p o i n t source contaminants, numerical simulation analyses for the coupled advection-dispersion and Richards equations were p e r f o r m e d to evaluate and quantify the impacts o f transport controlling factors o n the relationship b e t w e e n average concentration o f saturated aquifer and groundwater o u t f l o w concentration , and o n the d y n a m i c responses o f and variables. As c o m p a r e d to the previous studies, the unique features o f this study were to include unsaturated f l o w effect and to p r o v i d e the physical basis and quantification for the - relationship. N u m e r i c a l simulation results s h o w e d that - relations exhibited nouiinear, looping behaviour and were sensitive to the changes o f dispersivity and aquifer thackness parameters. Furthermore, and responses were significantly affected b y these t w o factors o f dispersivity and a q m f e r thickness. F o r unsaturated-saturated f l o w condition, the significant impact of dispersivity values o n the groundwater o u t f l o w concentration response might have an i m p o a a n t implication for m o d e l i n g the responses.
Keywords
1
nonpoint source, groundwater o u ~ o w quality, unsaturated flow, advection-dispersion equatior~ numerical analysis
Introduction
N o n p o i n t source pollution in groundwater might be a major challenge for agricul-
tural area and environmental m a n a g e m e n t in the ecosystems. In this paper, numerical simulation approach is adopted for understanding the m o v e m e n t o f the spatially
* Asst. Prof,, Dept of Civil Engr, Kyung Hee Unlv, KyungKi-Do, Korea ** Prof, Dept of Cwd Engr., K}ung Hee Untv, KyungKl-Do. Korea *** Full-Time Lecturer, School of Construction Engr. Joong Bu Umv, ChungNam, Korea The manuscript for rbas paper was subrmtted for review on August 22, 1997 Vol 2, No 2 / June 1998
-137-
By Do-Hun Lee, Eun-Toe Lee and .fo~Heon Lee
distributed contaminant inputs and quantifying the interaction o f mass fluxes between stream and unconfined aquifer. From a scientific perspective, the techniques for prediction, analysis, and control o f nonpoint source pollution in groundwater are still incomplete and need to be improved. Gelhax and Wilson (1974) proposed "lumped parameter model" based on the well mixing assumption and mass balance o f average solute concentration, and applied the model to assess the effect o f distributed source o f highway deicing salts on groundwater quality. In this context 'well mixing assumption' implies that groundwater outflow concentration is equal to the average concentration of saturated unconfined aquifer. The lumped parameter model ignores spatial coordinates and can evaluate only temporal variations o f average solute concentration. But the model has simple structure and might be applicable when the data on aquifer properties are limited. McLin (1981) formulated the generalized lumped parameter model by extending the lumped parameter model of Gelhar and Wilson (1974) to account for the stratified aquifer system. And then he compared groundwater outflow concentration responses with lumped parameter model, linearized I)upuit aquifer model, and Laplace aquifer model. In addition to this, the lumped parameter model was tested by field application to the irrigated stream-aquifer setting along Arkansas River Valley and Mesilla Valley. Numerical experiments were applied by Dully and Lee (1992) to the problem o f modeling groundwater outflow quality originating from nonpoint source in 2 dimensional idealized stream-aquifer system. Numerical analysis explored the effects o f the spatial variations in the initial aquifer concentration, nonpoint source contaminant, the saturated hydraulic con-
ductivity on the dynamic response o f groundwater outflow concentration as well as the deterministic effects o f dispersivity ratio, aquifer thickness, and the isotherm equilibrium sorption process. And then they compared groundwater outflow concentration o f lumped parameter model with that o f distributed model. All o f these modeling studies have not accounted for the important role o f unsaturated flow effect in modelling pratices and have not examined in detail the well mixing assumption o f lumped parameter model. So in order to improve the lumped parameter model, there is a need to understanding the structure o f relationship between average concentration o f saturated aquifer and groundwater outflow concentration, and to exploring the role o f unsaturated flow on controlling both average aquifer concentration and groundwater outflow concentration dynamics. In this paper, coupling o f Richards equation and advection-dispersion equation enabled us to investigate the unsaRLrated zone effect on modeling nonpomt source pollution problem using a finite element technique in an idealized 2-D system with the uniformly distributed parameter values. Especially, the paper focuses on quantifying and identifying the effects o f the variations in dispersivity, stream penetratia~g depth, rainfall rate, aquifer thickness, soil type on the relationship between the average concentration o f unconfined aquifer and groundwater outflow concentration, and the dynamic response o f groundwater outflow concentration resulting from the spatially distributed source.
2. Statement of the Problem Consider a typical tem shown in Fig. presents the vertical sional real system. In
- 138 -
stream-aquifer sys1. This system reslice o f 3 dimenthe figure the char-
KSCE Journal of Civil Engineering
Determining the RelaUonsPup between Average Concentratton of Saturated Aqu(er and Groundwater OuOTow subject to Nonpomt Source Contaminants acteristic length o f the system is represented by L and the characteristic depth o f the aquifer is designated by H. Along the fight boundary the stream was modelled by the hydrostatic pressure condition and the penetrating depth o f the stream was represented by do. Since it was assunned that no fluxes were exchanged along the boundary A-B, B-C, C-D, nonpoint sources entered from the ground surface A-F were transported through unsaturated and saturated soils and discharged into the stream boundary D-E. Under these conditions, we can define the following integrated variables by the space integration o f the pertinent variables. For the unsaturated soil zone, the unsaturated soil moisture storage, V~(t) and the average concentration o f unsaturated soil zone, are respectively defined as below.
v.( t] = f f , o( ., t>d~d~
(]) In Eq. (1), uz stands for the tmsaturated flow zone; 0 indicates soil moisture content, C(x~t) is solute concentration; < > implies the average operator. The saturated aquifer water storage V~(t) and the average concentration o f saturated aquifer are respectively defmed as follows. V~(t) = f f~ 0,( x, t)&dx
=
are given as the following integral
=
f fj
. .)d8
(3)
In integral (3), the double integral axe specified by recharge boundary surface, rb, and v(x, t ) . n is a recharge flux norreal to the recharge boundary. The groundwater outflow Q(t) and the average concentration o f groundwater outflow can be determined by integrating Darcy flux "v(x, t) - n and concentration o f groundwater outflow along outflow boundary, ob as follows.
Q( t) = f L v( x, t) . ndB
f s
,,(x,O - ,,)c( x, O~B
f
=
(4)
n)dB
All o f the integrated variables m integrals (1), (2), (3), and (4) becomes a function o f time and neglects space coordinate because o f the space integration process. With the integrated variables defined above, the problem is to calculate integrated variables o f V~(t), , O(t), through numerical analyses and then to investigate the effects o f relationship between and and the dynamic responses o f and subject to the changes in the geometric and soil hydraulic properties, A
.
i
P
and . T a b l e 3 s u m m a r i z e s the coefficients for linear fitting m o d e l and T a b l e 4 for nonlinear m o d e l s fitted to simulated relations. Cases 1, 19, 20 o f flushing cases and cases 10, 22, 23 o f step input cases exhibit similar b e h a v i o u r for - relations. Vol. 2, No. 2 / June 1998
0.6 - ~
I
0.20.00.0
I
0.2
I
I
0.4 0.6
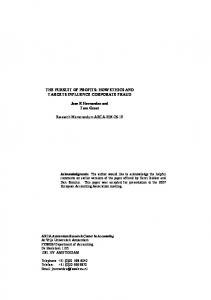
Fig. 5. The Effect of S t r e a m
I
I
0.8
1.0
D e p t h on ( C , ) -
(Ca) Relations.
H o w e v e r , for cases 21 and 24 o f w h i c h s t r e a m penetrating d e p t h is 7 0 % o f aquifer thickness H, the m a g n i t u d e o f l o o p i n g b e h a v i o u r tends to be s m a l l e r t h a n other cases, a n d - relation approaches the linear relation, w h i c h can also b e r e c o g n i z e d b y a, b, t ~ values in cases 21 and 24 in T a b l e 3. The effects o f s t r e a m p e n e t r a t i n g d e p t h on and r e s p o n s e s are s h o w n in Fig. 6. T h e r e s p o n s e s s h o w similar b e h a v i o u r e x c e p t f o r case 24 o f the deepest s t r e a m d e p t h w h o s e re-
- 147 -
By Do-Hun Lee, Eun-Tae Lee and foo-Heon Lee
1.0-
1.0--
f
08-
~
_
_
08easel0
0.6-
/ft,,"
----. casr
^ 0.6-
~
0.4-
casel0 case22 ease23 case24
0.20.0
0
I
1
I
I
1
2 trr,
3
4
0.0
I 1
0
I 2
I 3
t/Ts
Fig. 6. The E f f e c t of S t r e a m Depth on ( C , ) and ( C D R e s p o n s e s .
sponse is slightly lower than other cases. And responses exhibit almost identical concentration history. These numerical results suggest that stream penetrating depth might play a minimal role on - relationship and the dynamical responses o f and variables.
10-,-..... ~ - -
08-
04020000
4.3 Effect of Aquifer T h i c k n e s s In this section we explore the role o f aquifer thickness on the relationships between and , and on dynamical behaviour for and . As shown in cases 25-32 o f Table 2, the variations in aquifer thickness ranged from 10% o f aquifer length L to 50% o f L. Except the aquifer thickness, other simulating parameters and conditions were fixed as before; the length o f aquifer L=lOOm, the stream penetrating depth do=2.5m, the rainfall intensity P=3.12• 10Sm/~, a # L = 0 . 0 1 and a r / L = 0 . O 0 1 . Fig. 7. shows the simulated relationships between and . A s aquifer
1 06
I 0.8
| 10
7.
The
Effect
of A q u i f e r
Thickness
on
( C s } - ( C q ) Relations.
thxckness increased, - relationships deviated significantly from hnear relation showing the increase in the magnitude o f looping behaviour. Table 3 also illustrates the increase in slope a for linear fitting model when aquifer thickness H increases. Since the curvature for - relation becomes large as H increases, the fifth degree polynomials are used in Table 4 for nonlinear fitting model. Fig. 8. shows the dynamical responses o f and variables when various cases o f aquifer
0.8-
0.8-
0.0-
I 04
1.0 --
easel0
=0.6-
0.2-
! 02
Fig.
1,0--
0.4-
e ~ e l & 10 case.35 & 29 c a s ~ & 30 c.ase2"/& 31 r & 32
f
~ v
- - - case31 ...... case32 I 1
I 2
0.6 0.4 0.2
I
I
3
4
t/T,
0.0 0
I l
I 2
! 3
I 4
t/%
Fig. 8. T h e E f f e c t of A q u i f e r T h i c k n e s s on (Cq) and (Cs) R e s p o n s e s .
- 148 -
KSCE Journal of Civil Engineering
Determining the Relatlonshzp between Average Concentration of Saturated Aqufer and Groundwater OuNow sublecf to Nonpomt Source Contarnmants
thickness are considered. Until simulation tune reaches about 2.5 times o f saturated aquifer residence time, responses increase as aquifer thickness increases. H o w e v e r , average concentration o f samrated aquifer decreases as the aquifer thickness increases. 4 4 E f f e c t of Rainfall R a t e s T o investigate the role o f rainfall rates o n the integrated relations and o n dynamical responses, 3 different rainfall rates were used in numerical simulations o f cases 1, 10, 33-36 as s h o w n in Table 2. Since w e assume steady-state f l o w condition, changes in rainfall rates a m o u n t to the variations o f soil moisture or the changes o f groundwater storage. Thus, tow rainfall rate is equtvalent to 'dry' soil moisture condition such that average sol
,0 t .....
i,/
0.8
0.6
me residence time T~ increases with a decrease o f rainfall rate as s h o w n in T a b l e 3. T h e simulation condition and parameters for these cases are as follows; the aquifer length L = 1 0 0 m , the aquifer aspect ratio I-UL-=0.1, stream depth ratio do/H=0.25, longitudinal dispersivity az/L = 0.01, dispersivity ratio a J a r = 1 0 . Fig. 9. shows the integrated concentration relationships. As s h o w n in the figure, - relationships are similar to e a c h other for different rainfall conditions. This fact is also illustrated b y similar coefficients a and b for linear fitting model in Table 3. The concentration responses for and are s h o w n in Fig. 10, where dynamical b e h a v i o u r o f integrated concentration is almost the same b e t w e e n different rainfall conditions. Thus, we might infer that the rainfall rate displays a minimal impact o n < G ( t ) > - relationships and on and < G ( t ) > responses w h e n simulation time is normalized b y average solute residence time o f saturated zone. 4.5
0.4
Effect
of Soil Type
Soil hydraulic properties significantly
0.2 0.0 0.0
0.2
0.4
0.6
0.8
1.0
Fig. 9. The Effect of Rainfall R a t e on (C=)- ( C . ) Relations.
vary with variations in soil type. The cases 1, 10, 37-40 shown in Table 2 were used to investigate the effects o f soil type variations o n the integrated concentration relationships. Fig. 11. illustrates similar - relationships for different soils, w h i c h is also identified f r o m similar
/.._____:_, 1006
0,8 --
0.8 -
~::::J// 0
......
, 35
...... cat~36
I/
v 0.4 0.2-
I 1
I 2
I 3
! 4
t/T,
0.0-
0
.......
'
I 1
1 2
t/T,
Fig. 10. T h e Effect el Rainfall R a t e on (Cq) and