Hindawi Publishing Corporation Abstract and Applied Analysis Volume 2014, Article ID 137148, 6 pages http://dx.doi.org/10.1155/2014/137148
Research Article Deterministic Echo State Networks Based Stock Price Forecasting Jingpei Dan,1 Wenbo Guo,1 Weiren Shi,2 Bin Fang,1 and Tingping Zhang3 1
College of Computer Science, Chongqing University, Chongqing 400044, China School of Automation, Chongqing University, Chongqing 400044, China 3 College of Information Science and Engineering, Chongqing Jiaotong University, Chongqing 400074, China 2
Correspondence should be addressed to Jingpei Dan;
[email protected] Received 15 April 2014; Accepted 21 May 2014; Published 26 June 2014 Academic Editor: Fuding Xie Copyright © 2014 Jingpei Dan et al. This is an open access article distributed under the Creative Commons Attribution License, which permits unrestricted use, distribution, and reproduction in any medium, provided the original work is properly cited. Echo state networks (ESNs), as efficient and powerful computational models for approximating nonlinear dynamical systems, have been successfully applied in financial time series forecasting. Reservoir constructions in standard ESNs rely on trials and errors in real applications due to a series of randomized model building stages. A novel form of ESN with deterministically constructed reservoir is competitive with standard ESN by minimal complexity and possibility of optimizations for ESN specifications. In this paper, forecasting performances of deterministic ESNs are investigated in stock price prediction applications. The experiment results on two benchmark datasets (Shanghai Composite Index and S&P500) demonstrate that deterministic ESNs outperform standard ESN in both accuracy and efficiency, which indicate the prospect of deterministic ESNs for financial prediction.
1. Introduction Prediction in financial or stock markets is a challenging research topic since the stock market is mostly complex (nonlinear) and volatile. Various technical, fundamental, and statistical indicators have been proposed; however, none of them or combination of techniques has been successful enough. The application of artificial neural network (ANN) in prediction problems is very promising for its general function approximation property and effective learning algorithms. Among them, recurrent neural networks (RNNs) offer arbitrary approximation for dynamical systems with arbitrary precision theoretically compared to other traditional ANNs. However, it is difficult for traditional RNNs based on gradient descent approach to develop in application because of slow convergence and high computational cost. A new form of RNN training methods, echo state network (ESN), has been proposed by Jaeger and Haas [1], which is simple and applicable for time series prediction with high accuracy and computational efficiency. During these ten years, ESNs have been applied in many areas, including time series forecasting [2–7], wireless communication [1], robot control [8], and
speech recognition [9]. Lin et al. investigated the effectiveness of ESN to predict the future stock prices in a short term. The experimental results on nearly all stocks in S&P 500 indicated that ESNs outperformed some conventional neural networks in most cases [10, 11]. Although it is verified that standard ESNs can predict future stock prices, the parameters have been determined by trials and errors due to their randomly constructed reservoir. Recently, a deterministically constructed form of ESN has been proposed, which has competitive performance with minimum complexity compared to standard model [12]. Since deterministic ESN model is relatively new, few application researches have been studied until now [13, 14]. This study investigates the performance of deterministic ESN for time series forecasting and its application of stock price prediction. The experiments are based on two benchmark datasets (Shanghai Composite Index and S&P 500) and three types of deterministic ESNs (DLR, DLRB, and SCR) are compared with standard ESNs in forecasting accuracy, stability, and efficiency. The experimental results demonstrate that deterministic ESNs outperform standard ESN in both accuracy and efficiency, which indicate the prospect of deterministic ESNs for financial prediction.
2
Abstract and Applied Analysis K input units
N internal units
(2) Activate the reservoir to the dynamic 𝑁-dimensional states 𝑥(𝑛) of the RNN by
L output units
𝑥 (𝑛 + 1) = 𝑓 (𝑊𝑥 (𝑛) + 𝑊in 𝑢 (𝑛 + 1) + 𝑊fb 𝑦 (𝑛)) , 𝑥 (0) = 0,
. ..
.. .
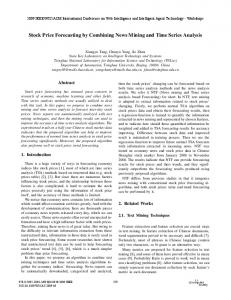
Figure 1: Architecture of standard ESN [1].
Section 2 briefly introduces standard ESNs and deterministic ESNs; Section 3 presents the experiments and the comparison results of applying deterministic ESNs for stock price forecasting on Shanghai Composite Index and S&P 500 stock datasets. Finally, it is concluded in Section 4.
2. Background 2.1. Echo State Networks. Echo state network is a recurrent discrete-time neural network with input, internal units (dynamic reservoir), and output. In the dynamic reservoir, there are large numbers of sparsely connected neurons where the weights are random and fixed. The states of the dynamic reservoir, called “echo states,” reflect history information of inputs. The memoryless readout is the only part that needs to be trained linearly with echo states; thus the training becomes a simple linear regression, which makes the application of RNNs fast and easy. 2.1.1. Architecture. The basic architecture of ESN with K input units, N neurons in the dynamic reservoir, and L output units is shown in Figure 1. The solid arrows in Figure 1 represent the synaptic connections whose weights are randomly generated and fixed, while the dashed arrows are the trainable output weights. 2.1.2. Training Algorithm Input. A training set of (input/output) 𝑆 = {(𝑢(𝑛), 𝑑(𝑛)), 𝑛 = 1, 2, . . . , 𝑇}, 𝑢(𝑛), and 𝑑(𝑛) are 𝐾-dimensional and 𝐿dimensional vectors. Output. A trained ESN (𝑊in , 𝑊, 𝑊fb , 𝑊out ) is such that its output 𝑦(𝑛) of the input 𝑢(𝑛) is close to desired output 𝑑(𝑛), where 𝑊in , 𝑊, 𝑊fb , and 𝑊out are input, internal, feedback, and output weight matrices, respectively, with suitable sizes. (1) Initialize a random RNN (𝑊in , 𝑊, 𝑊fb ) which has the echo state property (ESP); spectral radius of 𝑊 should be smaller than unity.
(1)
where 𝑓 is a state activation function which is usually a sigmoid function and 𝑊 is the internal recurrent connection weight matrix, of which the spectral radius should be smaller than unity in order to ensure the ESN to work; in other words, 𝑊 should satisfy the ESP. (3) Compute the output weights as the linear regression weights of 𝐿-dimensional outputs 𝑦(𝑛) on the states 𝑥(𝑛) by 𝑦 (𝑛) = 𝑔 (𝑊out (𝑥 (𝑛) : 𝑢 (𝑛))) ,
(2)
where 𝑔 is an output activation function. 2.2. Deterministic Echo State Networks. As explained previously, the reservoirs in standard ESNs are constructed randomly so that it is hard to construct ESN and unlikely to optimize the setup. To simplify the reservoir construction, deterministically constructed ESNs (Figure 2) have been proposed [12]. Three reservoir templates with fixed topologies concerned in this study are described as follows. (1) Delay line reservoir (DLR): the units in reservoir are arranged in a line, as shown in Figure 2(a). Obviously, the reservoir matrix 𝑊 has the property that nonzero values are located on the lower subdiagonal of 𝑊; that is, 𝑊𝑖+1,𝑖 = 𝑟 for 𝑖 = 1, . . . , 𝑁 − 1, where 𝑟 is the weight of all the feedforward connections. (2) DLR with backward connections (DLRB): each neuron in reservoir is connected to both the preceding neuron and the successive one, as shown in Figure 2(b). Thus, the lower subdiagonal and upper subdiagonal of 𝑊 both have nonzero elements, 𝑊𝑖+1,𝑖 = 𝑟 and 𝑊𝑖,𝑖+1 = 𝑏, where 𝑏 is the weight of the feedback connections. (3) Simple cycle reservoir (SCR): neurons in reservoir like in Figure 2(c) are organized in a cycle, where 𝑊𝑖+1,𝑖 = 𝑟 and 𝑊1,𝑁 = 𝑟. Except the reservoir construction, the input layer in deterministic ESN is fully connected to the reservoir and all the input connections have the same absolute weight value V > 0 in contrast to randomly generated input weights in standard ESN. The sign of V is determined randomly by a random draw from Bernoulli distribution of mean 1/2. Generally, the deterministic form of ESNs has the following properties, which simplifies the ESN construction by only setting two free parameters and enables a more thorough theoretical analysis of the ESN performance [12]: (1) a simple fixed nonrandom reservoir topology with full connectivity from inputs to the reservoir,
Abstract and Applied Analysis
3
Table 1: Comparative results of ESN and DLR by average forecasting accuracy (MSE). Stocks
ESN
Minsheng Bank Sinopec Baotou Steel Rare Earth Yangquan Coal Industry The Gemdale Group China Shenhua Western Mining China Life Luan Huanneng PetroChina China COSCO
0.010935 0.026413 2.083440 0.210954 0.025079 0.125612 0.039255 0.165341 0.326770 0.014539 0.046103
r = 0.5 0.011121 0.011680 2.307846∗ 0.187878 0.023939 0.116748 0.033440 0.157840 0.320343 0.007712 0.015973
W
V
Performance improvement (%)
r=1 0.011175 0.037695 1.987902∗ 0.225766 0.025767 0.128756 0.042173 0.169839 0.335372 0.018609 0.059996
−1.10 58.13 4.59 10.94 4.55 7.06 14.81 4.54 1.97 46.96 65.35
Dynamical reservoir N internal units x(t)
Dynamical reservoir N internal units x(t)
Input unit s(t)
DLR r = 0.7 0.011055 0.011059 2.238868∗ 0.197090 0.024479 0.120193 0.035893 0.160240 0.322941 0.009112 0.020535
Output unit y(t) U
Input unit s(t)
Dynamical reservoir N internal units x(t)
W
U
V
(a)
Output unit y(t)
Input unit s(t)
(b)
W
U
V
Output unit y(t)
(c)
Figure 2: (a) DLR. (b) DLRB. (c) SCR. [12].
(2) a single fixed absolute weight value 𝑟 for all reservoir connections, and (3) a single weight value V for input connections, with aperiodic pattern of input signs.
3. Stock Price Forecasting Based on Deterministic Echo State Networks In this study, to investigate performances of deterministic ESNs for stock price prediction, three types of deterministic ESNs described previously, DLR, DLRB, and SCR, are compared to standard ESN. Since stock price fluctuates violently, in order to make the experiments fair and sound, two benchmark datasets from Shanghai Composite Index and S&P 500 are adopted in this study. 3.1. Experimental Data 1. Shanghai Composite Index Stock Price Dataset. The trading price data from 14 December, 2007 to 31 December, 2012 (totally 1230 days) of fifty stocks in the benchmark Shanghai composite index is adopted.
2. S&P 500 Stock Price Dataset. S&P 500 is usually considered as the benchmark for the United States’ equity performance; hence it is popular for stock price prediction research. The trading price data from 1 June, 2010 to 20 February, 2014 (totally 930 days) of 374 stocks in S&P 500 is also adopted in the experiments. All data come from Yahoo Finance. In the experiments, 80% of data points in each stock price data are adopted as training set, and the remaining 20% are used for testing. 3.2. Data Preprocessing. In most time series prediction researches, the original data are usually normalized in order to make the preprocessed data in a desired range. In this study, all the original data are normalized as follows: 𝑋=𝑘×
𝑥 − min (𝑥) ± 𝑡, max (𝑥) − min (𝑥)
(3)
where 𝑥 is the original data, min(𝑥) is the minimum data, and max(𝑥) is the maximum value in the data, while 𝑘 and 𝑡 are two coefficients to make the preprocessed data 𝑋 in a desired range.
4
Abstract and Applied Analysis Table 2: Comparative results of ESN and DLRB by average forecasting accuracy (MSE).
Stocks
ESN
Minsheng Bank Sinopec Baotou Steel Rare Earth Yangquan Coal Industry The Gemdale Group China Shenhua Western Mining China Life Luan Huanneng PetroChina China COSCO
0.010935 0.026413 2.083440 0.210954 0.025079 0.125612 0.039255 0.165341 0.326770 0.014539 0.046103
DLRB r = 0.7, b = 0.1 0.011047 ∗ 0.017957 2.227776∗ 0.202954 0.024640 0.123177 0.037880 0.161766 0.324581 0.010373 0.025623
r = 0.5, b = 0.05 0.011139∗ 0.012175 2.296547 ∗ 0.188163 0.023920 0.117322 0.033725 0.158533 0.319993 0.007990 0.016929
r = 1, b = 0.2 0.010884∗ 0.500804 1.889110∗ 0.284849 0.030820 0.139961 0.079748 0.205709 0.373107 0.317348 2.403775
Performance improvement (%) 0.46 53.91 9.33 10.80 4.62 6.60 14.09 4.12 2.07 45.05 63.28
Table 3: Comparative results of ESN and SCR by average forecasting accuracy (MSE). Stocks
ESN
Minsheng Bank Sinopec Baotou Steel Rare Earth Yangquan Coal Industry The Gemdale Group China Shenhua Western Mining China Life Luan Huanneng PetroChina China COSCO
0.010935 0.026413 2.083440 0.210954 0.025079 0.125612 0.039255 0.165341 0.326770 0.014539 0.046103
SCR r = 0.7 0.011061∗ 0.014594 2.228629∗ 0.196191 0.024412 0.120273 0.035651 0.160666 0.322704 0.009102 0.020780
r = 0.5 0.011165∗ 0.011868 2.350138∗ 0.187053 0.023933 0.116739 0.033329 0.157979 0.319483 0.007842 0.016163
3.3. Prediction Accuracy Evaluation Measure. In this study, a commonly used measure, mean squared error (MSE) shown as follows, is utilized to evaluate forecasting accuracy: MSE =
1 𝑛 2 ∑ (𝑦 − 𝑥𝑡 ) , 𝑛 𝑡=1 𝑡
(4)
where 𝑥𝑡 denotes a given time series, 𝑡 = 1, . . . , 𝑛, 𝑛 ∈ 𝑁, and 𝑦𝑡 denotes the forecast of value at time 𝑡. 3.4. Experiments and Results 3.4.1. Experiments on Shanghai Composite Index Stock Price Dataset. In this experiment, each ESN model (standard ESN, DLR, DLRB, and SCR) is built with 96 internal units and spectral radius is set to be 0.8. For each stock in this dataset, the next trading day closing price is predicted by its previous 30 closing prices. These forecasting models are investigated according to different values of input weight matrix 𝑊in . Random Input Weight Matrix 𝑊in . The input weight matrix 𝑊in is randomly set to be in the uniform distributed interval
r=1 0.010842∗ 0.037969 1.975701∗ 0.224106 0.025769 0.129783 0.042433 0.169405 0.334651 0.018705 0.063481
Performance improvement (%) 0.85 55.07 5.17 11.33 4.57 7.06 15.10 4.45 2.23 46.06 64.94
of [−1, 1]. The parameter 𝑟 in internal weight matrix 𝑊 of DLR, DLRB, and SCR models is set to be 0.5, 0.7, and 1.0, respectively. Accordingly, the parameter 𝑏 in 𝑊 of DLRB is set to be 0.05, 0.1, and 0.2. Because of the randomness of 𝑊in , each forecasting model is tested for 1000 times. Each deterministic ESN model is compared with standard ESN model by average forecasting accuracy. The experimental results are shown in Tables 1, 2, and 3. In these tables, the stocks of which the predicting performances are improved as the parameters increase are italic, while reduced ones are with asterisks. From the comparative results, the forecasting performances of DLR, DLRB, and SCR are increased by 19.90%, 19.48%, and 19.71%, respectively, which indicate that the deterministic ESNs outperform the standard ESN in forecasting accuracy. In addition, it is found that the forecasting performances of deterministic ESNs tend to change in one direction (increase or decrease) as the parameter values increase. Deterministic Input Weight Matrix 𝑊in . The forecasting performances of these ESN models are compared under the condition of the same 𝑊in value. In this experiment, all the values in 𝑊in are V = 0.5, and the sign of V is the probability
Abstract and Applied Analysis
5
Table 4: Comparison of ESN and three deterministic ESN models by average forecasting accuracy (MSE) and stability improvement (%). Stocks Minsheng Bank Sinopec Baotou Steel Rare Earth Yangquan Coal Industry The Gemdale Group China Shenhua Western Mining China Life Luan Huanneng PetroChina China COSCO
ESN 0.01097 0.02155 2.18330 0.20609 0.02499 0.12363 0.03783 0.16336 0.32304 0.01200 0.03419
Average forecasting accuracy DLR DLRB 0.01118 0.01121 0.01092 0.01125 2.36140 2.32180 0.18508 0.18552 0.02383 0.02385 0.11524 0.11603 0.03275 0.03313 0.15640 0.15747 0.31968 0.31931 0.00745 0.00756 0.01448 0.01492
SCR 0.01118 0.01089 2.35490 0.18415 0.02382 0.11537 0.03278 0.15717 0.31875 0.00745 0.01460
DLR −11.83 98.04 −42.67 69.47 42.46 67.26 81.06 39.28 40.16 97.60 98.86
Stability improvement (%) DLRB SCR −30.99 −9.66 98.13 98.38 −19.43 −42.68 66.43 67.29 43.31 46.34 60.85 65.96 78.36 79.57 42.17 36.40 45.31 47.00 97.16 97.51 98.74 98.72
Table 5: Comparisons of average forecasting accuracy (MSE) and running time (s). Stocks “A” “ALL” “BAX” “CAT” “COH” “DF” “EIX” “FMC” “HD” “IFF” “KIM” “LXK” “MS” “OI” “PKI” “RL” “SRE” “TER” “VAR” “WY” “WYN” “XEL” “XOM” “XRX” “YUM”
Average forecasting accuracy (r = 0.5, b = 0.05, v = ±0.5) ESN DLR DLRB SCR 3.814025 0.729146 0.47736 1.227007 0.702417 0.23828 0.21518 1.02408 4.05567 2.963587 0.04468 0.51446 0.28087 0.558538 3.549767 6.35157 7.084271 0.105475 1.697554 0.15677 1.538461 0.05319 1.870293 0.06333 2.818102
2.947236 0.737923 0.504663 1.21849 0.670763 0.262445 0.224842 1.04685 4.809645 2.798408 0.045833 0.522021 0.324216 0.476727 2.748976 6.377153 6.978886 0.104689 1.58872 0.16673 1.378661 0.05395 1.827589 0.073928 2.876777
2.87385 0.71832 0.504453 1.221667 0.673214 0.262805 0.225257 1.034131 4.593392 2.70644 0.045762 0.523765 0.323608 0.480012 2.64719 6.40885 6.78874 0.10413 1.617942 0.165503 1.35106 0.053997 1.824464 0.073774 2.806851
of 50% randomly determined. In DLR, DLRB, and SCR, all the values in internal weight matrix 𝑊 are 𝑟 = 0.5 and the feedback connection values in 𝑊 of DLRB are 𝑏 = 0.05. The average forecasting accuracy in MSE for 1000 times tests for each ESN model is shown in Table 4, which indicates that SCR, DLR, and DLRB outperform standard ESN in average accuracy by 15.94%, 15.93%, and 15.51%, respectively.
3.042726 0.730556 0.496313 1.221545 0.67075 0.264985 0.224794 1.026145 4.835269 2.977701 0.045979 0.521172 0.319095 0.47534 2.657761 6.409925 7.210348 0.106195 1.613488 0.166299 1.37561 0.05375 1.80176 0.073895 2.79861
ESN 0.1441 0.1428 0.1422 0.1428 0.1424 0.1422 0.1440 0.1434 0.1396 0.1420 0.1440 0.1446 0.1445 0.1450 0.1446 0.1454 0.1497 0.1421 0.1444 0.1441 0.1438 0.1415 0.1405 0.1401 0.1407
Average running time (s) DLR DLRB 0.1103 0.1092 0.1097 0.1091 0.1091 0.1095 0.1094 0.1092 0.1093 0.1082 0.1094 0.1088 0.1094 0.1095 0.1104 0.1101 0.1095 0.1094 0.1107 0.1094 0.1095 0.1084 0.1089 0.1086 0.1089
0.1093 0.1089 0.1100 0.1094 0.1099 0.1093 0.1095 0.1091 0.1092 0.1082 0.1094 0.1087 0.1088 0.1100 0.1094 0.1102 0.1109 0.1099 0.1103 0.1091 0.1095 0.1086 0.1089 0.1089 0.1085
SCR 0.1134 0.1087 0.1094 0.1092 0.1095 0.1089 0.1098 0.1091 0.1093 0.1083 0.1090 0.1088 0.1082 0.1085 0.1094 0.1102 0.1099 0.1097 0.1094 0.1093 0.1092 0.1091 0.1086 0.1086 0.1086
During the experiment, for the first 500 tests, it is found that the values of forecasting accuracy (MSE) for the ESN models differ significantly, which indicate that the forecasting performances of the ESN models are unstable. To further investigate the stability, another 500 tests have been done, of which the results also show the instability. Therefore, the stability of each ESN model is evaluated by MSE for the 1000
6 tests. As shown in Table 4, compared to the standard ESN model, the stabilities of SCR, DLRB, and DLR models are improved by 53.17%, 52.73%, and 52.70%, respectively. 3.4.2. Experiments on S&P 500 Stock Price Dataset. The forecasting models in this experiment are constructed the same as the experiment described in Section 3.4.1. This experiment aims to further investigate the forecasting performance of each ESN model for various stocks since there are more representative stocks in S&P 500 dataset than in Shanghai Composite Index dataset. Meanwhile, time complexities are compared by computing the average running time. The experimental results are shown in Table 5 partly. Although the ESN models perform competitively in forecasting accuracy, the deterministic ESN models have obvious advantages in efficiency which is indicated by the average time saving of 23.46%, 23.45%, and 23.41% for SCR, DLRB, and DLR, respectively.
4. Conclusions A new method for stock price forecasting by applying deterministic ESN models is presented in this paper. In standard ESNs, the reservoirs are randomly constructed, which makes researchers and practitioners rely on trials and errors. Differently, the deterministic ESNs have their reservoirs constructed deterministically so that the structures of ESN models are simple and easy to be applied. Therefore, deterministic ESNs (three typical types) have been applied to predict stock price. The forecasting performances have been investigated on two benchmark datasets (Shanghai Composite Index and S& P500). The experimental results on Shanghai Composite Index dataset show that deterministic ESNs outperform standard ESN in accuracy by about 20% and stability by 52% averagely. Further investigation on S&P 500 dataset shows that the deterministic ESNs have improvement in efficiency by about 23% while having insignificant improvement in forecasting accuracy. Since deterministic ESNs have advantages of higher forecasting accuracy and efficiency as indicated by the experimental results, they have great prospects in applications of stock price prediction and even other time series forecasting applications. In this work, the deterministic ESN models are constructed by hand. The problem of parameter settings will be considered in future work by applying optimization algorithms.
Conflict of Interests The authors declare that there is no conflict of interests regarding the publication of this paper.
Acknowledgments The research work is partially supported by the Fundamental Research Funds for the Central Universities in China (CDJZR12180004) and the Major State Basic Research Development Program of China (973 Program) (no. 2013CB329100).
Abstract and Applied Analysis
References [1] H. Jaeger and H. Haas, “Harnessing nonlinearity: predicting chaotic systems and saving energy in wireless communication,” Science, vol. 304, no. 5667, pp. 78–80, 2004. [2] Q. Song, X. Liu, and X. Zhao, “Short-term traffic flow and hourly electric load forecasting algorithm based on echo state neural networks,” International Journal of Digital Content Technology & Its Applications, vol. 6, no. 4, pp. 166–172, 2012. [3] Z. Shi and M. Han, “Support vector echo-state machine for chaotic time-series prediction,” IEEE Transactions on Neural Networks, vol. 18, no. 2, pp. 359–372, 2007. [4] C. Sheng, J. Zhao, Y. Liu, and W. Wang, “Prediction for noisy nonlinear time series by echo state network based on dual estimation,” Neurocomputing, vol. 82, pp. 186–195, 2012. ¨ K. Baykan, “Predicting [5] Y. Kara, M. Acar Boyacioglu, and O. direction of stock price index movement using artificial neural networks and support vector machines: The sample of the Istanbul Stock Exchange,” Expert Systems with Applications, vol. 38, no. 5, pp. 5311–5319, 2011. [6] F. Zhai, X. Lin, Z. Yang, and Y. Song, “Financial time series prediction based on Echo State Network,” in Proceedings of the 6th International Conference on Natural Computation (ICNC ’10), vol. 8, pp. 3983–3987, chn, August 2010. [7] H. Zhang, J. Liang, and Z. Chai, “Stock prediction based on phase space reconstruction and echo state networks,” Journal of Algorithms & Computational Technology, vol. 7, no. 1, pp. 87–100, 2013. [8] M. Chang, A. Terzis, and P. Bonnet, “Mote-based online anomaly detection using echo state networks,” Distributed Computing in Sensor Systems, vol. 5516, pp. 72–86, 2009. [9] M. D. Skowronski and J. G. Harris, “Noise-robust automatic speech recognition using a predictive echo state network,” IEEE Transactions on Audio, Speech and Language Processing, vol. 15, no. 5, pp. 1724–1730, 2007. [10] X. Lin, Z. Yang, and Y. Song, “Short-term stock price prediction based on echo state networks,” Expert Systems with Applications, vol. 36, no. 3, pp. 7313–7317, 2009. [11] X. Lin, Z. Yang, and Y. Song, “Intelligent stock trading system based on improved technical analysis and Echo State Network,” Expert Systems with Applications, vol. 38, no. 9, pp. 11347–11354, 2011. [12] A. Rodan and P. Tiˇno, “Minimum complexity echo state network,” IEEE Transactions on Neural Networks, vol. 22, no. 1, pp. 131–144, 2011. [13] A. Rodan and P. Tiˇno, “Simple deterministically constructed cycle reservoirs with regular jumps,” Neural Computation, vol. 24, no. 7, pp. 1822–1852, 2012. [14] P. Tiˇno and A. Rodan, “Short term memory in input-driven linear dynamical systems,” Neurocomputing, vol. 112, pp. 58–63, 2013.
Advances in
Operations Research Hindawi Publishing Corporation http://www.hindawi.com
Volume 2014
Advances in
Decision Sciences Hindawi Publishing Corporation http://www.hindawi.com
Volume 2014
Journal of
Applied Mathematics
Algebra
Hindawi Publishing Corporation http://www.hindawi.com
Hindawi Publishing Corporation http://www.hindawi.com
Volume 2014
Journal of
Probability and Statistics Volume 2014
The Scientific World Journal Hindawi Publishing Corporation http://www.hindawi.com
Hindawi Publishing Corporation http://www.hindawi.com
Volume 2014
International Journal of
Differential Equations Hindawi Publishing Corporation http://www.hindawi.com
Volume 2014
Volume 2014
Submit your manuscripts at http://www.hindawi.com International Journal of
Advances in
Combinatorics Hindawi Publishing Corporation http://www.hindawi.com
Mathematical Physics Hindawi Publishing Corporation http://www.hindawi.com
Volume 2014
Journal of
Complex Analysis Hindawi Publishing Corporation http://www.hindawi.com
Volume 2014
International Journal of Mathematics and Mathematical Sciences
Mathematical Problems in Engineering
Journal of
Mathematics Hindawi Publishing Corporation http://www.hindawi.com
Volume 2014
Hindawi Publishing Corporation http://www.hindawi.com
Volume 2014
Volume 2014
Hindawi Publishing Corporation http://www.hindawi.com
Volume 2014
Discrete Mathematics
Journal of
Volume 2014
Hindawi Publishing Corporation http://www.hindawi.com
Discrete Dynamics in Nature and Society
Journal of
Function Spaces Hindawi Publishing Corporation http://www.hindawi.com
Abstract and Applied Analysis
Volume 2014
Hindawi Publishing Corporation http://www.hindawi.com
Volume 2014
Hindawi Publishing Corporation http://www.hindawi.com
Volume 2014
International Journal of
Journal of
Stochastic Analysis
Optimization
Hindawi Publishing Corporation http://www.hindawi.com
Hindawi Publishing Corporation http://www.hindawi.com
Volume 2014
Volume 2014