PRODUCT APPLICATION FOCUS
DEVDase detection in intact apoptotic cells using the cell permeant fluorogenic substrate, (z-DEVD)2-cresyl violet Brian W. Lee1, Gary L. Johnson1, Sally A. Hed1, Zbigniew Darzynkiewicz2, Jamil W. Talhouk3, and Sanjiv Mehrotra3 BioTechniques 35:1080-1085 (November 2003)
Using a bisubstituted caspase-3 target sequence: aspartate-glutamate-valine-aspartate, (z-DEVD)2 peptide derivative of the fluorophore, cresyl violet, we have obtained a cell permeant, fluorogenic, caspase substrate capable of detecting the site-specific presence of functionally active, caspase-3 and caspase-7 up-regulation within intact apoptotic cells. Addition of this substrate to induced and noninduced cell culture populations allows for the rapid site-specific detection of caspase up-regulation without the requirement for a wash step. We demonstrate here the use of (z-DEVD)2-cresyl violet substrate for the detection of apoptosis induction in Jurkat, THP-1, and MCF-7 cells using fluorescence microscopy and 96-well fluorescence plate reader analysis. Intracellular up-regulated DEVDase activity, which was clearly visible by fluorescence microscopy and 96-well fluorescence plate reader measurements, showed greater than 6-fold increases in fluorescence output in induced versus noninduced Jurkat cell samples. A simple fluorogenic substrate conversion method is demonstrated here for detecting apoptosis induction within intact living cells.
INTRODUCTION Intracellular localization and monitoring of the functionally active forms of these caspase proteases is critical to the understanding of the apoptotic process. Simple detection of protease-specific mRNA by in situ hybridization or immunohistochemical localization of the protein structures does not, in itself, specify the location of the proteolytically active form of these enzymes within the various organelles of the cell (1). Precursor (zymogen) forms of these proteolytic enzymes are routinely formed and stored in advance of their need within the cell. Posttranslational regulation of these enzymes to generate their active configuration is a primary mechanism for their need-based activation within the cell (2). To address this need to monitor the intracellular location of these active forms of the caspase enzyme, cell permeant, fluorescent-tagged caspase inhibitor and fluorogenic caspase substrate systems were developed and commercialized. Fluorochrome-labeled inhibitors of caspases (FLICA) were developed to allow the covalent labeling of intracellular-active caspase enzyme within apoptotic cell populations (3). These fluorescein- or sulforhodamine-labeled inhibitors contain different 3–5 amino acid caspase target sequences linked to a fluoromethyl ketone reactive group. Although the primary target for these fluorescent-labeled inhibitors was originally assumed to be restricted exclusively to active caspase catalytic sites, we now have evidence of their binding to other
apoptosis-associated noncaspase enzymes as well (4). Several cell permeant mono- and dipeptidyl rhodamine diamide substrates were previously developed to allow for the monitoring of whole cell enzyme (cathepsin) activity levels (5,6). Performance limitations of these reagents became apparent when larger target amino acid sequences, such as those designed to react with caspases [(z-DEVD)2] are coupled to the rhodamine fluorophore. A modification of this rhodamine-based substrate system was recently presented to help circumvent these membrane permeability issues (7). Two other types of fluorogenic substrate systems have recently been developed that enter the cell more efficiently. The first of these involves the use of an 18-amino acid sequence containing a 4-amino acid caspase target sequence and derivatized on each end with a rhodamine fluorophore (8–10). Formation of H-type dimers by the end terminal rhodamine groups resulted in a quenched, cell permeant, caspase substrate that, upon cleavage by active caspase enzyme, becomes fluorescent (8). A second fluorogenic caspase detection system, which was recently developed in our laboratory, involves the use of the hydrophobic dye, cresyl violet. Cresyl violet, an old histolological stain utilized for its metachromatic properties, also has fluorescence properties and was subsequently converted to a fluorogenic substrate for dipeptidyl peptidase IV (DPPIV) via the amide linkage of alanine-proline to the two amine groups on the fluorophore (1,11–14). It was also coupled to z-arginine (z-Arg)2-cresyl violet to generate a
1Immunochemistry Technologies
LLC, Bloomington, MN, 2Brander Cancer Research Institute, Hawthorne, NY, and 3Enzyme Systems/ICN Biomedicals, Livermore, CA, USA 1080 BioTechniques
Vol. 35, No. 5 (2003)
cathepsin B fluorogenic substrate (15). In all of the experiments, the fluorogenic cresyl violet-derivatized substrate easily penetrated the cell membrane generating the fluorescent cresyl violet product upon appropriate enzyme exposure. In this communication, we describe how the up-regulated caspase-3-like activity in apoptotic cells can be visualized by the generation of the red fluorescent cresyl violet product. Marketed under the Magic Red® name by ICN Biomedicals and Immunochemistry Technologies, this patented cresyl violet-based fluorogenic substrate system can detect the intracellular prescence and location of the DEVDase process. Several advantages associated with the use of a fluorophore having higher excitation and emission properties as compared to the coumarin and rhodamine fluorophores include: (i) a lower nonspecific autofluorescence signal associated with the longer wavelength excitation of cresyl violet, and (ii) fluorescent molecules excited at longer wavelengths are much less cytotoxic to the cell, thus preserving the cell viability status, which is so important to live cell imaging studies (1,13).
MATERIALS AND METHODS Cell Culture Nonadherent Jurkat and THP-1 cells and adherent MCF7 cells were obtained from ATCC (Manassas, VA, USA). Jurkat cells were maintained in media components purchased from BioWhittaker (Walkersville, MD, USA). Media consisted of RPMI 1640 plus L-glutamine supplemented with 10% fetal bovine serum (FBS), 1 mM sodium pyruvate, nonessential amino acids, 2 mM L-glutamine, 10 mM HEPES, 100 U/ mL penicillin, and 100 µg/mL streptomycin. MCF-7 cells were maintained in minimal essential medium supplemented with nonessential amino acids, 2 mM L-glutamine, 20 µg/mL insulin, 100 µg/mL streptomycin, 100 U/mL penicillin, and 10% FBS (all from Life Technologies/Gibco, Grand Island, NY, USA) in 25-mL (12.5-cm2) polystyrene tissue culture flasks (Becton Dickinson, Franklin Lakes, NJ, USA). All cells were maintained in a 5% CO2 incubator at 37°C. Experiments were limited to cell cultures exhibiting 60%–80% confluency or less than 1 × 10⁶ cells/mL. Apoptosis was induced via the addition of staurosporine (Sigma, St. Louis, MO, USA) at a 1 µM concentration for 3 to 4 h at 37°C or 0.15 µM camptothecin (Sigma) for 24 h at 37°C (16,17). Fluorescence Microscope Detection of Intracellular Caspase Activity Using (z-DEVD)2-Cresyl Violet (Magic Red-DEVD) Substrate Nonadherent cells. Jurkat and THP-1 cells were grown to a density not to exceed 1 × 10⁶ cells/mL to avoid the incidence of noninduced apoptosis induction from overcrowding. Comparable quantities of Vol. 35, No. 5 (2003)
noninduced cells were set aside under the same conditions as a negative control. Following a 3- to 4-h 37°C staurosporine induction period, a frozen 10 mM stock aliquot of (z-DEVD)2-cresyl violet in dimethyl sulfoxide (DMSO) was thawed and further diluted an additional 1:10 in DMSO to accommodate the accurate pipeting of the lower cresyl violet substrate concentration tubes. This reagent is now available in lyophilized vials as part of the Magic Red-DEVDase kit (Immunochemistry Technologies, Bloomington, MN, USA and ICN Biomedicals, Aurora, OH, USA). A range of (zDEVD)2-cresyl violet substrate concentrations, from 2.5 to 20 µM, were examined using a constant 1-h 37°C incubation time. Jurkat and THP-1 cells were observed at the various substrate concentration levels to determine whether we could visually distinguish apoptotic (induced) cell populations from the negative control (noninduced) cell populations. Magic Red-DEVD substrate staining was observed by removing a 15- to 20-µL volume of cell suspension and placing it on a slide with a coverslip. Cells were initially observed using an older model Zeiss Standard fluorescence microscope (Carl Zeiss, Thornwood, NY, USA) equipped with a 50 W mercury lamp, excitation filter of 540–560 nm, and a long pass >610 nm emission/barrier filter pairing. Photomicrographs were subsequently taken using a Nikon® Eclipse E800™ photomicroscope (Nikon, Melville, NY, USA) equipped with a 100 W mercury lamp and standard Texas Red, rhodamine (excitation 510–560 nm, barrier 570–620 nm) filter sets. Both induced and noninduced images were taken at identical gain settings so that direct fluorescence/
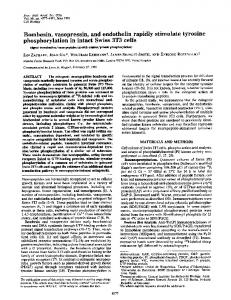
Figure 1. Detection of DEVDase activity in Jurkat cells using (z-DEVD)2-cresyl violet fluorogenic substrate. Jurkat cells were incubated with 1 µM staurosporine (A) or dimethyl sulfoxide (DMSO) control (B) for 3 h at 37°C. Cell cultures were subsequently incubated with 10 µM (z-DEVD)2-cresyl violet for 60 min at 37°C. Left panels contain fluorescence image obtained using a Nikon Eclipse E800 photomicroscope equipped with 100 W mercury lamp and excitation (510–560 nm) and emission (570–620 nm) filter pairs. Right panels contain the corresponding differential-interference-contrast (DIC) image. BioTechniques 1081
PRODUCT APPLICATION FOCUS brightness comparisons could be made between the two cell populations. Digital images were stored on an Iomega® ZIP® drive (Iomega, San Diego, CA, USA) or an RCD-650 CD recorder (Optima, Irvine, CA, USA) for future analysis using ImagePro® Plus (Media Cybernetics, Carlsbad, CA, USA). Prints were modified using Adobe® Photoshop® version 6.0 to allow cropping of photographs to display more cell-dense regions of the field and to allow fluorescent and differentialinterference-contrast (DIC) images to be properly aligned for visual comparison. Adherent cells. MCF-7 cell culture flasks exhibiting 60%–80% confluency were washed in sterile phosphate-buffered saline (PBS) and then trypsinized with 0.25% trypsin-1 mM EDTA (Life Technologies). Detached cells were diluted into at least a 10-fold volume of cell culture media containing 10% FBS to neutralize the trypsin and seeded into the Lab-Tek™ Chamber Slide™ system (Nalgene Nunc, Rochester, NY, USA) at 104–105 cells/slide. Slides were grown to approximately 80% confluency. Apoptosis was induced by administration of 0.15 µM camptothecin into cultures for 24 h (17). The medium was then gently removed and substituted with a fresh medium containing 5 or 10 µM (z-DEVD)2-cresyl violet and 1 µg/mL of Hoechst 33342 stain (Molecular Probes, Eugene, OR, USA) (18). Cells were subsequently incubated for 10–20 min at 37°C. Chamber walls were then removed, the cells gently rinsed, mounted in a drop of fresh medium under a coverslip, and examined under a Microphot-FXA epifluorescence microscope (objective lens 40×; Nikon), using a triple-band cube filter (Chroma Technology, Brattleboro, VT, USA) that allows for illumination of 4′,6diamidino-2-phenylindole (DAPI)-fluorescein isothiocyanate (FITC)-Texas Red . The three excitation settings for this filter are centered at 403, 492, and 572 nm. Emission settings for the filter are centered at 462, 532, and 625 nm. To reveal lysosomes, the live MCF-7 cells growing in chamber slides were exposed to 0.5 µg/mL of the metachromatic fluorochrome acridine orange (AO) (Molecular Probes) dissolved in culture media for 20 min at 37°C (19). Cells were then rinsed in PBS, mounted in a drop of PBS under a coverslip, and examined by fluorescence microscopy with the Nikon Microphot-FXA using blue light illumination (492 nm).
violet product was measured using a SPECTRAmax® Gemini 96-well fluorescence plate reader (Molecular Devices, Sunnyvale, CA, USA). The plate reader was set up to excite cells at 590 nm and read fluorescence emission at 630 nm using a 610-nm cut-off function (13). RESULTS AND DISCUSSION Caspase-3 and Caspase-7 DEVDase Activity Detection In cell suspensions using (z-DEVD)2-cresyl violet concentrations ranging from 2.5 to 20 µM, a visibly distinct fluorescence intensity differential was observed between apoptosis-induced and noninduced Jurkat and THP-1 cells (Figures 1 and 2). The 20 µM (z-DEVD)2-cresyl violet concentration level gave the most rapid cell fluorescence staining but also gave higher nonspecific background fluorescence in noninduced cells when substrate incubation periods exceeded 60 min in duration. Optimal (z-DEVD)2-cresyl violet substrate concentrations seemed to vary by cell type and were timeand temperature-dependent (data not shown). Variations of cell fluorescence staining, observed between the different induced versus noninduced cell lines, may be due to a number of factors. These may include differences in: (i) the degree of apoptosis induction due to the particular inducing agent employed; (ii) the relative abundance and composition of caspase and other up-regulated apoptosis enzyme participants
Caspase (DEVDase) Detection in Nonadherent Jurkat Cells Using a Fluorescence Plate Reader Jurkat cells were induced as described above using 1 µM staurosporine for 3 h at 37°C. Vials containing lyophilized (z-DEVD)2-cresyl violet were reconstituted in DMSO (50 µL/vial). Just before use, 200 µL deionized water were added per vial to obtain a 30× intermediate (z-DEVD)2cresyl violet stock solution. Two-milliliter volumes of cell suspension of induced and noninduced cells at 1 × 10⁷, 5 × 10⁶, and 1 × 10⁶ cells/mL were spiked with 67 or 33 µL of the 30× (z-DEVD)2-cresyl violet substrate to yield a 20 and 10 µM substrate concentration, respectively. Jurkat cells were incubated with substrate at 37°C in a CO2 incubator. Aliquots (100 µL/well, 4 replicates) were removed after a 60-min (zDEVD)2-cresyl violet incubation period. DEVDase enzyme-generated red fluorescence, and cresyl 1082 BioTechniques
Figure 2. Detection of DEVDase activity in THP-1 cells using (z-DEVD)2cresyl violet fluorogenic substrate. THP-1 cells were incubated with 1 µM staurosporine (A) or dimethyl sulfoxide (DMSO) control (B) for 3 h at 37°C. Cell cultures were subsequently incubated with 10 µM (z-DEVD)2-cresyl violet for 60 min at 37°C. Right panels contain fluorescence image obtained using a Nikon Eclipse E800 photomicroscope equipped with a 100 W mercury lamp and excitation (510–560 nm) and emission (570–620 nm) filter pairs. Left panels contain the corresponding differential-interference-contrast (DIC) image. Vol. 35, No. 5 (2003)
between different cell lines; and (iii) cell membrane composition between the different cell types, which may affect the rate of intracellular substrate uptake. The exact mechanism by which these substrates enter cells has never been conclusively documented (C.J.F. Van Noorden, personal communication). Adherent MCF-7 cells, induced to undergo apoptosis by a 24-h exposure to low concentrations of camptothecin, showed visual evidence of the accumulation of red fluorescent cresyl violet product in various sized granular cytoplasmic structures resembling mitochondria and lysosomes. To better determine as to whether some of these structures may indeed be lysosomes, we compared the subcellular staining patterns of the lysosomo-trophic dye AO with that of (z-DEVD)2-cresyl violet in induced MCF-7 cells. AO, which is a weak base, accumulates and is entrapped inside acidic lysosomes, whose low pH is maintained through the proton pump activity of these organelles (19). Once inside, AO forms concentrated aggregates, which exhibit a characteristic orange-red fluorescence, contrasting with the green fluorescence generated by monomeric forms of this dye (19). The pattern of cell staining with AO (Figure 3) resembled that of (z-DEVD)2-cresyl violet, indicating that this fluorogenic substrate was staining the same organelles as the AO. This is now merely an indirect indication, and more stringent evidence is needed involving a co-localization of the lysosome-specific probe with (zDEVD)2-cresyl violet to prove identity of these organelles. Unfortunately, both the lysosome-bound AO and the hydrolyzed (z-DEVD)2-cresyl violet generate red fluorescence, so as to not be useful in co-localization studies. Co-localization of the two fluorophores in lysosomes would at first suggest that enzymes present in these organelles are capable of processing the z-DEVD caspase-3 and caspase-7 substrates. It is more likely however, that the substrate was cleaved in other locations within the cell, such as in the mitochondria, but the cleavage product, in analogy to AO, had lysosomo-trophic properties and therefore also accumulated within the lysosomes. Subsequent observations
made at earlier time points did reveal that the accumulation of red fluorescent product, albeit faint, was within the smaller mitochondrial-sized organelles prior to its accumulation within the larger lysosomal structures. Although AO-stained lysosomes appeared in all cells, the hydrolyzed mono- and unsubstituted red fluorescent cresyl violet product appeared only in a percentage of the stimulated cell population. Many of these red cresyl violet substrate-labeled cells exhibited morphological features of apoptosis, such as cell shrinkage and undulation of the plasma membrane (budding). Cleavage of the cresyl violet substrate occurred preferentially in cells undergoing apoptosis. Interestingly, cells that demonstrated the presence of the red cresyl violet product had distinctly lower Hoechst 33342 fluorescence of their nuclei compared with the cells that did not cleave the substrate (Figure 4). Studies are in progress to characterize the early chromatin changes within these cells that may be responsible for a decreased binding of Hoechst 33342 stain. Fluorescence Plate Reader Detection of DEVDase Activity in Jurkat Cells Up-regulation of intracellular DEVDase activity through the initiation of apoptosis in Jurkat cells was monitored using a 96-well fluorescence plate reader. Induced populations of Jurkat cells showed an increased level of red fluorescence output when compared to the noninduced control group after as little as 30 min incubation at 37°C, using the Magic Red-DEVDase fluorogenic substrate (data not shown). Cell samples measured at 60-min substrate incubation times gave
Figure 3. Fluorescence staining of apoptotic MCF-7 cells using acridine orange (AO) stain and (z-DEVD)2-cresyl violet flurorogenic substrate. MCF-7 cells were induced for 24 h with 0.15 µM camptothecin at 37°C. Induced cells were stained for 30 min with 1.88 µM AO in phosphate-buffered saline (PBS) (A) or 10 µM (z-DEVD)2-cresyl violet in cell culture media (B). Fluorescence images were obtained using a Nikon Microphot-FXA epifluorescence microscope equipped with a 40× objective lens and a triple-band cube optical filter designed for viewing 4′,6diamidino-2-phenylindole (DAPI)-fluorescein isothiocyanate (FITC)-Texas Red. AO was illuminated using blue excitation (492 nm) and observed using a 600- to 650-nm emission filter. Cresyl violet fluorophore was illuminated using (560–584 nm) excitation and red light emission (600–650 nm) filters. Vol. 35, No. 5 (2003)
Figure 4. Dual staining of MCF-7 cells with Hoechst 33342 stain and (z-DEVD)2-cresyl violet fluorogenic substrate following a 24-h exposure to 0.15 µM camptothecin at 37°C. Cells were stained for 30 min with 10 µM (z-DEVD)2-cresyl violet at 37°C, washed twice in phosphate-buffered saline (PBS), and supravitally stained with 1 µg/mL of Hoechst stain (>10 min). Using the Nikon Microphot-FXA system containing a multiwavelength filter pairing system consisting of a triple-band cube optical filter designed for viewing 4′,6-diamidino-2-phenylindole (DAPI)fluorescein isothiocyanate (FITC)-Texas Red stained cells, apoptotic cells bearing orange lysosomal bodies with less intense blue nuclei can be seen intermixed with nonapoptotic cells bearing bright blue nuclei and absent or reduced lysosomal staining. BioTechniques 1083
PRODUCT APPLICATION FOCUS Table 1. Effect of Cell and (z-DEVD)2-Cresyl Violet Substrate Concentration on Induced and Noninduced Fluorescence Signal Ratios
Cell Concentration (cells/mL)
Substrate Concentrationa 10 µM 20 µM
7.74 8.53 1 × 10⁷ 8.18 9.69 5 × 10⁶ 6.45 6.11 1 × 10⁶ aThe values represent the ratio of induced fluorescence signal over noninduced fluorescence signal and is the mean value (×− ) of experiments run on 3 separate days.
induced to noninduced fluorescence signal ratios ranging from 6 to 9 depending on other assay conditions, which included cell and substrate concentration (Table 1). Outward diffusion of the hydrolyzed red fluorescent (cresyl violet leaving group) product into the surrounding media appears to reduce plate-reader induced to noninduced differentials to less than a 10-fold ratio. This would seem to contradict whole-cell observations made on these same cell lines in the fluorescence microscope using constant gain setting comparison. When viewing whole cells under fluorescence microscope conditions, any red fluorescent product diffusing back out of the cell tends to dissipate to the eye, whereas in fluorescence plate reader measurements, the entire well
1084 BioTechniques
contents are quantitated. Diffusion of enzyme-hydrolyzed fluorescent product either into another organelle or outside of the cell seems to be a generalized problem with most of the fluorogenic substrates (1). This obviously complicates any interpretation or conclusion that may be drawn from observation of an intracellular enzymatic process. A need continues to exist for the development and market distribution of easy-to-use test kits, which utilize cell permeant fluorogenic reagents capable of the quantitation and localization of apoptosis up-regulated enzyme activity. Like the fluorescent-tagged 3- to 5-amino acid caspase sequence, fluoromethyl ketone (FMK) inhibitors, which are currently marketed by a number of companies, fluorogenic cresyl violet-based caspase substrates are cell permeant. Unlike inhibitor-based assay formats, substrate uptake and processing assays do not require wash steps to discriminate between apoptotic and nonapoptotic cell populations. Rapid uptake and enzymatic processing of these fluorogenic caspase substrates also favors the use of shorter assay incubation periods than the more “end point” equilibrium-based assay formats. These features make the fluorogenic substrate assays more compatible with a high-throughput drug screening regimen. Substrate assays also provide the potential for greater assay sensitivity. While the fluorochrome-tagged inhibitors bind to active centers of the respective proteases with 1:1
Vol. 35, No. 5 (2003)
stoichiometry, the accumulation of the fluorescent product in substrate assays is the consequence of enzymatic activity. In the latter case, the number of molecules of fluorescent product per active center can be amplified by prolongation of the enzyme reaction in a manner analogous to an antibodybased enzyme immunoassay format. This amplification concept can be advantageously employed in the widely used 96-well black microplate formats. In situations where only a small percentage of the cells are undergoing apoptosis, a labeled inhibitor approach may not detect these apoptotic events, whereas an enzyme-driven fluorescent product-accumulation mechanism might detect them. Incorporation of multiple, uniquely discriminate, fluorogenic cell-permeant substrates into kit form would allow simultaneous monitoring of several distinct types of enzyme activity within a given cell or cell population, assuming that substrate specificity was attainable. In all cases, the end user must possess the means by which to differentiate (visually or electronically) between the different positive output signals in contrast to that generated by background or nonspecific fluorescence.
and R.E. Smith. 1997. Ala-Pro-cresyl violet, a synthetic fluorogenic substrate for the analysis of kinetic parameters of dipeptidyl peptidase IV (CD26) in individual living rat hepatocytes. Anal. Biochem. 252:71-77. 14. Boonacker, E., S. Elferink, A. Bardai, B. Fleischer, and C.J.F. Van Noorden. 2003. Fluorogenic substrate Ala-Pro-Cresyl violet but not AlaPro-Rhodamine 110 is cleaved specifically by DPPIV activity: a study in living Jurkat cells and CD26/DPPIV-transfected Jurkat cells. J. Histochem. Cytochem. 51:1-10. 15.Van Noorden, C.J.F., T.G.N. Jonges, J. Van Marle, E.R. Bissel, P. Griffini, M. Jans, J. Shel, and R.E. Smith. 1998. Heterogeneous suppression of experimentally induced colon cancer metastasis in rat liver lobes by inhibition of extracellular cathepsin B. Clin. Exp. Metastasis 16:159-167. 16. Couldwell, W.T., D.R. Hinton, T.C. Chen, I. Sebat, M.H. Weiss, and R.E. Law. 1994. Protein kinase C induces apoptosis in human malignant glioma lines. FEBS Lett. 345:43-46. 17. Del Bino, G., P. Lassota, and Z. Darzynkiewicz. 1991. The S-phase cytotoxicity of camptothecin. Exp. Cell Res. 193:27-35. 18. Latt, S.A. and R.G. Langlois. 1990. Fluorescent probes of DNA microstructure and DNA synthesis, p. 249-290. In M.R. Melamed, T. Lindmo, and M.L. Mendelsohn (Eds.), Flow Cytometry and Sorting, 2nd ed. WileyLiss, New York. 19.Traganos, F. and Z. Darzynkiewicz. 1994. Lysosomal proton pump activity: supravital cell staining with acridine orange differentiates leukocyte subpopulations. Methods Cell Biol. 41:185-194.
REFERENCES
Address correspondence to Brian W. Lee, Immunochemistry Technologies LLC, 9401 James Ave. South, Suite 155, Bloomington, MN 55431, USA. e-mail:
[email protected]
1.Boonacker, E. and C.J.F. Van Noorden. 2001. Enzyme cytochemical techniques for metabolic mapping in living cells, with special reference to proteolysis. J. Histochem. Cytochem. 49:1473-1486. 2. Biagiotti, E., K.S. Bosch, P. Ninfali, W.M. Frederiks, and C.J.F. Van Noorden. 2000. Posttranslational regulation of glucose-6-phosphate dehydrogenase activity in tongue epithelium. J. Histochem. Cytochem. 48: 971-977. 3. Bedner, E., P. Smolewski, P. Amstad, and Z. Darzynkiewicz. 2000. Activation of caspases measured in situ by binding of fluorochrome-labeled inhibitors of caspases (FLICA): correlation with DNA fragmentation. Exp. Cell Res. 260:308-313. 4. Pozarowski, P., X. Huang, D.H. Halicka, B. Lee, G. Johnson, and Z. Darzynkiewicz. 2003. Interactions of fluorochrome-labeled caspase inhibitors with apoptotic cells: a caution in data interpretation. Cytometry 55A:50-60. 5.Leytus, S.P., L.L. Melhado, and W.F. Mangel. 1983. Rhodamine based compounds as fluorogenic substrates for serine proteinases. Biochem. J. 209:299-307. 6.Leytus, S.P., W.L. Patterson, and W.F. Mangel. 1983. New class of sensitive and selective fluorogenic substrates for serine proteinases. Biochem. J. 215:253-260. 7.Cai, S.X., H.Z. Zhang, J. Guastella, J. Drewe, W. Yang, and E. Weber. 2001. Design and synthesis of Rhodamine 110 derivative and caspase-3 substrate for enzyme and cell-based fluorescent assay. Bioorg. Med. Chem. Lett. 9:39-42. 8. Packard, B.Z., D.D. Toptygin, A. Komoriya, and L. Brand. 1996. Profluorescent protease substrates: intramolecular dimers described by the exciton model. Proc. Natl. Acad. Sci. USA 93:11640-11645. 9. Komoriya, A., B.Z. Packard, M.J. Brown, M.L. Wu, and P.A. Henkart. 2000. Assessment of caspase activities in intact apoptotic thymocytes using cell-permeable fluorogenic substrates. J. Exp. Med. 191:1819-1828. 10. Telford, W.G., A. Komoriya, and B.Z. Packard. 2002. Detection of localized caspase activity in early apoptotic cells by laser scanning cytometry. Cytometry 47:81-88. 11. Boonacker, E.P., E.A. Wierenga, H.H. Smits, and C.J.F. Van Noorden. 2002. CD26/DPPIV signal transduction function, but not proteolytic activity, is directly related to its expression level on human Th1 and Th2 cell lines as detected with living cell cytochemistry. J. Histochem. Cytochem. 50:1169-1177. 12. Abu-Absi, S.F., J.R. Friend, L.K. Hansen, and W.S. Hu. 2002. Structural polarity and functional bile canaliculi in rat hepatocyte spheroids. Exp. Cell Res. 274:56-67. 13.Van Noorden, C.J.F., E. Boonacker, E.R. Bissel, A.J. Meijer, J. Marle, Vol. 35, No. 5 (2003)