SES. Socioeconomic status. VET. Vocational education and training ... evidence in support of the effectiveness of specific initiatives and programs ...... factors identified were having high quality online discussion forums (ranked fourth), online ...
Developing a Critical Interventions Framework for advancing equity in Australian higher education Discussion paper prepared for the Department of Industry, Innovation, Climate Change, Science, Research and Tertiary Education
Ryan Naylor, Chi Baik and Richard James Centre for the Study of Higher Education The University of Melbourne April 2013
2
Table of Contents List of Abbreviations ......................................................................................................... 4 Executive Summary ........................................................................................................... 5 The progress: the patterns in higher education equity following the Bradley Review ......................................................................................................................................... 5 The future: Identifying key foci for equity initiatives ............................................... 6 The proposed Critical Interventions Framework ....................................................... 7 Strengthening the evaluation and research evidence-base .................................... 7 1. The Critical Interventions Framework project ................................................... 9 1.1 Project aims and methodology ....................................................................................... 9 1.2 The policy context ............................................................................................................. 10 2. The literature on equity initiatives ...................................................................... 13 2.1 Prior to seeking access to higher education ........................................................... 14 2.2 At selection and admissions .......................................................................................... 18 2.4 During transition ............................................................................................................... 19 2.5 During an individual’s studies ...................................................................................... 21 3. The recent patterns of access and participation for equity groups .......... 23 3.1 People in equity groups are under-represented in higher education .......... 23 3.2 Most students from educationally disadvantaged groups are no less likely to successfully complete their studies ............................................................................. 24 3.3 How has the participation of students in educationally disadvantaged groups changed since 2007? ................................................................................................ 27 3.4 Parameters of analysis .................................................................................................... 31 4. Proposed Critical Interventions Framework .................................................... 33 5. Distribution of Higher Education Participation and Partnerships Programs (HEPPP) against the CIF ............................................................................ 42 6. Bibliography ................................................................................................................. 45
3
List of Abbreviations ATAR
Australian tertiary admission rank
ENTER
Equivalent ranking
HEPPP
Higher education participation partnerships program
SES
Socioeconomic status
VET
Vocational education and training
4
national
tertiary entrance and
Executive Summary This report presents for discussion a Critical Interventions Framework designed to assist in advancing equity in higher education. The report: summarises the patterns of access and participation for key equity target groups in the period following the 2008 Review of Australian Higher Education (the ‘Bradley Review’); reviews the national and international literature in search of available evidence in support of the effectiveness of specific initiatives and programs implemented to advance equity; presents a possible typology of equity initiatives, styled as a Critical Interventions Framework, to assist in conceptualising policy and practice and informing research and evaluation; presents a summary of the plausibility and apparent evidence base for the types of initiatives described in the Critical Interventions Framework; and presents a broad summary of the national patterns of equity initiatives drawn from an analysis of the institutional reports provided to the Commonwealth as part of the Higher Education Participation and Partnerships program (HEPPP), again against the Critical Interventions Framework. The report’s emphasis is on low SES access and participation given the importance that has been attached to this group in public policy.
The progress: the patterns in higher education equity following the Bradley Review Since the Bradley Review a number of factors have affected the patterns of access and participation for students from equity groups. These include: the uncapping or deregulation of the volume of undergraduate places, which has influenced patterns of institutional recruitment, selection and admissions; the establishment of a national target for low SES participation — a 20% share of places by 2020 — and the inclusion of institutional equity targets in Mission-Based Compacts and the allocation of performance-based funding incentives; the funding available to institutions for equity initiatives through the Higher Education Participation and Partnerships program (HEPPP); and wider societal trends in community beliefs about the value of undertaking higher education and changing assumptions about entry requirements and eligibility for participation. These factors are tightly interwoven and it is difficult, and risky, to speculate on their relative impact. Nonetheless, the uncapping of undergraduate places has had a major effect on the character of the higher education sector and led to a dramatic period of growth in overall student numbers. Uncapping may have been the single most significant factor in the rising numbers of students from equity target groups who have been admitted to higher education. However, it is equally true that uncapping has lifted access to higher education across the board. Thus the gains in the participation share for low SES people have been modest even though the trend is clearly in the right direction. On current trends the 20% target will be elusive by
5
2020. For most equity target groups, and Indigenous people in particular, parity in the share of higher education places seems a long way off. On the plus side though, close analysis of access data against a pre-Bradley Review baseline of 2007 reveals considerable growth in the number of students from low SES backgrounds and Indigenous students, indeed growth rates that have outstripped those of domestic onshore students as a whole. Against an increase in total onshore domestic student numbers of 16.4% since 2007, the number of Indigenous students has increased 27.0%, while the number of students from low SES backgrounds has increased by 21.2%. These patterns are particularly notable given the proportion of students from these equity groups remained little changed in the decade before the Bradley Review.
The future: Identifying key foci for equity initiatives The positive trends in access for historically under-represented groups are a direct result of the federal government and institutions placing equity group participation centrally in the higher education agenda. Part of the federal government’s commitment to equity has been the provision of HEPPP funding to allow institutions, often working in partnerships, to influence particular key points in the student ‘life cycle’ to encourage more students from equity target groups to, among other things, consider higher education to be a possibility for them, to build academic attainment and to be more fully conversant with the opportunities available to them. HEPPP funding has provided an important resource for universities and has led to a wide range of significant initiatives across the nation. There remains much to be done. Despite increased participation for students from equity groups, the participation rate for students from low SES, Indigenous and remote backgrounds (as well as other educationally disadvantaged backgrounds) remains below parity—in some cases, well below. The participation ratio for low SES students is 0.62, with 1.0 indicating parity, whereas that of Indigenous students is 0.55, and students from remote backgrounds, 0.39. Some institutions have achieved little or no gains in the proportion of low SES students among cohorts of commencing students, although others have generated increases. The reasons for the unevenness across the sector are not clear. There remain widespread beliefs, often tacit, that allowing more educationally disadvantaged people will lead to higher attrition rates or a lowering of academic standards in order to achieve successful completions. In fact, there is little evidence for these perceptions. Once at university, low SES students are not substantially less likely to successfully complete their studies, having approximately 96% of the retention and success rates of domestic students overall. For these reasons, we believe that initiatives to increase access for educationally disadvantaged students are fundamentally important in meeting the Federal Government’s higher education targets for the proportion of the population with university level qualifications from low SES backgrounds. The major disparities continue to lie in access, not in retention or completion. This is not to argue that students from educationally disadvantaged do not need support once enrolled. Indigenous students and students from remote backgrounds are an exception to these conclusions. Students from these groups display notably lower retention and success rates than students from other groups. The retention rate for Indigenous students is
6
only 85% of the average onshore domestic student, while for students from remote backgrounds, it is 91%. The success rate for Indigenous students is 81% of the average; the success rate for remote students is perhaps less concerning, at 94% of the average. In these cases, targeted efforts to increase academic, financial and personal support, and therefore academic success, are particularly warranted.
The proposed Critical Interventions Framework The Critical Interventions Framework presented for discussion is summarised in Figure 1.1 on the following page. This framework is a simple typology of the broad categories of equity initiative and is designed to be a device for focusing on supporting national discussion of the most effective ways to target efforts and resources. This typology was derived from commonplace assumptions about potential barriers or inhibitors for students for equity target groups and refined following a literature review. The typology has been used to present a summary tabulation of: the plausibility or theoretical case for particular types of equity initiatives; and the available evidence, national or international, on the effectiveness of these equity initiatives. This framework is designed to inform future initiatives and to guide evaluation. It is presented in a preliminary format for future fine-tuning and refinement. The final phase of the project involved analysis of the HEPPP reports provided by institutions to the government. Information from anonymised reports were then mapped against the typology in the framework to determine a broadbrush analysis of where national efforts have been focused. This stage of the project did not seek to reach any judgements on the effectiveness of the initiatives, for the reports typically do not include evaluative evidence. It is noted that many equity initiatives implemented post-Bradley Review are relatively new and their effects may take some time to become apparent.
Strengthening the evaluation and research evidence-base A major finding of this project is the relative dearth of publicly available, peerreviewed research or evaluation, conducted with rigorous methodologies, on the effects of equity initiatives. In some cases, this is due to the high number of confounding factors that can influence, say, an individual’s decision to attend university, and the complexity of attempting to analyse those decisions within a diverse population. In these situations, it may be difficult, if not impossible, to assess the efficacy of equity initiatives and programs with any reliability. Program design in these circumstances is an act of faith, though often highly well-judged and highly credible. A stronger platform for research and evaluation needs to be developed and utilised and the results of program evaluation should be published more widely.
7
1.1.1.1.1 Figure 1.1: Factors leading to increased completion, particularly for students from low SES backgrounds.
1 The Critical Interventions Framework project 1.1 Project aims and methodology This report reviews available literature and data relating to initiatives and projects to improve the access, participation, retention, success and attainment rates of students from low socio-economic status (SES) backgrounds in higher education. These techniques and strategies have been organised into a typology based on the timing and method of the initiative. Based on findings from the literature and pedagogical assumptions about low SES students, the theoretical effectiveness or ‘plausibility’ of each initiative has been assessed, as well as important factors affecting the efficacy of an initiative. Research evidence has also been reviewed to determine the level of evidential support for these pedagogical assumptions. This interventions framework, detailed in the next chapter, forms the major outcome of this project. The report also contains a broadbrush summary of statistical data supplied by the Department of Innovation, Industry, Climate Change, Science, Research and Tertiary Education (DIICCSRTE) concerning under-represented groups over the five years since the 2008 Review of Australian Higher Education. The purpose of this report is to help identify the initiatives that might be the most effective in addressing the persistent under-representation of low SES people in higher education with a view to informing policies and strategies to guide resource deployment and providing a framework for instituting and evaluating equity initiatives. Identifying the volume and quality of rigorous research and evaluation support for equity initiatives is a particularly important objective. A primary goal of the project was therefore to examine the evidence of efficacy for the range of initiatives designed to increase access, retention and success for students from equity target groups, especially those from low SES backgrounds. The specific were to: identify the range of methods, techniques, strategies and initiatives that are or have been used to increase higher education access, participation and success for people from low SES backgrounds; summarise and evaluate the evidence of the effectiveness of the initiatives identified as priority areas; identify the extent to which timing or other contextual factors may impact on the efficacy of the initiative; indicate the quality and consistency of the evidence for the effectiveness of the initiative; and where possible, indicate the strength or statistical effect size of the initiative. The project focused on initiatives targeting domestic students from low SES backgrounds generally, from regional and rural backgrounds, and Indigenous students. To achieve these goals, a simple notional typology of initiatives was developed. This typology was derived from widespread assumptions about potential barriers or inhibitors for low SES students rather than a comprehensive empirical conception of the terrain, for none such exists. Statistical data were analysed to establish a
background against which these initiatives were operating, and to validate the hypothesised ‘blockage’ points. The typology was refined following an extensive literature review, and the theoretical or pedagogical assumptions underlying the initiatives were determined. A further review of the literature was performed to establish the extent or strength of the research evidence supporting the use of each initiative. To qualify for inclusion, studies were required to report empirically validated, methodologically sound findings; purely theoretical papers were not included. When analysed in this way there is a paucity of evidence in the international literature on the effects of particular equity initiatives even though these might have face-validity. The final phase of the project involved analysis of the HEPPP reports provided by institutions to the government. Information from anonymised institutional HEPPP reports were then mapped against the typology to determine where institutions had focused their efforts and further inform the range of initiatives in the typology. Although similar initiatives were grouped together in this typology, we cannot be sure that surface similarities used to group initiatives equate to similarly effective outcomes; individual factors in the way institutions deploy an initiative may lead to different degrees of efficacy. Nonetheless, the analysis points to the emphases in the initiatives devised by institutions in utilising HEPPP funds — the aggregate patterns across the nation. This stage of the project did not seek to reach any judgements on the effectiveness of the initiatives, for the reports typically do not include evaluative evidence. It is noted that many equity initiatives implemented post-Bradley Review are relatively new and their effects may take some time to become apparent, though many have been in place for many years in some form.
1.2 The policy context Compared with many nations, Australia has a well-developed understanding of equity issues in higher education, aided by a long-established policy framework of equity initiatives and a considerable database of information concerning a wide range of factors including age, gender, SES, locality, ethnicity and disability (James et al 2008, p. 13). In 2008, the Bradley Review performed a sweeping review of the Australian higher education sector. Equity, and the performance of equity groups, formed a major part of the analysis. Bradley et al (2008, pp. 27, 29) reported that there had been success in previous areas of inequity—women, for example, now outnumbered men in higher education except in research higher degrees, engineering and information technology—but students from regional and remote areas, Indigenous students and those from low SES backgrounds were still seriously under-represented. In fact, the participation ratios for these groups had either remained stable for many years, or, in some cases, worsened (Bradley et al 2008, pp. 30-32). The argument for improving the participation of these groups has multiple dimensions. From a purely economic point of view, there are strong benefits for both individuals and society in having higher education qualifications: “Over the working lifetime of a university graduate the financial gain generated from income is more than $1.5 million or 70 per cent more than those whose highest qualification is Year 12” (Payne and Percival 2008). However, there are also social benefits. As Bradley et al. expressed is not only necessary for maintaining a high standard of living in Australia but also underpins a robust democracy and a civil and just society (Bradley et al 2008, p. xi). 10
In response to the Bradley Review, the Federal government released Transforming Australia’s Higher Education System (Commonwealth of Australia 2009). Acknowledging the importance of providing the opportunity for all Australians, especially under-represented groups, to access the tertiary education system based on merit rather than their ability to pay, the government established targets for higher education achievement. By 2025, 40 per cent of 25 to 34 year olds will hold a bachelor degree or higher, increasing from the contemporary level of 32 per cent. This target requires the graduation of an additional 219,000 students by 2025. To graduate this many additional students at the completion rate of 72 per cent cited in the Bradley review (Bradley 2008, p. 21, OECD 2008) will require the enrolment of 304,000 new undergraduate students by 2021 (Sellar et al. 2011). To help achieve this goal, and well as to reduce educational and subsequent financial and social inequality, 20 per cent of university enrolments (the participation rate) at the undergraduate level will be of people from a low SES background by 2020, which additionally has led to setting a number of targets for secondary school achievement as well as increased funding for pathway programs, financial support for students and changes to the sector’s funding structure. It is through these new enrolments that the 20 per cent participation target for low SES students is linked with the broader attainment goals. The major barriers to the participation of students from low SES backgrounds, as described in the Bradley review and acknowledged by the government, are educational attainment, lower awareness of the long term benefits of higher education, less aspiration to participate, and the potential need for extra financial, academic or personal support once enrolled (Commonwealth of Australia 2009, p. 13). Equity initiatives are implemented to address each of these barriers. The Australian higher education equity agenda, as currently defined, derives from the landmark discussion paper, A Fair Chance for All (Dawkins 1990): The overall objective for equity in higher education is to ensure that Australians from all groups in society have the opportunity to participate successfully in higher education. This will be achieved by changing the balance of the student population to reflect more closely the composition of the society as a whole.
A Fair Chance for All designated the current equity target groups, broadly following the disadvantaged social groups identified in the mid 1970s, which were later codified in the Australian equity framework (Commonwealth of Australia 1990). They have changed little since. These equity groups are: people from low SES backgrounds; people from regional and remote areas; people with a disability; people from non-English speaking backgrounds; women in non-traditional areas of study and higher degrees; and Indigenous people. Identification of people in these groups is typically collected at enrolment based on self-identification or, in the case of regional, remote and low SES students, derived from assumptions based on their address. This method, and the groups themselves,
11
have changed little since their original classification. The performance of equity groups is measured by five key indicators: access (the proportion of the equity group among commencing domestic students); participation (the proportion of the equity group among domestic students overall); retention (the number of students who re-enrol at an institution divided by the number of students enrolled the previous year minus completions); success (the proportion of units passed in a year to the total number of units enrolled); and completions (the proportion of students successfully completing all the academic requirements of a course).
12
2 The literature on equity initiatives The next two chapters present an overview of the context and background for the development of the proposed Critical Interventions Framework (CIF). This section reviews the literature on equity initiatives and provides a theoretical rationale or ‘plausibility’ case for the initiatives in the typology within the proposed CIF. Chapter 3 presents an analysis of recent patterns in access and participation in higher education for equity groups in Australian higher education. Key points: * There are five broad periods in a student’s life cycle where equity initiatives might be targeted: a) prior to seeking access to higher education, b) at the point of selection/admissions c) during transition, d) during an individual’s higher education studies, and e) during the post-completion period of finding employment relevant to the studies completed. * Outreach to schools and communities forms the core of initiatives aimed at informing aspirations prior to students seeking access to higher education. While the theoretical basis, or plausibility or face-validity, of these initiatives is generally strong, there is little direct empirical evidence of the effectiveness of these initiatives. * Evidence suggests that resourcing problems in schools in low SES and nonmetropolitan areas can affect Year 12 retention and achievement, resulting in lower participation in higher education among low SES students. There is therefore an argument for implementing early initiatives aimed at improving students’ academic achievement and year 12 retention rates. * Awarding scholarships potentially affects aspiration, access and retention as they reduce both the perceived and actual financial obstacles to higher education. Providing financial support is thus a common response to increasing access for low SES students; however, this is based on the assumption that cost is the principal barrier to access, when often it may not be. * In terms of retention and success, there is plentiful evidence supporting the value of orientation and transition initiatives. These programs aim to enhance student engagement and retention, and often overlap with other initiatives targeting more general retention and success. * Providing student support services is seen as being important for reducing attrition due to personal or financial hardship, and to enhance student well-being, skills-building and overall engagement with the university. However, evidence seems to suggest that low SES students are less likely to make use of these services. In addition, there is little evidence to suggest that universities with more extensive student support services have better retention rates. Across the student life cycle, there are arguably five identifiable periods for equity initiatives in higher education: a) prior to seeking access to higher education, b) at selection/admissions c) during transition into higher education, d) during an individual’s studies, and e) during the post-completion phase of finding suitable employment, These are therefore also the points where institutions can intervene to
13
encourage an individual to undertake higher education and help them succeed once in university. A review of the major factors affecting student access to higher education at each of these points can inform the design and evaluation of initiatives.
2.1 Prior to seeking access to higher education This section examines initiatives that operate relatively early in an individual’s life, informing their aspirations and those of their families and communities. These initiatives aim to increase the proportion of students who complete Year 12 and are therefore eligible to apply for university. Behrendt et al (2012, p. xi) describes this as “unlocking capacity and empowering choices.” This captures the two different aspects of initiatives operating prior to an individual seeking access to higher education: to build skills where necessary; to help individuals reach a point where they are eligible to enter higher education, should they so choose; and to inform their aspirations regarding higher education, particularly in relation to beliefs about who “belongs” at university and who doesn’t. Three closely interlinked factors prevent students from low SES backgrounds from attempting to access higher education: lower Year 12 completion rates, lower academic achievement, and alternative aspirations. There is little impetus to do well at school, or stay in school past Year 10, for example, if one aspires to enter a job that requires no qualifications beyond completing Year 10. Students also moderate their aspirations to study at school and beyond based on academic achievement. The three factors therefore thread together in complex ways, and programs that operate at this point in the student life cycle are therefore frequently also multi-factorial -- that is, a program may involve informing aspirations as well as increasing academic achievement. Outreach to schools and communities forms the core of these initiatives. This outreach can be directed to specific communities and age groups, or undirected, as in the case of general marketing which may involve an equity message. Directed outreach may involve university visits to schools and communities, or, conversely, university experience programs where students visit an institution (to make universities seem less intimidating and perhaps enable students to see that university students are not so different to themselves). These initiatives may target children in late primary and early secondary school, students in later-year secondary education, or adults who may not currently be undertaking any form of education. The theoretical case for these initiatives is generally very good; as discussed below, good data exists about the barriers to higher education many students face, and these initiatives typically seek to remove these barriers as much as possible. However, it is much harder to obtain data and evaluate an initiative’s effectiveness, given that other factors such as differences in the student body, school culture, staff capacities and other factors may confound the analysis. Likewise, schools or communities that partner with universities may undergo structural or cultural changes that are unrelated to the program. Even broader structural changes (such as the uncapping of university places following the Bradley review) may also affect the proportions of students attending university from particular areas, further confounding program evaluation. This problem was encountered by Morris and Golden (2005) in their evaluation of Aimhigher in the UK: although they showed a slight increase in GCSE achievement and the proportion of students intending to participate in higher education in schools with Aimhigher programs, this effect was impossible to trace to specific initiatives rather than systemic changes.
14
Removing barriers to higher education is highly contingent upon a number of factors including access to, and completion of, Year 12. For low SES students, Year 12 completion rates are significantly lower than that for students from medium or high SES backgrounds (James et al 2008). In 2006, an estimated 59 per cent of low SES students completed Year 12, compared to 78 per cent of high SES students and 64 per cent of medium SES students. Of those who completed Year 12, 38 per cent went to university, compared to 43 per cent of medium SES students and 60 per cent of high SES students (DEST, cited in James et al 2008). Similarly, an estimated 52 per cent of students from remote backgrounds completed Year 12 in 2006, compared to 62 per cent of those from regional backgrounds and 69 per cent from urban areas (DEST, cited in James et al 2008). Teese et al (2007) reported that a disproportionately high number of early leavers are from non-metropolitan areas: 41.9 per cent of early leavers surveyed in the On Track project were from non-metropolitan areas. The current proportion of Australians from regional and remote areas is 31.3 per cent, indicating that this figure is 133 per cent of parity—a substantial over-representation. Indigenous secondary school students are even less likely to complete Year 12 and thus be eligible to apply to university. The proportion of full-time Indigenous students who continued to Year 12 in 2010 relative to those who commenced in Year 7 is 47.2 per cent. For non-Indigenous students, the apparent retention rate is 79.4 per cent (Behrendt et al 2012, p. 6; SCRGSP 2011, p. 4.58). Indigenous students are therefore much less likely to commence Year 12 than non-Indigenous students. They are also less likely to complete Year 12: the completion rate in 2008 was 45.4 per cent of Indigenous students, compared to 88.1 per cent of non-Indigenous students (Behrendt et al 2012, p. 6; SCRGSP 2011, p. 4.49). In the same year, around 10 per cent of Indigenous students who completed Year 12 gained a university entrance score, compared to around 46 per cent of non-Indigenous students (Behrendt et al 2012, p. 6; DEEWR 2008, pp. xxi, 35). Much of the literature cites lower Year 12 retention rates as a contributing factor to lower participation in higher education in regional areas and Indigenous communities, which may be attributed to poor quality schooling and lack of schooling choice in regional areas (DEEWR 2010, Creswell and Underwood 2004, Lamb et al 2000, Lamb et al 2004, Marks 2007). The Programme for International Student Assessment found in 2006 that students in the lowest SES quartile and students from remote schools were approximately twice as likely to perform below the baseline scientific literacy proficiency compared with Australian students generally (23 per cent and 27 per cent compared with 13 per cent respectively—Thomson and De Bortoli 2008). In the same year, the On Track survey found that 61.3 per cent of all low achievers in Year 12 came from low to very low SES backgrounds (Teese et al 2007). The link between low academic achievement and the likelihood of dropping out of school has been clearly established (Lamb et al 2004, Teese et al 2007). Schools in low SES and non-metropolitan areas are more likely to suffer from resourcing problems, have a limited number of teachers, and have less access to high quality teaching resources, all of which have been shown to play an important role in Year 12 retention and achievement (DEEWR 2010, Welch et al 2007, Creswell and Underwood 2004, Lamb et al 2004). These factors suggest that low SES students may be poor candidates for university study by the time they reach Year 9 (Cardak and Ryan 2009), which means that any attempt to improve academic achievement and Year 12 retention rates should be done as early as possible. Intervening to increase student preparation may also be effective (Warburton et al. 2001). 15
A common finding in the literature (James et al. 1999; Archer and Hutchings 2000; James 2002; James et al. 2008) is that student from low SES and rural backgrounds aspire to non-higher education pathways in larger numbers than high SES students. Only 42 per cent of low SES and 50 per cent of medium SES students in Years 10 to 12 planned to enter university, as opposed to 69.5 per cent of high SES secondary school students (James et al 2008, James et al 1999). Indigenous students are also more likely to seek entry to VET rather than higher education; 4.6 per cent of all enrolments in VET in 2010 were from Indigenous students, and Indigenous students aged 15 to 19 participate in VET in approximately similar numbers to those participating in school (NCVER 2010, Behrendt et al 2012). James (2002) believes these alternative aspirations to be due to “the cumulative effect of the relative absence of encouraging factors and the presence of a stronger set of inhibiting factors.” A major deterrent for low SES students is the perceived cost of higher education, which includes fees, relocation costs, travel costs and other costs associated with travel (James 2002, Teese et al 2007, Hillman 2005). While these costs are often not insignificant, particularly for those students who are forced to relocate to study, students often overestimated the financial burden of higher education (James et al 2008). Awarding scholarships therefore potentially affects aspiration, access and retention, as they reduce both the perceived and actual financial obstables to higher education. Initiatives addressing the costs of university study will be addressed in the next section; they are mentioned here because of their impact on the aspirations of students. Many studies have found that non-metropolitan students are less likely to aspire to university study than metropolitan students (Alloway et al 2004, Khoo and Ainley 2005, Kilpatrick and Abbott-Chapman 2002, DEEWR 2010). Low academic achievement also often influences entry to VET before school completion for Indigenous students; Indigenous students are more likely to seek options that require minimal post-school training and education, typically because of a lack of confidence in their academic ability (Lamb et al 2004, Craven et al 2005). James (2002) also found that low SES students were less confident than their high SES counterparts that their academic results would be good enough for entry into courses that might interest them, although this lack of confidence does not significantly affect their performance once enrolled. Students from low SES and rural backgrounds are also less likely to see a relevance between university study and the careers they are interested in; they are more likely to believe that a TAFE course would be more useful and rewarding (James et al 1999, James 2002). The lower Year 12 completion rates for boys from regional areas may be due to increased aspiration for VET rather than school or higher education (Marks and Fleming 1999, DEEWR 2010). In many studies, the development of aspirations has been linked to family and community attitudes towards further study (James et al 1999, James 2002, Kilpatrick and Abbott-Chapman 2002, James et al 2008, Bok 2010). James et al (1999) found that low SES students were less likely to feel that their parents encouraged them to do well at school or that they often discussed school work with family members. Kilpatrick and Abbott-Chapman (2002) found that the student’s mother was particularly important in almost all cases. Several studies (Lamb et al 2004, Craven et al 2005, James and Devlin 2006, Bok 2010, James et al 2008, Behrendt et al 2012) have found that parents and other family members are eager to assist with their child’s education in any way they can, but, having less familiarity with higher education may limit their capacity to help negotiate school and university pathways where no member of the family has 16
previously attended university and in the absence of community role models who have. This may be particularly important in Indigenous communities (Lamb et al 2004, Craven et al 2005, James and Devlin 2006, James et al 2008, Behrendt et al 2012). Teachers in low SES areas may also be less encouraging than those in high SES areas (James et al 1999, James et al 2008, Bok 2010). The effect of college access programs on the motivations of students from low SES backgrounds in the US is reviewed in Harvill et al (2012). Although the authors counsel against drawing strong conclusions from their meta-analysis, they found that measures of completed coursework were the best pre-college indicators of college graduation, and should therefore be included in access program evaluation measures. They also found sharp differences between the estimated effect sizes of programs that used a quasi-experimental design and randomised controlled trials, suggesting that quasi-experimental designs may not be effectively identifying causal impacts, and that care should be taken when interpreting programs of this nature (Harvill et al 2012). Many Indigenous students and students from low SES and rural backgrounds choose to enter VET instead of university—another example of alternate aspirations, and perhaps of differences in academic achievement. For that reason, informing the aspirations of VET students about the opportunity to progress to university after VET is another important pre-access initiative (in conjunction with having clear VET-HE pathways, discussed in the next section). The Bradley report highlighted the importance of enhancing the pathways between VET and university in meeting participation targets for higher education (Bradley et al 2008, p. 212). Stanwick (2006) found that nearly 9 per cent of students aged under 25 commencing higher education in 2003 had a diploma or above, while over 30 per cent of commencing students aged 25 and over had a diploma or above. Thus, some mature aged students, as well as younger students, are using diplomas as a stepping-stone to higher education. In some fields of education, such as banking and accountancy, half of VET diploma graduates aged under 25 go on to university (Stanwick 2006; Wheelahan 2009). However, the effectiveness of these pathways in mobilising educationally disadvantaged students into higher education has been questioned. Bradley et al (2008, p. 43) observed that the socioeconomic composition of VET students undertaking the high level diplomas and advanced diplomas required to transfer to university study is similar to higher education students. That is, groups that are under-represented in higher education are not entering pathways that could ultimately allow them access to university, perhaps due to a number of structural and individual barriers (Aird et al. 2010). This finding was confirmed by Wheelahan (2009), who found that, in general, VET pathways were not functioning as a mechanism for redressing socioeconomic disadvantage in higher education. While 10.3 per cent of students in VET were enrolled in diplomas or above, only 6.8 per cent of students from low SES backgrounds were enrolled in these qualifications, as opposed to 10.8 per cent and 13.9 per cent of students from middle and high SES backgrounds respectively, and the percentage of low SES students progressing to university is not significantly different to the percentage of low SES students currently in higher education (Foley 2007; Wheelahan 2009). Conversely, low SES students are overrepresented in low-level VET qualifications that do not make them eligible to transfer to universities (Foley 2007, Wheelahan 2009). This may therefore present an opportunity to inform VET students about the courses that will allow them access to higher education, and to engage in outreach to make university relevant, achievable and valuable for these students.
17
VET pathways also do not provide equal access to all universities. While there is some variation, in general, Group of 8 universities admit 23 school leavers for every one prior VET student, while other universities admit just over three school leavers per prior VET student (Wheelahan 2009). Dual-sector universities, however, have dramatically increased the percentage of VET articulators as part of their commencing domestic undergraduate students “through conscious policy commitment” (Wheelahan 2009), although this may not hold for Indigenous students (Behrendt et al 2012). Taken together, these data indicate that VET pathways are an under-utilised route for addressing social inclusion aspirations for educationally disadvantaged groups. Further work is required to increase the proportion of students from low SES backgrounds undertaking diploma and higher-level VET studies before these pathways will generate a significant change in the socioeconomic composition of students transferring to higher education.
2.2 At selection and admissions This section examines initiatives that promote an individual’s access to higher education after graduating from secondary school, by providing financial support and encouragement, and increasing eligibility through alternative pathways. An intuitive response to increasing university access for students from low SES backgrounds is to provide financial support. As Le and Miller (2005, p. 162) state, “Addressing the socioeconomic imbalance within the tertiary sector in the current era would seem to require equity-based scholarships or university fee rebates to be provided to Year 12 graduates”. This view is acknowledged in the Bradley Review (Bradley et al 2008) and the government response (Commonwealth of Australia 2009) through changes to income support payments, HELP schemes and so on, and has shown to be effective (Chen and DesJardins 2008; Carson 2010). People from low SES and non-metropolitan areas are more likely to perceive that there are higher costs associated with university study (Godden 2007, James et al 1999, James 2002, Alloway et al 2004, Carson 2010). Many of the costs are associated with relocation, and, as up-front costs, may be well beyond the income capacity for disadvantaged rural families (James et al 1999). Many are also reluctant to become over-reliant on their parents, which may also reduce their desire to attend higher education (Alloway et al 2004). However, while these initiatives are important and necessary, they do not represent a silver bullet. “This myth is based on the assumption that cost is the principal barrier to access. Cost is a factor, but it is not the only factor” (James 2009). There is strong evidence from the USA that, in targeting initiatives to reduce financial hardship, how these initiatives are provided has significant effects on their effectiveness. Reviews of the literature by Heller (1997), Jackson and Weathersby (1975) and Leslie and Brinkman (1988), referenced in Heller and Ramussen (2002), have shown that grants have a stronger effect on university enrolment than an equal value of student loans or work study awards, and that educationally disadvantaged students (African American, Hispanic and low income students) are more responsive to these initiatives than White and middle- and upper-income students by a factor of three to four times (Heller 1999; Allen et al. 2005; Hu 2010). Furthermore, need-based scholarships are successful in promoting access for educationally disadvantaged students, while merit-based scholarships serve only to enforce the status quo. There is a very strong relationship between socioeconomic status and performance in Year 12 which has been observed both in Australia (Cardak 18
and Ryan 2009) and overseas (Heller and Ramussen 2002), which leads to a strong relationship between socioeconomic status and the rate at which students qualify for merit scholarships. Cardak and Ryan (2009) did not find any significant difference in university participation between students from high and low SES backgrounds who achieved the same ENTER score. However, they also found that the ENTER score students achieved rose with SES status. The difference in ENTER scores between the very highest and very lowest SES scores (as determined by father’s occupation) was 10 points. As James (2009) states, “ENTER is not a measure of intrinsic individual intellectual ability. ENTER partly measures the cumulative advantage or disadvantage of family, school and community circumstances… it is a less than perfect proxy for the potential of individuals to thrive in and benefit from university study.” Or as Gale (2012) puts it, “the ATAR is more indicative of socioeconomic status than it is of a student’s academic potential.” In Heller and Ramussen’s (2002) study, a high school in a wealthy suburb of Detroit sent 94 per cent of its students on to some form of postsecondary education before a state-wide merit-based scholarship program was introduced. Sixty-four per cent of those students qualified for scholarships, indicating that at least 58 percent of the scholarships went to students who were likely to attend higher education anyway. In contrast, high schools in poor areas of Detroit had less than 40 percent of their students going on to higher education, and less than 15 percent qualified for the scholarships. Thus, merit-based scholarships did not increase the access of educationally disadvantaged students, whereas providing grants to students on a needs basis may have been more successful. Similarly, initiatives that acknowledge the relationship between SES and ATAR scores to select students for entry to university are important.
2.3 During transition Moving to higher education can be a very confronting experience. As Hunter (2006) says, “The first college year is not ‘grade 13.’ Incoming students, whether they come to college from high school or from the world of work, enter a new culture… [with] a foreign set of norms, traditions and rituals, and a new language and environment.” This is particularly true for students from low SES and rural backgrounds, who are much more likely than others to believe that their Year 12 studies did not prepare them adequately for first year university (James et al 2010). Academic transition is normally thought of as encompassing orientation in the first few weeks of study and beyond, into the first two or three semesters. There is therefore a large overlap between transition initiatives and initiatives targeting more general retention and success. Unlike initiatives targeting access, transition programs tend to target the cohort as a whole, rather than focusing on specific sub-groups (although Lefoe et al (2002) describe a transition program targeting students from rural backgrounds; programs of this nature may be important in reducing the high attrition rate among students from remote backgrounds). A great deal of research has been carried out in the area of transition to first year. James et al (2010) conducted a longitudinal survey of the first year experience in Australia, while Pascarella and Terenzini (2005) provides an overview of the current research from the USA. Because of this large body of literature, good evidence exists in support of transition initiatives.
19
In Australia, one third of first year students consider withdrawing during the first semester (McInnis et al. 1995; McInnis et al. 2000), often for adjustment or environmental factors—a lack of clearly defined goals, a mismatch with university culture, or feelings of isolation—rather than because of intellectual difficulties (Pitkethly and Prosser 2001). While some factors contributing to withdrawal may be beyond the reach of the university, other factors can be influenced by providing an effective transition experience, and ensuring adequate opportunities and support for students to develop the skills needed for academic success (discussed in Section 2.4; see also Skene and Evamy (2009)). Effective transition programs have several underpinning objectives (Pitkethly and Prosser 2001, James et al 2008, James et al 2010): to familiarise students with the university by introducing them to the physical environment, explaining academic culture and promoting the wider student support services available; to develop student’s sense of purpose by promoting a clear understanding of the aims, learning outcomes, learning processes, assessment methods and teaching and learning methods of their subjects; and to facilitate student’s engagement in university life, including engagement with their peers. Orientation programs typically seek to provide a strong foundation in these principles, which will continue to be built on in first year and later study. Some also include programs on independent living for first year students (James et al 2008). Orientation programs can also build an “espirit de corps” among new students, providing them with confidence and social support networks to assist with academic and personal support (Twale, 1989). This can lead to enhanced student engagement, which is a particularly important aspect of success in higher education. Engagement motivates students to adopt adaptive strategies that make transition easier (Bean and Eaton 2001; Dennis et al. 2005; Friedlander et al. 2007). Rubin (2006) notes that students from low SES backgrounds tend to be less involved than their middle-class peers in social relations at university. This lack of engagement includes formal activities, such as athletics or clubs and societies events, and informal activities such as socialising with peers on campus. A possible reason for this is the limited time spent on campus generally, perhaps due to the need to work longer hours in casual or parttime employment. Also, as previously discussed, students from low SES areas are less likely to have family members with the necessary experience to provide helpful support or act as role models, although university friends may help cover this gap in family experience (Dennis et al 2005, Friedlander et al 2007, James et al 2010, Rubin 2012). James et al’s (2010) study shows that students at risk of low achievement and failure are less likely to study with other students. Orientation and transition programs can therefore be important in enhancing engagement through providing initial social networks to provide academic and personal support. These sentiments are echoed in Hansen et al (2008). The importance of engagement and cohort construction also has important implications for academics, particularly those who heavily use e-learning or other dispersed modes of teaching.
20
While providing appropriate orientation and transition support for equity groups can be beneficial for student engagement and hence retention, the design of the programs will affect the effectiveness of the initiative. For example, “streaming” or requiring additional orientation for educationally disadvantaged students over or in place of what other students do may stigmatise them, counter-productively leading to disengagement. Beginning familiarisation with academic practices and expectations, perhaps in partnership with the professions for some fields of study, from an early stage can also aid retention. When expectations are communicated clearly, students often find it easier to adjust to the new educational environment (Miller and Pope 2003).
2.4 During an individual’s studies Several commentators, including the Bradley Review and the Federal Government (Bradley et al 2008, Commonwealth of Australia 2009) maintain there is a need for increased support at university for students from equity groups in order for them to be successful. Some (e.g. Tinto 2006) suggest that it is because of the support they have been provided that these students have comparably high retention and success rates. While it is true that educationally disadvantaged students are more likely to enter higher education as mature aged students, and therefore may have increased financial burdens or personal and family responsibilities (Gale 2012, James 2007, Edwards and Coates 2011, Behrendt et al 2012), there is little evidence to suggest that universities with more extensive student support services have better retention rates for any group of students (Gale 2012). In their study of what low SES students believed to be the most effective factors in their successful completion of first year, Devlin and O’Shea (2011) found that institutional support was ranked after the student’s behaviour or attitude and teacher approachability. However, sub-factors relating to institutional support comprised 3 of the top 6 sub-factors overall contributing to success, out of a total of 17. Notably, the factors identified were having high quality online discussion forums (ranked fourth), online learning facilities (fifth) and library services (sixth). While it might be argued that students may not be fully aware of the factors that lead to their success, this demonstrates that institutional support—particularly services that allow students to access their education from home or at convenient times—is important, although not most important, for student success. Initiatives targeting retention and success, particularly in first year, show a high degree of overlap with initiatives targeting transitions. Several transition objectives— explaining academic culture, clearly articulating the aims, outcomes and methods of a subject, and facilitating engagement with the university and with their peers (Pitkethly and Prosser 2001)—are principles of effective teaching and learning generally, and important for retention and success, not just during the initial transition to university (Ramsden 2003; Biggs and Tang 2011). There is thus an argument for providing adequate support for students to develop the generic and discipline-specific academic skills needed to succeed in their studies. The provision of student support services seeks to reduce attrition due to hardship and ensure that students are not impeded in their studies by financial or personal conditions. They also seek to improve the student’s wellbeing, provide opportunities for skill-building, increase engagement with the university and enable students from disadvantaged backgrounds to build social capital through participation in activities while at university. Since students from low SES and Indigenous backgrounds are 21
more likely to be mature aged than other students, they are potentially more likely to need to make use of these services (such as childcare facilities) to be able to study. Help with childcare has been shown to be a particularly important factor in success for some students (Zepke and Leach 2010). However, as noted above, they are also less likely to make use of them, perhaps due to a preference for seeking support from personal contacts (including family members and departmental academics rather than general support services), ignorance of service availability, or a lack of a sense of entitlement to these services (Tones et al 2009, Benson et al 2009). Thus, ensuring they are cost-effective, convenient to use and that students are aware of their existence— perhaps using departmental staff as advocates for support services to their students—is important to their success.
22
3 The recent patterns of access and participation for equity groups Students in the historically designated equity target groups continue to be disadvantaged in terms of their access to and participation in higher education in Australia. Students with disabilities and students from remote areas have particularly low participation ratios —the ratio of share of places to estimate proportion of the population — at 0.48 and 0.39 respectively, and of the groups examined here, only students from non-English speaking backgrounds are close to achieving population parity, with a ratio of 0.82. In most cases, participation ratios for equity groups have remained relatively stable during growth in the higher education sector as a whole. While growth in the number of women in non-traditional areas and students from remote areas has fallen, growth in the numbers of Indigenous students, students from low SES backgrounds and students with disabilities has outstripped the expansion of the sector as a whole, which has expanded by 16.4% since 2007, which is used in this report as a pre-Bradley Review baseline. Given the stability of participation rates in the decade before the Bradley Review, the increased participation for these groups is clearly a result of the major systemic changes in the sector, in particular the uncapping of places to create the socalled demand-drvien system. For students in most equity groups, the ability to complete their undergraduate studies is not significantly lower than the average. As Marks (2007) puts it, “if students from a low socio-economic background get to university, their background does not negatively affect their chances of completing the course” (p. 27). While retention and success rates are lower than average (with ratios of 0.97 and 0.96 of the retention and success rates of total onshore domestic students for low SES students), it is not of the same magnitude as the gap in participation rates. For Indigenous students and students from remote areas however, the retention and success rates are considerably lower than average, with success rate for Indigenous students being 81% of the average onshore domestic students, and 94% for remote students. Specific initiatives to support the retention and successful completion of these groups may be needed.
3.1 People in equity groups are under-represented in higher education The underlying aspiration for higher education in Australia is that the composition of the HE sector, and in particular the student body, reflects as near as possible the composition of Australian society. The goal of achieving parity between the composition of university and national populations helps establish aspirational targets and is a widespread conception of equity in higher education (James 2007). This aspiration is the basis for setting enrolment and completion targets for tertiary students in the Bradley Review and Transforming Australia’s Higher Education System. Table 3.1 summarises the numbers of undergraduates in equity groups participating in higher education, as a percentage of the total number of domestic onshore undergraduate students in 2007 and 2011. For comparison, the proportion of
23
Australians in these groups as a percentage of the total national population is also presented. Values for the total national population are derived from the ABS 2011 results, except where noted. Also shown in Table 3.1 is the participation ratio for people in equity groups in 2011. The participation ratio is defined as the ratio between the percentage of students in equity groups divided by the total percentage of Australians in these groups. Groups that are participating in representative proportions will therefore have a participation ratio of 1.0. As such, Table 3.1 demonstrates that these groups are indeed underrepresented in higher education compared to their incidence in the general population. Women in non-traditional areas, students from remote areas and students with a disability have the lowest participation ratios. 3.1.1.1.1
Table 3.1. Number of students in equity groups as a proportion of domestic onshore students, and as a proportion of the Australian population. Also shown is the ratio between the proportion of these groups in higher education in 2011 to the total national population.
Equity Group Students with a disability1 Indigenous students Students from Non English Speaking Background Women in Non-Traditional Areas Low SES (postcode measure) Low SES (CD measure) Regional Remote
2007 (%) 4.32 1.26 3.11 18.74 16.09 18.72 1.03
2011 (%) 5.07 1.38 3.1 17.47 16.76 15.57 18.63 0.91
Australia (2011; %) 10.6 2.5 3.8 50.6 25.0 25.0 29 2.3
Participation Ratio (2011) 0.48 0.55 0.82 0.35 0.67 0.62 0.64 0.39
3.2 Most students from educationally disadvantaged groups are no less likely to successfully complete their studies Successful completion of studies can be measured in two ways. The retention rate measures the number of students who continue their studies from the previous year, as a proportion of the total minus the number of completions. Because of the difficulties in collecting these data accurately, this should be seen as an apparent retention rate; the actual retention rate is likely to be slightly higher than that quoted. The success rate is the proportion of subjects passed by students compared to the total number of subjects undertaken. No clear trends were seen in the retention and success rates of students in equity groups for the years following 2007; instead, the data had the appearance of somewhat volatile movement around a stable central value. For that reason, the mean retention and success rates over this period were used for comparison. Retention rates for 2011 were not available at the time of this analysis, so the mean was calculated for the period 2007 to 2010; success rates were calculated for the period from 2007 to 2011. As can be seen in Table 3.2, different equity groups display different levels of educational disadvantage in terms of their ability to successfully complete their studies. While success rates are lower than is the case for total domestic onshore students, in most cases they are not substantially lower. A similar situation is seen in terms of their 1
ABS 2009; national data exclude profound and severe core activity limitation.
24
retention rates. Indeed, retention rates for students from non-English speaking backgrounds and women in non-traditional areas are actually higher than the norm. Therefore, students from most equity groups are almost as likely to successfully complete their studies as any other student. This is consistent with previously reported data (Bradley et al 2008, p. 30, Marks 2007, p. 27). Indeed, Bradley et al. (2008, p. 30) report a success ratio of 0.97 for students from low SES backgrounds using the postcode measure, which they describe as having been “very stable” over the last five years. As Table 3.2 demonstrates, the average success ratio for this group is still 0.97, indicating that it has been stable at this point for nearly a decade. Similarly, DIISRTE data indicated that the retention and success rates for students from regional backgrounds have been stable over the last decade. 3.2.1.1.1
Table 3.2. Mean overall retention and success rates for students in equity groups, showing the difference to mean retention and success rates for total onshore domestic students. Also shown is the ratio between each group’s retention and success rate and that of total onshore domestic students.
Equity Group Students with a disability Indigenous students Students from Non English Speaking Background Women in Non-Traditional Areas Low SES (postcode measure) Low SES (CD measure) Regional Remote Onshore Domestic Students
3.2.1.1.2
Mean 78.8 69.5 85.7
Retention Difference -3.4 -12.7 3.6
Ratio 0.96 0.85 1.04
Mean 79.2 68.3 81.9
Success Difference -5.6 -16.5 -2.9
Ratio 0.93 0.81 0.97
83.4 80.4 79.5 80.5 75.1 82.2
1.2 -1.8 -2.7 -1.7 -7.1 0
1.01 0.98 0.97 0.98 0.91 1.0
84.2 82.0 81.0 84.3 79.3 84.8
-0.6 -2.8 -3.8 -0.5 -5.5 0
0.99 0.97 0.96 0.99 0.94 1.0
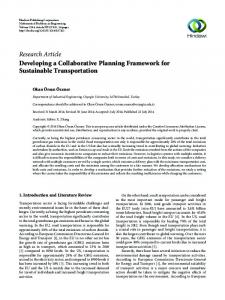
Figure 3.1. Average retention and success rates for students in different equity groups. The dotted line indicates the approximate retention and success rate for total domestic onshore student numbers for comparison.
25
However, two groups notably do not follow this trend. Indigenous students have substantially lower retention and success rates than the overall average. Students from remote areas are also much less likely to successfully complete their studies than average, although not to the same extent as Indigenous students. These data continue the trend described by Bradley et al (2008, pp. 31-32). These patterns are particularly obvious in terms of a student’s retention and success rates at first year. The first year of a student’s studies is known to be the period of greatest risk in terms of retention and success, regardless of any equity subgroup membership. However, Indigenous students and students from remote areas are even more likely to drop out or fail units in their first year than students in other groups, and the risk of them failing units is higher than the risk faced by students in other groups (as shown in Table 3.3 by the ratio between success rates in first year to their success rates across the whole course of study). Thus, while first year is a period of increased risk for all students, it is substantially riskier for Indigenous students and students from remote backgrounds, and even if they can successfully complete first year, these students are still much less likely to complete their studies overall. Students in other equity groups are slightly less likely to successfully complete their first year of study than average, and have only a slightly higher risk at first year than in late years. These findings indicate that access and participation are much more pressing issues to redress the under-representation of most equity groups in higher education than retention and success. This is not to suggest that policy should focus entirely on access, but it is clear that the largest disparities emerge from students’ ability and desire to enter university in the first place, not from being unable to cope with their work once there. It also demonstrates the falsity of the idea that introducing more educationally disadvantaged students into the system will substantially lower standards; students from equity groups, once at university, are approximately as successful as other students. 3.2.1.1.3
Table 3.3. Ratio between the retention and success rates at first year for equity groups and the retention and success rates at first year for total onshore domestic students. The ratio between the retention and success rates for each group at first year compared to the retention and success rates over their whole course of study is also shown.
Equity Group
Ratio to total domestic onshore students at first year Retention Success 0.97 0.95 0.83 0.78 1.07 0.96 1.02 0.98 0.98 0.96 0.97 0.95 0.98 1.0 0.90 0.92 1.0 1.0
Students with a disability Indigenous students Students from Non English Speaking Background Women in Non-Traditional Areas Low SES (postcode measure) Low SES (CD measure) Regional Remote Onshore Domestic Students
Ratio to overall retention or success rate for group Retention Success 0.98 0.98 0.96 0.93 0.99 0.96 0.97 0.95 0.97 0.96 0.97 0.95 0.97 0.97 0.96 0.94 0.97 0.96
The notable exceptions to this are Indigenous students and students from remote backgrounds (two groups that have previously been shown to show a high level of overlap—James et al 2004).
26
3.3 How has the participation of students in educationally disadvantaged groups changed since 2007? Since 2011, the total number of domestic onshore students has increased strongly, as have the total number of commencing students (Table 3.4). Although the numbers of students in several equity groups have shown similarly strong growth rates, this has not been evenly distributed between all the different equity groups. The number of students from regional backgrounds and non-English speaking backgrounds has kept pace with growth across the sector. However, the growth rate in numbers of women in nontraditional areas and students from remote backgrounds has not, indicating that, if these trends continue, participation ratios for these groups (Section 3.1) will worsen, not improve. Bradley et al (2008, p. 31) reported a similar finding for students from regional and remote backgrounds. DIISRTE data indicates that the proportion of students from remote backgrounds has decreased consistently since the early 1990s, when their participation rate was 1.5 to 1.6 per cent. While the participation rate of students from a regional background has also decreased over that same period, it appears to have stabilised since 2009. 3.3.1.1.1
Table 3.4. Change in student numbers in different equity groups over time, in terms of total domestic onshore student numbers and commencing student numbers.
Students with a disability Indigenous students Students from Non English Speaking Background Women in Non-Traditional Areas Low SES (postcode measure) Low SES (CD measure) Regional Remote Total domestic onshore
Total domestic onshore students Increase Increase Average from from annual 2007 2008 increase 36.69 34.12 8.21 26.98 25.85 6.20 16.28 12.28 3.85 8.51 21.22 15.82 3.72 16.37
8.59 19.15 18.55 14.49 7.29 14.47
2.07 4.95 5.84 3.76 0.95 3.87
Commencing students Increase Increase Average from from annual 2007 2008 increase 51.13 51.79 11.14 36.80 29.97 8.17 23.41 16.76 5.43 16.41 28.21 21.55 7.90 21.77
15.39 25.97 24.95 20.37 11.06 20.10
3.89 6.48 7.76 5.10 2.03 5.09
In contrast to these equity groups, the growth rate of students with disabilities, Indigenous students, and students from low SES backgrounds has outstripped the growth of domestic onshore students as a whole. The average annual increase in the numbers of students with a disability is over double the growth of domestic sector, both in terms of total student numbers and the number of student commencements. This growth is particularly notable in that the level of under-representation of low SES students had remained virtually unchanged for the decade preceding 2006
27
3.3.1.1.2
Figure 3.2. Average growth rates in overall and commencing student numbers between 2007 and 2011 (2008 and 2011 for Low SES, using CD measure). Dotted lines indicate the growth rate in the total domestic onshore student numbers.
(James 2007, James 2008). This suggests a systemic effect, perhaps related to the changes made in the sector following the Bradley review and the uncapping of student places, which has induced more students from these groups to enrol in higher education. Note that the average annual growth rate is not equal to a quarter (or a third) of the total increase from 2007 and 2008 because of annual compounding. Bradley et al (2008, p. 33) also reported that the access of educationally disadvantaged students, particularly low SES students, was not evenly distributed across the sector. The Group of 8 universities in particular had extremely low participation rates from low SES students, while universities with at least one rural or regional campus had higher access. Since 2007, there has been relatively little change in this pattern. Bradley et al (2008, p. 34) identified 15 universities as having met or exceeded an access rate of 20 per cent or higher for students from low SES backgrounds: UWS, Victoria, Charles Sturt, Flinders, JCU, Southern Cross, UniSA, Wollongong, Ballarat, New England, Newcastle, USQ, Tasmania, CQU and the Batchelor Institute. The DIISRTE data for 2011 indicates that, while there has been some change in the order, the universities meeting the 20 per cent threshold have not (Table 3.5). This is not to say, however, that there has been no progress in this area. Twelve universities have increased their proportion of low SES students by more than double the sector average of 0.75 per cent. Charles Darwin, Southern Cross, USQ, Flinders, Canberra and Wollongong have shown particularly large increases in their overall proportion of low SES students. Similarly, 9 universities (Charles Darwin, Canberra, Swinburne, Macquarie, Southern Cross, Flinders, Adelaide, RMIT and UNSW) have increased their proportion of low SES students, relative to their 2007 participation rate, by more than double the sector average of 4.68 per cent. Similar results were seen in terms of the proportions of low SES students commencing in 2011 (Table 3.6). Eleven universities have shown a large increase in the proportion of students from low SES backgrounds commencing study in 2011 as compared to the 28
proportion commencing in 2007, whereas ten have shown a large increase relative to their 2007 levels. While these results are encouraging, steps must be taken to ensure that these gains are sustained. 3.3.1.1.3
Table 3.5. Participation rate of students from low SES background (postcode measure) by institution. Also shown is the percentage change in these values since 2007, both in real terms and as a proportion of the 2007 participation rate.
University ANU UWA Canberra Macquarie University Sydney Melbourne UNSW UTS Swinburne University of Technology Curtin University of Technology Edith Cowan University Monash University ACU Sunshine Coast Queensland University of Technology Deakin University RMIT University Griffith University UQ Adelaide Murdoch University Charles Darwin University La Trobe University James Cook University Victoria University Ballarat Charles Sturt University Flinders UWS Wollongong UniSA Southern Cross University New England Newcastle Tasmania USQ Central Queensland University Batchelor Institute Overall
Access rate, 2011 (%) 4.25 6.22 6.92 6.96 7.10 8.33 9.96 10.77 11.49 11.76 11.83 12.24 12.97 13.89 13.97 14.06 14.53 14.82 15.14 15.45 17.32 17.94 18.61 20.49 21.41 22.10 22.73 23.26 23.59 24.98 26.04 26.15 26.95 27.74 32.82 33.83 45.65 48.64 16.87
29
Change since 2007 (overall, %) (% of 2007 value) -0.01 -0.30 0.36 6.09 2.38 52.35 1.00 16.79 -0.39 -5.26 0.67 8.75 0.95 10.55 0.82 8.25 1.68 17.09 0.99 9.24 0.53 4.70 -0.32 -2.57 0.62 5.05 0.94 7.28 -0.07 -0.47 0.96 7.35 1.54 11.83 -0.38 -2.48 -0.14 -0.90 1.73 12.63 -0.11 -0.62 6.85 61.71 0.21 1.15 -1.38 -6.32 0.76 3.66 0.64 2.97 -0.16 -0.68 2.64 12.79 1.97 9.11 2.15 9.44 1.89 7.83 3.26 14.26 1.42 5.54 0.81 3.00 0.66 2.05 2.88 9.32 0.35 0.77 1.92 4.12 0.75 4.68
3.3.1.1.4
Table 3.6. Proportion of commencing students from low SES background (postcode measure) by institution in 2011. Also shown is the percentage change in these values since 2007, both in real terms and as a proportion of the 2007 commencing student participation rate.
University
ANU UWA Canberra Macquarie University Sydney Melbourne UNSW UTS Swinburne University of Technology Curtin University of Technology Edith Cowan University Monash University ACU Sunshine Coast Queensland University of Technology Deakin University RMIT University Griffith University UQ Adelaide Murdoch University Charles Darwin University La Trobe University James Cook University Victoria University Ballarat Charles Sturt University Flinders UWS Wollongong UniSA Southern Cross University New England Newcastle Tasmania USQ Central Queensland University Batchelor Institute Overall
Low SES commencements (%) 4.40 6.88 7.22 7.55 7.89 9.96 10.28 10.51 11.92 12.00 12.57 13.62 13.75 14.62 14.76 15.86 16.06 16.39 16.51 17.71 17.81 18.58 19.49 19.53 22.00 23.43 23.80 23.99 24.44 25.30 25.79 27.47 27.80 30.00 33.68 35.41 45.50 50.71 18.06
30
Change since 2007 (% of 2007 low SES (overall, %) commencements) 0.13 3.13 0.61 9.72 2.58 55.63 0.27 3.69 1.13 16.64 1.03 11.50 0.73 7.69 0.93 9.66 0.57 5.03 2.28 23.50 1.28 11.38 0.95 7.52 0.50 3.80 1.10 8.10 -0.31 -2.04 0.52 3.36 2.09 14.92 2.70 19.69 1.03 6.68 2.35 15.26 -0.83 -4.44 4.78 34.61 -3.85 -16.51 1.18 6.42 0.89 4.23 0.75 3.32 0.16 0.69 2.64 12.36 0.88 3.73 3.45 15.77 1.42 5.83 0.48 1.77 3.11 12.58 1.84 6.53 0.88 2.70 3.16 9.81 -0.64 -1.38 5.12 11.23 1.00 5.86
3.4 Parameters of analysis This statistical analysis was developed using data published by the Department of Industry, Innovation, Science, Research and Tertiary Education (DIISRTE) for the period from 2007 to 2011. 2007 was chosen as the baseline because data from that year formed the particular focus of the Bradley Report. This analysis can therefore follow trends that were identified in the Bradley review and identify changes that have occurred since then, which may be due to the changes in the sector the review provoked. In this analysis, equity group categories include only domestic onshore undergraduate students, where onshore is taken to mean the student has a permanent home address in Australia. Students who have an offshore permanent home address are not included, although some of these students might otherwise be included in equity group categories. Percentages are expressed as a percentage of the total number of domestic onshore students, not the total number of students in the Australian higher education system. As the government targets that form the foundation of this report concern undergraduate attainment, trends in postgraduate education will not be examined here. Also note that individual students may be included in more than one equity group, although they are only counted once in the total domestic onshore students category. In particular, there are considerable overlaps between students of low SES background and other educationally disadvantaged groups. Students from regional and remote areas are over-represented among low SES students, for example (DEEWR 2010), whereas James et al (2004) reported that in 2002, 12 per cent of students of remote backgrounds were Indigenous, compared to approximately 2 per cent of the rural group and 0.8 per cent of the urban group. For this reason, although the terms of reference of this report focus on students of low SES background, this section discussed the current situation of all the major equity groups. Furthermore, it should be remembered that students in these categories are not homogeneous; the needs of a refugee in accessing higher education may be very different to a skilled migrant or a second generation immigrant who speaks a language other than English at home, but all three would be included in the students from a non-English speaking background category. Two methods were presented for calculating low SES. The postcode measure is based on the 2006 SEIFA Education and Occupation Index for the postcode of the student’s permanent home address. Postcodes in the bottom 25 per cent of the population aged 15 to 64 are classified as low SES. This method is widely used, partly because the data is easily accessible and administered, but has attracted a large amount of criticism. It is particularly inappropriate for mature aged students and postgraduates (James 2007). The CD measure is based on geocoded census collection districts, where low SES census districts are again derived from the 2006 SEIFA Education and Occupation Index for census districts. Districts in the bottom 25 per cent of the population aged 15 to 64 are classified as low SES. The geocoded census district is derived from the home address submitted by the student on their HELP Due file, which may differ from their permanent home address. Data using the CD measure was not available in 2007. Census districts are much smaller and show less internal SES variation than postcodes, thereby reducing the potential for overestimating the access of low SES students. As the following analyses demonstrate, the CD method typically results in a drop of approximately 1 per cent in participation, retention and success rates compared to the
31
postcode method, indicating that higher SES students in low SES postcodes have better access and completion rates than lower SES peers from the same area. That is, higher SES people in heterogeneous areas are educationally advantaged compared to lower SES people in the same location, and this effect has led to the overestimation of low SES students in the higher education sector (James et al 2008, Bowden and Doughney 2010). The use of both methods of SES determination is still based on the assumption that location is the best signifier of the likelihood of educational (dis)advantage. These location-based estimations do not allow for analyses that might separate geographical effects from other socioeconomic effects and are still insufficiently individualised in the way that collecting data based on parents’ educational levels would be (James et al 2008). DIISRTE has subsequently changed the way it assesses SES background2.
2
(see http://www.innovation.gov.au/HigherEducation/Policy/Pages/MeasuringTheSocioEconomic StatusOfHigherEducationStudents.aspx)
32
4 Proposed Critical Interventions Framework In the following critical interventions framework, initiatives are grouped into broad categories by which phase of the student life cycle they target. Within these broad categories, they have been further grouped into types of initiatives, with individual university programs operating at the next level of resolution. These smaller families of programs are typically united by a common purpose, which has been explicated in the second column and discussed in more detail in subsequent chapters. However, as noted below, individual programs within each initiative type may vary in effectiveness due to its unique context, pedagogy and administration. The following column provides an estimate of the strength of the initiative on a theoretical basis. The next column provides an indication of the amount of the research evidence, if any, that demonstrates that the initiative is effective. That is, whether there is evidence validating an initiative’s theoretical strength. In identifying research evidence of a particular initiative, context remains important. Research from the UK and USA—even research from Australia pre-Bradley review—was performed in a different policy and social context, which may affect its relevance to the current situation. For that reason, precedence should be given to contemporary Australian research, of which more should be published. Evaluation of equity programs and initiatives is hampered by a number of complexities and confounds. Clearly, there are a large number of factors that affect whether an individual chooses to go to university, and whether they are successful once there. First, there is individual variation. Equity groups are not monolithic; not only do they overlap in complex ways, each equity group is typically comprised of several—again overlapping—subgroups (Willems 2010). For example, the Indigenous students equity group is composed of people from a range of backgrounds—regional, remote, urban, native English speakers versus non-English speaking backgrounds, low SES, medium SES, high SES, and so on. The low SES group, comprising as it does a quarter of the Australian population, is particularly heterogeneous, showing partial overlap with many other equity groups as well as some members that do not. Within those subgroups, each individual will also be subject to a wide variety of factors affecting their attitudes to and abilities to perform in higher education. This does not mean that population- or sub-group-level strategies cannot be employed, but it does indicate that there is an issue of resolution of measurement—too specific will not generate practically applicable outcomes, while effects may be lost in the noise if too broad a brush is used (Coram 2007). Similarly, for many initiatives, there are too many variables to control in any rigorously methodological way, which makes establishing causal relationships between initiatives and effects extremely difficult. All attempts to evaluate an initiative or program must be understood within a particular context, which may limit simple adoption of previously successful initiatives. What is effective for one university in one set of circumstances and context may not be so for another. For example, labour market forces in south-eastern Australia may make higher education an attractive destination for individuals of low SES background, but in Western Australia the mining industry may hold the much attraction and reduce the apparent effective of outreach programs in Western Australian schools.
33
Finally, students are not acted on by individual initiatives. Equity initiatives are typically highly interdependent and are nested within the wider policies and programs of the university. A student making the decision to participate in higher education has their decision mediated by the availability of scholarships and other financial support, course ATAR requirements which may be lowered for someone from their school or background, previous experiences with university outreach programs, and so on. These initiatives function together, making it difficult to separate the effects of each one. For these reasons, it is highly difficult to identify, and particularly to quantify, the effect of particular initiatives. Even two initiatives that appear broadly similar (that is, fall under the same section of the following framework) may have very different effects due to differences in administration, support, pedagogy and delivery. While we can identify systemic effects, and identify initiatives that we believe are pedagogically sound, it may be impossible to quote a particular effect size for an initiative. Figure 4.1 presents the broad framework for the typology of equity initiatives presented in the table below.
34
4.1.1.1.1 Figure 4.1: Factors leading to increased completion, particularly for students from low SES backgrounds.
35
Initiative
Purpose
1. Outreach to schools and communities A. Early outreach - Inform aspirations for higher in schools (i.e. education primary and early - Increase Year 10-12 retention secondary) to rates children and - Boost parental involvement and families support - Increase teacher support of student aspirations
B. Later-year outreach in schools (i.e. Year 10 to Year 12) to children and families
- Inform aspirations for higher education - Increase Year 10-12 retention rates - Inform subject choices - Inform students of relevant pathways and possibilities - Boost parental involvement and support - Increase teacher support of student aspirations
Plausibility (theoretical strength of initiative)
Evidence of effectiveness from research and evaluation
Strong theoretical basis for effectiveness, particularly if sustained over several years of schooling and if outreach targets all students, not just gifted ones, and parents.
Limited evidence available, and 9.4 potentially limited evidence achievable. Too many factors affect post-school aspirations and progress to reliably determine their effectiveness. Even if effective, students may not enrol in the institution implementing the initiative, which also confounds the result.
Some theoretical basis. Student aspirations and academic achievement are often determined by pre-Year 10 achievement, which may limit the effectiveness of later initiatives. May be more effective in informing students and families of pathways to higher education, costs etc.
Limited evidence available from 11.5 Australia. UK: (Morris and Golden 2005) – proportion of pupils in Year 11 who intend to participate in higher education is 3.9 percentage points higher in schools with Aimhigher than in similar schools without, and have slightly higher GCSE achievement levels, although this was impossible to trace to specific initiatives rather than systemic changes in the participating schools.
36
Proportion of total HEPPP funding (%)
Initiative
Purpose
C. Pre-entry university experience programs for schools
- Inform aspirations for higher Some theoretical education effectiveness. - Encourages students to see themselves as university students Universities seem less intimidating, more relevant to students’ lives
D. School curriculum enhancement and support
Plausibility (theoretical strength of initiative)
Proportion of total HEPPP funding (%) from 3.9
for Limited evidence available Australia. UK: Morris and Golden (2005) – proportion of pupils in Year 11 who intend to participate in higher education is 3.9 percentage points higher in schools with Aimhigher than in similar schools without, and have slightly higher GCSE achievement levels, although this was impossible to trace to specific initiatives rather than systemic changes in the participating schools. - Increase academic achievement Strong theoretical basis for Some evidence from US: 0.6 - Increase teacher support of effectiveness, particularly if Cunningham et al (2003); student aspirations support begins early in Warburton et al (2001) - Academic schooling, is sustained over rigor of students’ high school several years of schooling and curriculum was strongly associated targets all students, not just with their postsecondary GPA, the gifted ones. amount of remedial coursework they took, and with their rates of persistence and attainment. Early initiatives are more effective Good evidence from Australia and UK. Low SES schools are poorly resourced – Strong evidence from Australia
37
basis
Evidence of effectiveness from research and evaluation
Initiative
Purpose
Plausibility (theoretical strength of initiative)
E. Community outreach for adult education
- Inform aspirations for higher education - Inform students of relevant pathways and possibilities
Some theoretical basis. Student aspirations and academic achievement are often determined by pre-Year 10 achievement, which may limit the effectiveness of later initiatives. Combining this kind of outreach with e.g. VET pathway programs, alternate selection criteria for mature aged students etc may be particularly effective
2. Recruitment, selection and admissions A. Pathway - Increase access for programs, educationally disadvantaged articulation students programs, - Increase aspirations to attend guaranteed university pathways
B. Bridging programs, foundation programs, “Year 13”
- Increase academic achievement
Strong theoretical basis for effectiveness.
Strong theoretical basis for effectiveness. Academic preparedness/ achievement correlates strongly with retention rates.
38
Evidence of effectiveness from research and evaluation
Proportion of total HEPPP funding (%) Very limited evidence from the US and 1.2 Australia.
Strong evidence for the potential efficacy of these programs, but weaker evidence for their current utility. E.g. Foley (2007), Wheelahan (2009) VET programs currently not acting to increase participation rates for low SES students, except in dual sector universities. Some evidence from the US.
2.4
5.8
Initiative
Purpose
Plausibility (theoretical strength of initiative)
Evidence of effectiveness from research and evaluation
C. Alternate selection criteria and tools
- Increase access for educationally disadvantaged students
Strong evidence from Australia and US.
D. Scholarships
- Increase access for disadvantaged students - Increase aspirations to attend university
E. Marketing
- Increase aspirations to attend higher education
Strong theoretical basis for effectiveness. ATAR has a strong relationship with SES background, which disadvantages otherwise intellectually able students. Alternate selection criteria (e.g. interviews, portfolios) recognises non-academic experience and skills. Strong theoretical basis for effectiveness. Perceived cost of higher education is a major deterrent for low SES students, particularly regional and remote students. Some theoretical basis for effectiveness.
39
Proportion of total HEPPP funding (%) 1.9
Strong evidence from Australia, UK and US.
11.2
Some evidence (based on student perceptions of effectiveness) from around the world.
0.3
Initiative
3. Transition A. First year orientation and transition support programs
Purpose
- Reduce culture shock and increase retention - Familiarise students with the university and available support services - Inform students of academic expectations and success strategies - Increase social engagement with peers - Increase overall engagement with university 4. Retention, progress and success A. Consideration of - Increase academic achievement student and access to educational disadvantage in support by embedding course structure educational support within and curriculum curricula design - Inform students of academic expectations and success strategies - Reduce burden of attending university by reducing travel time/costs and increasing available time for part-time work
Plausibility (theoretical strength of initiative)
Evidence of effectiveness from research and evaluation
Proportion of total HEPPP funding (%)
Strong theoretical basis for effectiveness, particularly if sustained over the first semester or first year.
Strong evidence from the US, although these may be confounded by highly motivated students volunteering for orientation programs.
7.1
Strong theoretical basis for effectiveness.
Pitkethly and Prosser (2001), (Clerehan 2003), Devlin and O’Shea (2011)
4.7
40
Initiative
Purpose
B. Extra-curricular learning and support programs
- Increase academic achievement - Increase social engagement with peers through mentoring - Provide individual academic skills development through specialised academic skills staff
C. Student services provision
- Reduce financial and personal burden of attending university - Increase social engagement with peers
Plausibility (theoretical strength of initiative)
Evidence of effectiveness from research and evaluation
Proportion of total HEPPP funding (%) Some theoretical basis for James et al. (2010), Clegg et al. (2006), 9.0 effectiveness. Extra-curricular Henderson et al. (2009) nature may reduce the number of Low SES students make limited use of time-poor students making use student support services – Benson et al of facilities. More likely to be (2009), Clegg et al (2006) effective when used in conjunction with embedded learning support through referrals and early assessment. Some theoretical basis for Tones et al (2009), Zepke and Leach 12.1 effectiveness. Some student (2010); strong evidence from Australia services (e.g. financial aid and and worldwide about the importance of childcare) may be essential for childcare and financial aid some students (making this Low SES students make limited use of High). Low SES students are student support services – Benson et al less likely to make use of (2009), Clegg et al (2006) student services than other students.
* 18.9% of total HEPPP funding is spent on staff costs, evaluation, research and other costs that are associated with the management of equity programs, rather than the initiatives themselves.
41
5 Distribution of Higher Education Participation and Partnerships Programs (HEPPP) against the CIF Key points: * The patterns of equity initiatives supported by HEPPP funding are consistent with the structure of the CIF (noting that the information including in the HEPPP reports was obviously not designed for the purposes of the present study and thus has limitations). * 49.3% of the total HEPPP funding is spent on pre-entry initiatives; 34.5% on postentry initiatives and 16.2% on costs associated with the management of equity programs. * Broadly speaking, if program management costs are removed, approximately onethird of the HEPPP funding has been spent on initiatives in outreach to school and communities; another third on recruitment, selection and admissions and transition programs; and another third on retention, progress and support. * The highest proportion of HEPPP funding was spent on the provision of student services, scholarships and later-year outreach to schools. These initiatives also had the largest number of institutions operating programs of these types. * The lowest proportion of HEPPP funding was spent on marketing, school curriculum enhancement (an initiative with high plausibility and some evidence of effectiveness), and outreach for adult education.
An initial broadbrush analysis of the institutional expenditure of HEPPP funding to support equity initiatives, based on the 38 institutional reports, indicates that approximately half of total HEPPP funding is spent on pre-entry initiatives: that is, those that operate prior to individuals entering higher education. Approximately a third is spent on post-entry initiatives, while the remainder is typically spent on management costs associated with the equity programs. In general, the majority of this funding was used to support programs with a reasonably high degree of theoretical effectiveness. However, initiatives of some types that are potentially effective currently have less institutional activity than their potential might indicate. In 2011, across the Table A higher education providers, 49.3 per cent of the total HEPPP funding was spent on pre-entry initiatives; 34.5 per cent of the total was spent on post-entry initiatives, and the remaining 16.2 per cent spent on costs associated with the management of equity programs (such as administration costs, costs associated with staff that could not otherwise by classified under one of the other categories, and research and evaluation of programs) (Table 6.1). This analysis includes only the expenditure from HEPPP-funded projects, and only contributions made from the HEPPP scheme, rather than contributed by the institutions or other partners. Equity programs that are funded by institutions without the use of HEPPP funding were not included in the analysis. Furthermore, as previously noted, there is significant overlap between several categories; outreach programs, for example, frequently target both early- and later-year secondary students, potentially
confounding the figures we have derived. As such, the figures should be considered indicative, rather than comprehensive. Both HEPPP A and HEPPP B funding is included. Across the sector, the highest proportion of HEPPP funding used to fund initiatives was spent on the provision of student services, scholarships, and later-year outreach to schools, with significant contributions also being made to early outreach to schools and extra-curricular learning support. Consistent with this, these initiatives also had the largest number of institutions operating programs of that type. These initiative types are also the highest funded per institution with programs of that type; many institutions are making large investments in these initiatives, both in terms of their individual HEPPP allocations, and in terms of overall HEPPP funding for the sector as a whole. 5.1.1.1.1
Table 6.1: Amount of HEPPP funding spent by Table A higher education providers in 2011 by initiative type (as a proportion of the total expenditure, and as a proportion of the total less program management expenditure programs. Also shown is the number of institutions operating one or more programs of each type)
Initiative category
1: Outreach to schools and communities 1A (Early outreach) 1B (Later-year outreach) 1C (Pre-entry university experience programs) 1D (School curriculum enhancement/ support) 1E (Community outreach for adult education) 2: Recruitment, selection and admissions 2A (Pathway programs) 2B (Bridging programs) 2C (Alternate selection criteria) 2D (Scholarships) 2E (Marketing) 3: Transition 3A (Orientation and transition support) 4: Retention, progress and support 4A (Curriculum design) 4B (Extra-curricular learning support) 4C (Student services provision) 5: Other spending (e..g program management )
Proportion of total HEPPP spending (%) Less program management expenditure (%) 26.9 32.2
Number of institutions with programs of that type
9.4 11.6 4.0
11.2 13.9 4.8
27 31 17
0.6
0.7
9
1.3
1.6
12
22.4
26.7
38
2.6 5.9 2.0
3.1 7.1 2.4
16 19 10
11.6 0.3 8.0 8.0
13.8 0.3 9.5 9.5
24 5 23 23
26.5
31.6
35
4.4 9.4
5.2 11.2
18 26
12.7
15.2
30
16.2
0
28
43
37
The initiatives that show the least HEPPP expenditure (as well as the lowest number of institutions with initiatives of this type) are marketing, school curriculum enhancement, outreach for adult education, alternate selection criteria, and pathway programs. It is understandable that some of these initiatives might not attract or require a large amount of HEPPP funding; instituting alternate selection criteria, for example, may require little funding, and many universities will cover any costs associated with this from alternative funding, rather than from HEPPP. However, the strong theoretical basis for effectiveness of programs that enhance or develop school curricula may indicate that there is an opportunity to fund programs that more fully exploit this type of initiative. The analysis of HEPPP reports reinforces the case for consistent and detailed evaluation of equity programs and their effectiveness and efforts to build strong causal associations between equity initiatives and improved access, participation, retention, success, attainment and employment. It is recognized that some initiatives particularly outreach programs and more so early outreach programs, may be highly difficult on which to collect data for sound program evaluation. However, as a sector, equity researchers and practitioners should be encouraged and supported in raising the sector’s dialogue around the establishment of common approaches for evaluating programs in a rigorous and sophisticated manner, as in Harvill et al (2012) and Bailey and Alfonso (2005).
44
6 Bibliography Aird, R., E. Miller, et al., 2010. Issues for students navigating alternative pathways to higher education: Barriers, access and equity. Literature Review Prepared for the Adult Learner Social Inclusion Project. Brisbane: Queensland University of Technology. Allen, L., L. Solomon, et al. 2005. International comparators of widening participation in higher education: policy and practice. Higher Education in the USA: Student fees, financial aid and access. M. Stuart. UK, Action Access. Alloway, N., P. Gilbert, et al. 2004. Factors impacting on student aspirations and expectations in regional Australia. Canberra, Department of Education, Science and Training. Archer, L. and M. Hutchings, 2000. 'Bettering yourself'? Discourses of risk, cost and benefit in ethnically diverse, young working-class non-participants' constructions of higher education. British Journal of Sociology of Education 21: 555-574. Bailey, T. and M. Alfonso, 2005. Paths to persistence. An analysis of research on program effectiveness at community colleges. Bean, J. and S. B. Eaton, 2001. The psychology underlying successful retention practices. Journal of college student retention 3: 73-89. Behrendt, L., S. Larkin, et al. 2012. Review of higher education access and outcomes for Aboriginal and Torres Strait Islander people: Final report. Canberra, DIISRTE. Benson, R., L. Hewitt, et al. 2009. Experiences of students from diverse backgrounds: The role of academic support. Proceedings of the 32nd HERDSA Annual Conference. Biggs, J. and C. Tang. 2011. Teaching for quality learning at university: Open university press. Bok, J., 2010. The capacity to aspire to higher education:‘It's like making them do a play without a script’. Critical Studies in Education 51: 163-178. Bowden, M. P. and J. Doughney, 2010. Socio-economic status, cultural diversity and the aspirations of secondary students in the Western Suburbs of Melbourne, Australia. Higher Education 59: 115-129. Bradley, D., P. Noonan, et al. 2008. Review of Australian higher education: Final report. Canberra, Department of Education, Employment and Workplace Relations. Cardak, B. A. and C. Ryan, 2009. Participation in Higher Education in Australia: Equity and Access*. Economic Record 85: 433-448. Carson, T., 2010. Overcoming student hardship at Swinburne University, Australia: an insight into the impact of equity scholarships on financially disadvantaged university students. Widening Participation and Lifelong Learning 12: 36-59. Chen, R. and S. L. DesJardins, 2008. Exploring the effects of financial aid on the gap in student dropout risks by income level. Research in Higher Education 49: 118. Clegg, S., S. Bradley, et al., 2006. ‘I've had to swallow my pride’: help seeking and self‐esteem. Higher Education Research & Development 25: 101-113. Clerehan, R., 2003. Transition to Tertiary Education in the Arts and Humanities Some Academic Initiatives from Australia. Arts and Humanities in Higher Education 2: 72-89. 45
Commonwealth of Australia. 2009. Transforming Australia's higher education system. Canberra, Commonwealth of Australia. Coram, S., 2007. 'One for All'-Reconceptualising Disadvantage as Hierarchical in Social, Vocational Education and Training Related Policy. Just Policy: A Journal of Australian Social Policy: 5. Craven, R., A. Tucker, et al. 2005. Indigenous students' aspirations: Dreams, perceptions and realities: Department of Education, Science and Training Canberra, Australia. Creswell, J. and C. Underwood, 2004. Location, Location, Location: Implications of Geographic Situation on Australian Student Performance in PISA 2000. ACER Research Monograph Number 58. Australian Council for Educational Research. Cunningham, A. F., C. Redmond, et al. 2003. Investing early: Intervention programs in selected US states: Canada Mellennium Scholarship Foundation. Dawkins, J. 1990. A fair chance for all: Higher education that’s within everyone’s reach, Canberra: Department of Employment, Education and Training. Dennis, J. M., J. S. Phinney, et al., 2005. The role of motivation, parental support, and peer support in the academic success of ethnic minority first-generation college students. Journal of College Student Development 46: 223-236. Department of Education Employment and Workplace Relations (DEEWR). 2008. National report to parliament on Indigenous education and training. Canberra. Devlin, M. and H. O'Shea, 2011. Directions for Australian higher education institutional policy and practice in supporting students from low socioeconomic backgrounds. Journal of Higher Education Policy and Management 33: 529-535. Edwards, D. and H. Coates, 2011. Monitoring the pathways and outcomes of people from disadvantaged backgrounds and graduate groups. Higher Education Research & Development 30: 151-163. Foley, P. 2007. The Socio-Economic Status of Vocational Education and Training Students in Australia: ERIC. Friedlander, L. J., G. J. Reid, et al., 2007. Social support, self-esteem, and stress as predictors of adjustment to university among first-year undergraduates. Journal of College Student Development 48: 259-274. Gale, T. 2012. Towards a southern theory of higher education. Preparing for tomorrow today: the first year experience as foundation: First Year in Higher Education Conference 2009, 29 June-1 July 2009, Townsville, Queensland: conference proceedings., Queensland University of Technology. Gale, T., S. Sellar, et al. 2010. Interventions early in school as a means to improve higher education outcomes for disadvantaged (particularly low SES) students: A design and evaluation matrix for university outreach in schools: The Department. Godden, N. 2007. Regional young people and youth allowance: Access to tertiary education: Centre for Rural Social Research. Hansen, M. J., S. E. Evenbeck, et al. 2008. The influence of a summer bridge program on college adjustment and success: the impotance of early intervention and creating a sense of community. AIR Forum, Seattle. Harvill, E. L., R. A. Maynard, et al., 2012. Effects of College Access Programs on College Readiness and Enrollment: A Meta-Analysis. Society for Research on Educational Effectiveness.
46
Heller, D., 1999. Racial equity in college participation: African American students in the United States. Review of African American Education 1: 5-29. Heller, D. E., 1997. Student price response in higher education: An update to Leslie and Brinkman. Journal of Higher Education: 624-659. Heller, D. E. and C. J. Rasmussen, 2002. Merit scholarships and college access: Evidence from Florida and Michigan. Who should we help: 25-40. Henderson, R., K. Noble, et al., 2009. Transitioning into university:'interrupted'first year students problem-solving their way into study. Studies in Learning, Evaluation, Innovation and Development 6: 51-65. Hillman, K., 2005. The first year experience: The transition from secondary school to university and TAFE in Australia. LSAY Research Reports: 44. Hu, S., 2010. Scholarship awards, college choice, and student engagement in college activities: A study of high-achieving low-income students of color. Journal of College Student Development 51: 150-161. Hunter, M. S., 2006. Fostering student learning and success through first-year programs. Peer Review 8. Jackson, G. A. and G. B. Weathersby, 1975. Individual demand for higher education: A review and analysis of recent empirical studies. The Journal of Higher Education: 623-652. James, R. 2002. Socioeconomic background and higher education participation: An analysis of school students' aspirations and expectations: Department of Education, Science and Training Canberra. James, R. 2007. Social equity in a mass, globalised higher education environment: the unresolved issue of widening access to university: University of Melbourne, Centre for the Study of Higher Education. James, R. 2008. The first year experience in a new higher education landscape: What are the factors influencing the quality of the student experience? What are the priority areas for change and innovation. Keynote address at First Year in Higher Education Conference. Hobart. Retrieved March. James, R., G. Baldwin, et al., 2004. Analysis of equity groups in higher education. Canberra, Commonwealth of Australia. James, R., E. Bexley, et al. 2008. Participation and equity: A review of the participation in higher education of people from low socioeconomic backgrounds and Indigenous people, University of Melbourne. Centre for the Study of Higher Education. James, R. and M. Devlin. 2006. Improving Indigenous Outcomes and Enhancing Indigenous Culture and Knowledge in Australian Higher Education, IHEAC report, Commonwealth of Australia. James, R., K.-L. Krause, et al., 2010. The first year experience in Australian universities: Findings from 1994 to 2009. James, R., J. Wyn, et al. 1999. Rural and Isolated School Students and Their Higher Education Choices: A Re-Examination of Student Location, Socioeconomic Background, and Educational Advantage and Disadvantage. Commissioned Report: ERIC. Khoo, S. T. and J. Ainley, 2005. Attitudes, intentions and participation. Kilpatrick, S. and J. Abbott-Chapman, 2002. Rural young people’s work/study priorities and aspirations: The influence of family social capital. The Australian Educational Researcher 29: 43-67. Lamb, S., P. Dwyer, et al., 2000. Non-completion of school in Australia: The changing patterns of participation and outcomes. LSAY Research Reports: 65.
47
Lamb, S., R. W. Rumberger, et al., 2004. School performance in Australia: Results from analyses of school effectiveness (Report for the Victorian Department of Premier and Cabinet). Melbourne, Centre for Post-compulsory Education and Lifelong Learning, University of Melbourne. Le, A. T. and P. W. Miller, 2005. Participation in Higher Education: Equity and Access?*. Economic Record 81: 152-165. Lefoe, G., C. Gunn, et al., 2002. Recommendations for teaching in a distributed learning environment: The students' perspective. Australian Journal of Educational Technology 18: 40-56. Leslie, L. L. and P. T. Brinkman. 1988. The Economic Value of Higher Education. American Council on Education/Macmillan Series on Higher Education: ERIC. Marks, G., 2007. Completing university: characteristics and outcomes of completing and non completing students. Marks, G. and N. Fleming, 1999. Early school leaving in Australia: findings from the 1995 year 9 LSAY cohort. McInnis, C., R. James, et al. 2000. Trends in the first year experience: In Australian universities: Department of Education, Training and Youth Affairs Canberra. McInnis, C., R. H. James, et al. 1995. First year on campus: Diversity in the initial experiences of Australian undergraduates: AGPS [for] Centre for the Study of Higher Education, University of Melbourne. Miller, M. T. and M. L. Pope, 2003. Integrating technology into new student orientation programs at community colleges. Community College Journal of Research &Practice 27: 15-23. Morris, M. and S. Golden. 2005. Evaluation of Aimhigher: Excellence Challenge: Interim Report, 2005: DfES Publications. National Centre for Vocational Education Research (NCVER). Australian vocational education and training statistics: Indigenous students 2010. Retrieved 12 April, 2013. http://www.voced.edu.au/content/ngv47261. O'Shea, H., A. Onsman, et al. 2011. Students from low socioeconomic status backgrounds in higher education: An annotated bibliography 2000-2011. Organisation for Economic Co-operation and Development (OECD). 2008. Education at a glance 2008: OECD Indicators. Paris. Pascarella, E. and P. Terenzini. 2005. How college affects students: Findings and insights from twenty years of research. Volume 2. A third decade of research, San Francisco: Jossey-Bass. Payne, A. and R. Percival. 2008. What price the clever country? - The costs of tertiary education in Australia. AMP.NATSEM Income and Wealth Report, AMP.NATSEM. 21. Pitkethly, A. and M. Prosser, 2001. The first year experience project: A model for university-wide change. Higher Education Research and Development 20: 185-198. Ramsden, P. 2003. Learning to teach in higher education. London and New York: RoutledgeFalmer. Rubin, R. S., 2006. The academic journal review process as a framework for student developmental peer feedback. Journal of Management Education 30: 378-398. Sellar, S., T. Gale, et al., 2011. Appreciating aspirations in Australian higher education. Cambridge journal of education 41: 37-52.
48
Skene, J. and S. Evamy, 2009. Does access equal success? The critical role of the First Year Experience (FYE) in achieving equity in higher education. First Year in Higher Education. Townsville, Queensland. Stanwick, J. 2006. Outcomes from Higher-Level Vocational Education and Training Qualifications: ERIC. Steering Committee for the Review of Government Service Provision (SCRGSP). 2011. Overcoming Indigenous disadvantage: key indicators 2011: report. Melbourne. Teese, R., S. Lamb, et al., 2007. Structural inequality in Australian education: vertical and lateral stratification of opportunity. International studies in educational inequality, theory and policy 2: 39-61. Thomson, S. and L. De Bortoli, 2008. Exploring Scientific Literacy: How Australia measures up. The PISA 2006 survey of students' scientific, reading and mathematical literacy skills. Tones, M., J. Fraser, et al., 2009. Supporting mature-aged students from a low socioeconomic background. Higher Education 58: 505-529. Twale, D. J., 1989. Social and Academic Development in Freshman Orientation: A Time Frame. NASPA Journal 27: 160-167. Warburton, E., R. Bugarin, et al., 2001. Bridging the Gap: Academic Preparation and Postsecondary Success of First-Generation Students (NCES 2001–153). US Department of Education. National Center for Education Statistics. Washington, DC: US Government Printing Office. Welch, A., S. Helme, et al., 2007. 14 Rurality and Inequality in Education The Australian Experience. International studies in educational inequality, theory and policy: 271. Wheelahan, L., 2009. What kind of access does VET provide to higher education for low SES students? Not a lot. Student equity in higher education: What we know. What we need to know, National Centre for Student Equity in Higher Education 25. Willems, J., 2010. The Equity Raw‐Score Matrix–a multi‐dimensional indicator of potential disadvantage in higher education. Higher Education Research & Development 29: 603-621. Zepke, N. and L. Leach, 2010. Beyond hard outcomes:‘soft’outcomes and engagement as student success. Teaching in Higher Education 15: 661-673.
49