How to cite this article: Chen M, Yang C, Hou T, Lü G, Wen Y, Yue S. 2018. Developing a data model for understanding geographical analysis models with consideration of their evolution and application processes. Transactions in GIS, Doi: https://doi.org/10.1111/tgis.12484
Developing a data model for understanding geographical analysis models with consideration of their evolution and application processes Min Chen1,2,3
| Chen Yang1,2,3 | Tao Hou1,2,3 |
Guonian Lü1,2,3 | Yongning Wen1,2,3 | Songshan Yue1,2,3 1
Key Laboratory of Virtual Geographic Environment, Ministry of Education of PRC, Nanjing Normal University, Nanjing, China 2
Abstract Geographical analysis models are widely employed to mirror
State Key Laboratory Cultivation Base of Geographical Environment Evolution, Nanjing, China
real phenomena and processes on Earth. The current geo‐
3
Jiangsu Center for Collaborative Innovation in Geographical Information Resource Development and Application, Nanjing, China
sion support‐oriented information in various domains
Correspondence Min Chen, Key Laboratory of Virtual Geographic Environment, Ministry of Education of PRC, Nanjing Normal University, Nanjing, Jiangsu, China. Email:
[email protected] Chen Yang, Key Laboratory of Virtual Geographic Environment, Ministry of Education of PRC, Nanjing Normal University, Nanjing, Jiangsu, China. Email:
[email protected]
opment and related research, and the relationships between
Funding information NSF for Excellent Young Scholars of China, Grant/Award No. 41622108; National Basic Research Program of China (973 Program), Grant/Award No. 2015CB954103; Priority Academic Program Development of Jiangsu Higher Education Institutions, Grant/Award No. 164320H116
graphical analysis models can provide prediction and deci‐ through analysis and simulation results. However, the com‐ plexity of models is increasing due to their continuous devel‐ models are becoming increasingly complicated, which se‐ verely hinders the ability to select and use suitable models. To bridge the requirements of model understanding with related abundant information, a data model for geographical analysis models is designed with consideration of their evo‐ lution and application processes. In addition to basic meta‐ data (e.g., name, classification, and modeling approach), evolution and application information, which is often ne‐ glected in traditional model expression methods, can pro‐ vide clues about model development histories and usage relationships. Thus, this information will provide scientists with a comprehensive understanding and will form an over‐ all picture of geographic models that can be used for future research. Based on the analysis of the elements related to the evolution and application information, the data model is
2
|
CHEN et al.
designed and an information abstraction strategy is pro‐ posed. The Soil and Water Assessment Tool (SWAT) is em‐ ployed as a case study to show the capacity of the designed data model to contribute to both sharing of geographical analysis model knowledge and further model analysis.
1 | I NTRO D U C TI O N The Earth where humans survive mainly consists of the atmosphere, hydrosphere, lithosphere, biosphere, and human society. The Earth is a complex system in which the natural and social elements continuously evolve and interact with each other. Geography is a field of science devoted to the study of the features, inhabitants, and phenomena of the Earth (Anderson, Fortson, Kleinedler, & Schonthal, 2006), and its fundamental aims include a better understanding of the world and the prediction of future conditions using means such as field work, simu‐ lation, and visualization (Clifford, Cope, Gillespie, & French, 2016). Geographic modeling is an important strategy used to solve geographic problems (Demeritt & Wainwright, 2005). Geographical analysis models are the result of geographic modeling and are used for geographical analysis (Lu, 2011; Wen et al., 2016; Yue, Chen, Wen, & Lu, 2016). They are abstractions of geographic phenomena in the real world, and they have also been regarded as a representation of theoretical and practical geographic knowledge in an easy‐to‐use way (Lin & Chen, 2015; Perry, 2009; Lin et al., 2015; You & Lin, 2016). Currently, an increasing number of researchers have joined the growing geographical modeling group that focuses on geographical analysis and exploration, and a large number of models have accumulated in various study areas, including climatology, hydrology, oceanography, and environmental change (Chorley & Haggett, 2013). Moreover, different models with specific characteristics (e.g., spatiotemporal correlativity, domain rele‐ vance) have been proposed, such as spatial analysis models (Curtis‐Ham & Walton, 2017; Fischer & Getis, 2011; Maguire, Batty, & Goodchild, 2005; Seenath, 2015; Walker, McKenzie, Liddell, & Morris, 2015), spatiotemporal statistical models (Beurs & Henebry, 2010; Cressie & Majure, 1997; Huang, Wu, & Barry, 2010), process and dy‐ namical models (Derome et al., 2001; Doetterl et al., 2016; Hülse, Arndt, Wilson, Munhoven, & Ridgwell, 2017; Huret, Petitgas, & Woillez, 2010; Noone & Sturm, 2010), and cellular automata (CA)/agent‐based models (Filatova, Verburg, Parker, & Stannard, 2013; Lauf, Haase, Hostert, Lakes, & Kleinschmit, 2012; Torrens, 2015, 2017 ). It can be seen that researchers all over the world have applied and developed models against specific areas, scales, and disciplines. Due to the large number of geographical analysis models, sharing and reusing models is a hot topic under discussion, from component to service‐based architectures (e.g., Chen, Lu, Wen, Tao, & Fei, 2009; Chen et al., 2014; El‐Gayar & Tandekar, 2007; Fook, Monteiro, Casanova, & Amaral, 2009; Wen, Chen, Lu, & Lin, 2013; Yue et al., 2016, 2015 ). It is obvious that geographical analysis has benefited from model sharing and reuse. First, there is no longer a need for researchers who just want to solve geographic problems to develop new models if capable models are shared and can be accessed. These researchers need only to find suitable models and focus on their scientific problems and experiments, which will avoid the waste of both manpower and material resources (Zhang, Chen, Li, Fang, & Lin, 2016). Second, model integration is necessary to deal with complicated problems (e.g., Argent, 2004; Voinov & Cerco, 2010; Granell, Schade, & Ostländer, 2013; Laniak et al., 2013; Voinov & Shugart, 2013). In fact, due to the high complexity of reality, no single geographical analysis model can adequately represent every aspect of a geographical process or phenomenon. Integrated models can reuse existing models for comprehen‐ sive research, especially with the development of web technologies, and model integration in remote networks has become a tendency (Yue et al., 2016; Belete, Voinov, & Laniak, 2017). This ability will eliminate the gaps that exist in communications that result from different locations (e.g., countries and departments), domains, and the
CHEN et al.
| 3
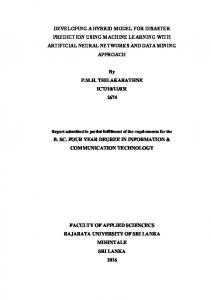
heterogeneity of the models (e.g., modeling principles, coding languages, and execution environments). In this case, the relationships among geographical analysis models will become more sophisticated due to integrated usage. However, when sharing or integrating models, the first and most crucial task is to find and understand the models that are suitable for access and use. With increasing complexity of models, it is very difficult to choose a model for a specific use out of the vast number of available models if the user is not very familiar with the target model. In traditional research, the metadata of geographical analysis models were designed to introduce and classify models (e.g., Conlan, Wade, Bruen, & Gargan, 2002; Crosier, Goodchild, Hill, & Smith, 2003; David et al., 2013). Although traditional metadata can be employed and have laid a solid foundation for model awareness, some limitations still need to be considered. First, previous metadata focused mainly on the description of static model attributes (e.g., name, scale, and data requirement) and paid less attention to the dynamic evolution information of the models. Evolution is a typical characteristic of both people and objects, and it is important for story reviewing (e.g., Chen, Lin, Lu, He, & Wen, 2011; Folkesson et al., 2012; Freedman, 1974). For a single model, it may undergo a continuous evolu‐ tion process, and this information is also important for model understanding. For example, the Soil and Water Assessment Tool (SWAT) is a river basin scale model developed to quantify the impacts of land management practices in large, complex watersheds (https://en.wikipedia.org/wiki/SWAT_model). During its evolution period, it experienced several versions (see Figure 1). In addition, it is also characterized by its “family” and extensions: ArcSWAT (an ArcGIS‐ArcView extension and graphical user input interface for SWAT), QSWAT (the QGIS in‐ terface for SWAT), and MWSWAT (a free, open source MapWindow interface to SWAT). For different models, they may be integrated for advanced simulation. For example, SWAT‐MODFLOW was developed by coupling the previously developed SWAT with MODFLOW, which is a U.S. Geological Survey modular finite‐difference flow model (https://en.wikipedia.org/wiki/MODFLOW), to form an integrated hydrological model. Such dynamic evolution information will enable users to not only make the distinction but also trace the relationships among different versions or models, which will provide a more comprehensive understanding and an overall picture of geographical analysis models. Second, metadata are often designed with the focus of describing the models themselves, but external infor‐ mation is seldom utilized in model introductions. For example, the Storm Water Management Model (SWMM) is a distributed, dynamic rainfall‐runoff simulation model first developed in 1971 (Metcalf & Eddy, Inc., 1971). The first SWMM version focused on modeling combined sewer overflows (CSO) and it later underwent five major upgrades (see Table 1). During these processes, different contributions and departments were involved, and this contributor information can be used to track the story on the development change of SWMM. Moreover, although applicable areas and scales have been noted in some metadata systems, more application‐related information is often ignored. In fact, most models will be used in different application scenes by different users. When a user
F I G U R E 1 Versions of SWAT
4
|
CHEN et al.
TA B L E 1 Evolution of SWMM Version
Year
Contributors
Comments
SWMM I
1971
Metcalf & Eddy, Inc. water resources engineers; University of Florida
First version of SWMM; focus was on CSO modeling, few of its methods are still used today
SWMM II
1975
University of Florida
First widely distributed version of SWMM
SWMM 3
1981
University of Florida; Camp, Dresser, & McKee
Full dynamic wave flow routine, Green– Ampt infiltration, snow melt, and continuous simulation added
SWMM 3.3
1983
US EPA
First PC version of SWMM
SWMM 4
1988
Oregon State University; Camp, Dresser, & McKee
Groundwater, RDII, irregular channel cross‐sections and other refinements added over a series of updates throughout the 1990s
SWMM 5
2005
US EPA; CDM‐Smith
Complete rewrite of the SWMM engine in C; graphical user interface added; improved algorithms and new features (e.g., LID modeling) added
attempts to find a suitable model to simulate a certain phenomenon in a specific area, they need to be aware of which models in the field were created by professional experts, are most used, or have the highest capacity to simulate the phenomenon in the target area. All of this application‐related information is valuable for the practical use, selection, and implementation of models. In summary, geographical analysis models are often more complex than traditional metadata can describe. To improve the current methods, this article proposes a data model with consideration of two important aspects of models—evolution and application—to support comprehensive expression of models. This data model can be used to describe and track the entire history of geographical analysis models and their usage relationships. It will pro‐ vide a rich and comprehensive background for researchers and provide them a better understanding of models. The remainder of this article is organized as follows. Section 2 provides the conceptual model of the proposed data model, while Section 3 introduces the corresponding logical representation of the proposed data model. In Section 4, the information extraction methods are designed for collecting supporting data for usage of the data model. Section 5 uses the SWAT as a case study to test the description capacity of the proposed data model. Section 6 presents conclusions and identifies future work related to this research.
2 | TH E CO N C E P T UA L M O D E L O F TH E DATA M O D E L U S E D FO R G EO G R A PH I C A L A N A LYS I S M O D E L S Generally, models are the abstracts of theories, laws, hypotheses, or structural thinking, and they can be repre‐ sented using mathematical formulas, computer programs, or even conceptual figures (Voinov, Coltekin, Chen, & Beydoun, 2018). From the perspective of geography, geographical analysis models conduct inference and argu‐ mentation of the geographic reality in the aspect of spatiotemporal relations (Skilling, 1964). The surviving period of a geographical analysis model starts when it is created and usually lasts for a long period. During this procedure, many relevant activities, such as upgrading, changing attributes, application, and integration, occur at different times and in different places. In this article, the surviving periods of geographical analysis models are separated into internal‐related evolution and external‐related application.
CHEN et al.
| 5
The existence of model evolution means internal changes of models. In addition, these changes will bring about positive (but a few may be negative) effects to models, such as increases in accuracy or efficiency. These changes can include the corrections of calculation formulas, model version updates, and software framework upgrades, and so on. The driving factors of model evolution may include the improvement of fundamental theory or an increase in the requirements for actual problem solving. Different from evolution, model application will not directly change the model itself. Model application simply refers to the actual utilization of a model to simu‐ late tasks and experimental methods. Although model evolution and application cover two separate aspects of models, they are still related to each other. Model application is the process of model utilization and creates the purpose requiring the evolution of models. There are also some common elements related to both aspects that will be employed to complete the description. First, time is necessary for both the evolution and the application of models. Related information can be col‐ lected to answer questions such as: when was the model modified?; when was the model used?; and what was the experimental period for a certain simulation? Second, location is also a non‐negligible element. The location can be an address (e.g., 550 North Park Street, Madison, WI, USA) or a regional area [e.g., Pearl River Delta (PRD), China]. Information on this aspect can be used to answer questions such as: where was the model updated? and what was the study area for the simulation? Normally, even with the same model, the study area can be different with different users and times. Finally, characters (e.g., researchers, institutes, and departments) can form a network of models to help future users with both optimization selection and comprehensive understanding. The same character can play different roles in distinct model cases, and they can create, modify, and even use these models. For example, the Princeton Ocean Model (POM) is a numerical model for ocean circulation that was developed by Blumberg and Mellor (1987), who are developers. Afterwards, the developers served as modifiers and participated in a POM study (Blumberg, 1996; Mellor, Häkkinen, Ezer, & Patchen, 2002). Later, the developers also acted as users and applied the POM to a rainstorm simulation (Blumberg, Georgas, Yin, Herrington, & Orton, 2015; Ezer & Mellor, 2000). In some cases, a single or several researchers cannot afford to conduct studies on complex models, thus agencies (e.g., institutes or departments) may be used as model characters. For example, the FDS (fire dynamics simulator) was developed by the National Institute of Standards and Technology and the VTT Technical Research Center of Finland (McGrattan, McDermott, Weinschenk, & Forney, 2013). Moreover, as time goes by, the same character may change position or employer, and the departments or institutions who developed a model may also change their names and locations. This information may broaden the network of models and contribute to further studies on model‐centered social network analysis.
2.1 | Conceptual model to describe geographical analysis model evolution With increasing quantities and types of geographical analysis models, researchers have to spend more time gathering the required information and selecting appropriate models. Current model metadata formats focus on attribute description and ignore the related development processes and changes to the models. Models at different stages may be equipped with different features, and it is meaningful for users to track the evolution processes of these models to make better choices. The evolution processes can be described using different events, such as name changes, version changes, algorithm modifications, and integration with other models. Moreover, the metadata may record the creator of the model but may not record other related characters, such as users who modified the model during its evolution. Sometimes, this information is also important for users to track the changes in the models. For example, people may select a version that was modified by a
F I G U R E 2 Conceptual model of the evolution process of geographical analysis models
6
| CHEN et al.
CHEN et al.
| 7
professional expert over other modified versions. Additionally, this information can be used to link models through the characters. Based on this, combined with the evolution of the characters discussed above, the conceptual model to describe the evolution process of geographical analysis models can be designed as in Figure 2. In this conceptual model, events play an important role in the records of both model evolution and the re‐ lated character‐change processes. Moreover, the combination of characters with model evolution will conquer the problems of traditional model metadata on lacking character descriptions.
2.2 | Conceptual model to describe geographical analysis model application Geographical analysis models are developed to deal with specific research issues in a particular domain. However, by using different characters or different cases, the applicability of a model may be extended. The description of a single application case often cannot provide a comprehensive understanding of the applicability of a certain model. If different application cases can be collected and organized over time, this information will provide users with more ideas about the better usage of a model, and can help determine the targets (e.g., the most commonly used models in specific research areas, or the research study areas suitable for a specific model). To describe this information, the application scene is proposed to indicate the actual scenario of model application, including descriptions of the study date, study region, problem, domain (e.g., urban waterlogging, soil erosion), and other information. Additionally, to link a model with its related application scenes, the type of event, called the model application event, is also important. The model application event can be employed to describe the time (when), location (where), characters (who), as well as other details related to a specific application. In this case, different application scenes related to a model can be tracked, as shown in Figure 3.
2.3 | Integrated conceptual model to describe geographical analysis models Normally, a model is used in multiple application scenes, and an application scene may be simulated using different models. It is meaningful to integrate models, application scenes, and characters into one data model for compre‐ hensive understanding. If these components are linked, all related information can be grouped by a specific di‐ mension (e.g., model, application scene, or character) and then sorted by time and location. Thus, the relationships between models, scenes, and different characters can be built. In this way, both user queries and further network analysis can be conducted easily. For example, users can not only obtain a clear image of the application of a model during its evolution, but also compare its practicability with other models in the same application scene. This will
F I G U R E 3 Conceptual model of application process of geographical analysis models
8
|
CHEN et al.
F I G U R E 4 Integrated conceptual model of the data model
provide a more convenient and comprehensive understanding of both models and related information. The inte‐ grated conceptual model is shown in Figure 4.
3 | LO G I C A L DATA O R I G I N ATI O N D E S I G N E D FO R G EO G R A PH I C A L A N A LYS I S M O D E L S 3.1 | Data organization framework In this article, based on the proposed conceptual data model, the framework of the logical data organization is rep‐ resented using the diagram shown in Figure 5. There are four basic elements in this framework: character, model, application scene, and event (including character evolution event, model creation event, model evolution event, and model application event). One character or model may experience multiple corresponding evolution events, and they may also be involved in different model application events. One model experiences only one model creation event. In contrast, one model application event can involve several models and characters. One application scene can be re‐ lated to several model application events. Time and location information from different events is recorded to combine the evolution and application processes into a unified spatiotemporal framework for further sorting and analyzing.
F I G U R E 5 Logical framework for the proposed data model
CHEN et al.
| 9
F I G U R E 6 Tables designed for characters
3.2 | Detailed tables designed for the elements 3.2.1 | Tables for characters Two types of characters often appear in the introductory documents, websites, or articles of models. One is the researcher, and the other is the agency (e.g., department, institution). The attributes of a researcher may include name, contact information, research domain, affiliations, and description, while the attributes of an agency may include name, contact information, address, location, researchers, and description. The table used to organize the character information is shown in Figure 6. Both Researcher and Agency are inherited from Character. To record their status during different model evolu‐ tion periods, Researcher and Agency are assigned with InitResearcherStatusID and InitAgencyStatusID, respectively, to track the initial status, and ResearcherStatusIDs and AgencyStatusIDs are assigned to track the related statuses throughout the evolution process. The details of the statuses are stored in ResearcherStatus and AgencyStatus. In ResearcherStatus, the name (Name), research domain (ResearchDomain), and contact information (Cont_information), which is used to indicate the phone number and address of the researcher, are first recorded. As a researcher may
10
|
CHEN et al.
F I G U R E 7 Tables designed for models
belong to different agencies at one time, ResearcherStatus contains a list to record the affiliation IDs (AffiliationIDs), which point to related agencies. In AgencyStatus, the name and contact information are recorded similarly but there are still some differences. AgencyStatus contains a list of IDs corresponding to researchers (ResearcherIDs) to track affiliated researchers. For an agency, Address is a text‐based record of its location, and Location is used to record the exact spatial position. As shown in Table 2, the spatial position can be recorded using geometry (e.g., coordinate points or area).
3.2.2 | Tables for models The table for model description was designed to record the details of geographical analysis models. It is used to describe models in different static status. In this respect, model metadata (e.g., Crosier et al., 2003; Lin, Chen, & Lu, 2013; Wen et al., 2013) can be used as a reference to build this table, which is shown in Figure 7. A model table contains InitModelStatusID and ModelStatusIDs. ModelStatus is the exact table used to record the detailed information about the model during different evolution periods. Here, Name and Version are used to record the corresponding basic information. Classification is used to record the category of a model into TA B L E 2 Examples of agency location information Name
Address
Location (long, lat)
School of Geography Science, Nanjing Normal University
1 Wenyuan Road, Qixia District, Nanjing, China
(118° 55′ E, 32° 07′ N)
Department of Geography, University of Wisconsin
550 North Park Street, Madison, WI, USA
(89° 24′ W, 43° 04′ N)
Geography Department, University of Minnesota
414 19th Ave S, Minneapolis, MN, USA
(93° 14′ W, 44° 58′ N)
CHEN et al.
| 11
a certain domain or domains, such as hydrology and terrestrial. SpatialDimensions indicates if the model is a 1D, 2D, or 3D model, while SpatialExtent indicates the scales at which the model is appropriate (e.g., regional, global, or urban scale). Similar to how keywords are used in articles, Keywords for the models indicate the re‐ lated terms that are used to describe the model. License shows the permit from an authority. DevelopLanguage, SupportedPlatform, SoftwareRequirements, and HardwareRequirements are designed to record the information related to the development language (e.g., C++, Fortran), the runtime platform (e.g., Windows, Linux), the soft‐ ware requirements and hardware requirements that need to be prepared to run the model. As data are very important for model execution, the descriptions of InputDataRequirements as well as OutputData are designed to provide an introduction to the related model data. Source provides the link to a model resource.
3.2.3 | Tables for application scene The application scene is designed to indicate the actual application scenario for model use. The table to store the application scene information is shown in Figure 8. Here, StudyPeriod and StudyRegion are designed to indicate the target period and region for the study and simulation. LocationOfStudyRegion is used to track the study region, using geometry when necessary. The problem is designed to illustrate the context or background of the study or the goals of the simulation. As an application scene may be used in different applications, ApplicationEventIDs are also designed to record related model appli‐ cation events that are used to track the actual application.
3.2.4 | Tables for events Events are essential facts that result in both model evolution and application. Events also play an import role in the evolution of characters. Different events link different models, characters, and application scenes. Most im‐ portantly, time and location information is recorded in events, so that they can contribute to tracking the entire evolution and application process. The tables designed for events are shown in Figure 9. An event contains its type (EventType), occurrence time (OccurrenceTime), formatted occurrence time, which uses the date time data format to record the text‐based occurrence time if necessary (FormatOccurrenceTime), occurrence location (OccurrenceLocation), and the formatted occurrence location, which uses the geometry data format to record the text‐based location of occurrence if necessary (FormatOccurrenceLocation). These time and
F I G U R E 8 Table designed for application scenes
12
|
CHEN et al.
F I G U R E 9 Tables designed for events location data can then be used not only for information tracking, but also for calculating spatiotemporal relation‐ ships and orders. There are four types of events: character evolution, model creation, model evolution, and model application events. 1. According to the attributions of characters in Section 3.2.1, the character evolution event also owns its subtype, which is CharacterEvolutionType. CharacterStatusIDBefore and CharacterStatusIDAfter are designed to track the status of the character before evolution and after evolution, respectively. 2. As a model creation event may involve one to several characters, the model creation event contains a list of IDs related to different characters. To indicate the integration process, which means a new model is created by in‐ tegrating different models, the model creation event also contains a list of traditional model IDs. 3. Similarly, a model evolution event may also involve different characters; thus, it contains a list to track the IDs of related characters. Moreover, ModelEvolutionType is designed to record the model evolution subtype
| 13
CHEN et al.
according to the changes in the attribute information of the model. ModelStatusIDBefore and ModelStatusIDAfter are designed to track the model status before evolution and after evolution, respectively. 4. A model application event employs CharacterIDs and ModelIDs to track the application‐related characters and models.
4 | E X TR AC TI O N O F I N FO R M ATI O N TO CO LLEC T M O D E L‐ R E L ATE D I N FO R M ATI O N 4.1 | Extraction of basic information from the scientific literature The scientific literature is an important resource used by researchers to publish and share their knowledge and experience in specific domains. However, it may take an extensive amount of time to retrieve, read, and analyze the literature. The method to extract information from the scientific literature that is designed in this article uti‐ lizes the Web of Science (WOS) as the data source to acquire the information to collect model‐related information. The WOS is an online platform that can be used to retrieve and index scientific literature. There is much de‐ tailed information that can be exported from the files in the WOS. The extracted and used information mainly includes authors, affiliations, titles, keywords, abstracts, and document publication times. Authors and affiliations are extracted for the characters in the data model. Titles, keywords, and abstracts can be analyzed and used for the information for models and application scenes. Here, although a document is normally published after an experi‐ ment or study, in this article, we use this information to track the approximate time of the model application event. Due to specified name formats, different names will represent the same author or institute. For example, “University of California NCGIA and Geography Department Santa Barbara” and “Department of Geography, University of California Santa Barbara” refer to the same institute with different writing styles. To address these repetitive issues, this article utilizes the Jaccard similarity coefficient (Real & Vargas, 1996) to compare the similar‐ ity and diversity of sample sets, because the differences between the names of institutes are mainly related to the sequences instead of the word contents. This value is limited to [0, 1]. A high coefficient indicates high similarity, and the formula to calculate the Jaccard similarity coefficient is described in Equation (1): |A ∩ B| ( ) |A ∩ B|| | | = J A, B = | |A ∪ B| |A| + |B| − |A ∪ B| | | | | | | | |
(1)
In this equation, A and B indicate the two sample sets. The similarity threshold is set to 0.5 in this study. If the result of the calculation is less than 0.5, the sample sets are defined as different institutes. Otherwise, the sample sets will continue to be differentiated using distance. The latitudes and longitudes of institutes can be acquired through geoc‐ oding. If the distance between two institutes is less than 10 km, they are considered to be different writings of the same institute. However, distance calculation is not applicable for repetitive author names. The solution to this prob‐ lem is to compare author affiliations. If the author affiliations are the same, they will be regarded as the same author. To obtain detailed information about models, such as study region and events, the abstracts of articles should be closely analyzed. Abstracts elaborate on the main objects, scopes, methods, results, and conclusions of the research, which are concisely expounded in a small amount of text. However, it is difficult to automatically acquire the required information from an abstract at the current stage. Thus, this article utilizes manual reading to extract the corresponding information, including study period, study region, and events such as changes in the model version and input data that are described in the abstract.
14
|
CHEN et al.
4.2 | Collection of detailed information based on volunteered geographic information mode Although the method used to extract information from the scientific literature provides a basic approach to collect information on characters, models, and applications, the complexity of text‐based expression and limited artifi‐ cial resources make it difficult to acquire complete information from the scientific literature. A more efficient and rapid method is still needed to collect unstructured information (Liu & Di, 2017). Volunteered geographic information (VGI) is the harnessing of tools to create, assemble, and disseminate geo‐ graphic data provided voluntarily by individuals (Goodchild, 2007). A VGI‐based data collection strategy is de‐ signed that will collect information and fully mobilize the enthusiasm of researchers in various fields. It is expected that the knowledge of scholars will be gathered in an efficient way. Accordingly, the assistive tools are designed as shown in Figure 10. With these tools, users can create and edit information related to researchers, research insti‐ tutes, geographic models, and application scenes through the web. This method can be regarded as an effective way to supplement information beyond the scientific literature.
5 | S YS TE M D E S I G N A N D C A S E S T U DY 5.1 | The usage system A system is designed to verify the usability of the proposed data for the understanding and analysis of geographi‐ cal analysis models. The tool contains functions such as map operation, basic information display, specific queries, and result visualization. Leaflet was used to display the maps, and Google Geocoding was used as a tool to obtain the spatial information of institutes and regions. A NoSQL database entitled MongoDB was used to store the col‐ lected data.
5.2 | Case study Based on the data collection methods proposed in Section 4, the description of a SWAT model from the scientific literature was exported from the WOS. After further analysis of the abstracts, detailed information was provided by students using the VGI‐based information supplement tools. In addition, the acquired data were imported into MongoDB. In this case, related information on models can be analyzed and understood. Here, some example cases are described. The researchers and agencies related to a model can be analyzed. In Figure 11a, the distribution of agen‐ cies (research institutes) who participated in the creation/evolution/application of SWAT is expressed using distance clustering. When zooming in, an independent agency can be selected. As the information of its affili‐ ated researchers has been recorded in AgencyStatus, those in this agency who engaged in SWAT research can be tracked, as illustrated in Figure 11b. In addition, when an individual affiliated researcher is selected, his/her basic information can be acquired. As his/her evolution processes have been recorded using ResearcherStatus and CharacterEvolutionEvent, the changing of his/her employment agencies can also be tracked on the map (see Figure 12). The evolution of a model can also be analyzed. SWAT was mainly developed and modified by the U.S. Department of Agriculture’s Agricultural Research Service (USDA‐ARS) and Texas A&M AgriLife Research. During its evolution, SWAT has been changed and updated several times. For example, its versions have changed during the last 20 years, from SWAT 2000 to SWAT 2005, and then to SWAT 2009. This information was re‐ corded using the proposed ModelEvolutionEvent. When querying, these details can be tracked and are shown in Figure 13.
F I G U R E 1 0 VGI‐oriented tools designed for data editing: (a) editing of characters (researcher status); (b) editing of characters (agency status); (c) editing of model status; and (d) editing of application scene
CHEN et al.
| 15
16
|
CHEN et al.
The model application scenes can also be analyzed. As extensive data were collected from the WOS, each application article was treated as a single application event in this study and recorded using ApplicationScene and ModelApplicationEvent. Therefore, the agencies related to an application can be analyzed. Figure 14 shows the distribution of agencies that applied a model over time. In addition, we can also evaluate different applications by related characters, times, and locations, as shown in Figure 15. Moreover, as agencies, researchers, models, and application scenes have been linked with this proposed model, the relationship at a certain time can also be tracked. With the support of this conceptual model, similar to concepts shown in Wiki, visitors can search a model, check its related versions or models, then go to linked researchers or related institutions, and they can also easily link to related application scenes (see Figure 16). This will further contribute to building advanced model analysis tools (e.g., model knowledge graphs or model lineages).
F I G U R E 1 1 Distribution of model‐related agencies with distance clustering (a) and the affiliated researchers in an agency (b)
F I G U R E 1 2 Evolution (change of employment agencies) of researchers
CHEN et al.
| 17
F I G U R E 1 3 Evolution (version changes) of models
18
| CHEN et al.
F I G U R E 1 4 The distribution of model applications in different years: (a) 2006; (b) 2010; (c) 2013; and (d) 2017
CHEN et al.
| 19
F I G U R E 1 5 The detailed information of application scenes over time
20
| CHEN et al.
CHEN et al.
| 21
F I G U R E 1 6 Usage of the proposed data model for advanced understanding
6 | CO N C LU S I O N S A N D FU T U R E WO R K This article designed a data model to express the evolution and application processes of geographical analysis models. Conceptual and logical data models were designed based on the analysis of the conceptual models, as well as the data collection and extraction strategies. The SWAT was employed as a case study to show the capacity of the proposed data model. As information can be acquired more easily at the current stage, especially through the web, and volunteers are increasingly engaged in information collecting, a data model with consideration of model evolution and application will benefit better model understanding and knowledge sharing. However, to enable the practical and convenient use of the proposed data model, future studies need to consider the following points. The efficiency of data organization and queries. Owing to the complex relationships between models, characters, and application scenes, some information is stored independently in the proposed data organization strategies (e.g., the statuses of the models and characters). Although this was necessary for the logical design, it will affect the efficiency of queries in practical circumstances. The balance between logical organization and query effi‐ ciency should be considered when optimizing the data organization strategy. Automatic/semi‐automatic collection of model evolution and application information. The information related to model evolution and application is rich, and this information has different contents and formats. The proposed
22
|
CHEN et al.
data model can be used practically only when the information or data are collected in a user‐friendly and con‐ venient way. In this case, automatic/semi‐automatic tools for information collection are very important, both for scientific literature analysis and VGI‐based user interfaces (UIs).
AC K N OW L E D G M E N T S We appreciate the detailed suggestions and comments from the secretariat and the anonymous reviewers. We express heartfelt thanks to the other members of OpenGMS team. This work was supported by the NSF for Excellent Young Scholars of China under Grant No. 41622108, the National Basic Research Program of China (973 Program) under Grant No. 2015CB954103, and the Priority Academic Program Development of Jiangsu Higher Education Institutions under Grant No. 164320H116. ORCID Min Chen
http://orcid.org/0000-0001-8922-8789
REFERENCES Anderson, B., Fortson, B. W. IV, Kleinedler, S. R., & Schonthal, H. (2006). The American heritage dictionary of the English language (4th ed.). Boston, MA: Houghton Mifflin Company. Argent, R. M. (2004). An overview of model integration for environmental applications: Components, frameworks and semantics. Environmental Modelling & Software, 19(3), 219–234. Belete, G. F., Voinov, A., & Laniak, G. F. (2017). An overview of the model integration process: From pre‐integration as‐ sessment to testing. Environmental Modelling & Software, 87, 49–63. Beurs, K. M. D., & Henebry, G. M. (2010). Spatio‐temporal statistical methods for modelling land surface phenology. In I. L. Hudson & M. R. Keatley (Eds.), Phenological research: Methods for environmental and climate change analysis (pp. 177–208). New York, NY: Springer. Blumberg, A. F. (1996). An estuarine and coastal ocean version of POM. In Proceedings of the Princeton Ocean Model Users Meeting. Princeton, NJ. Blumberg, A. F., Georgas, N., Yin, L., Herrington, T. O., & Orton, P. M. (2015). Street‐scale modeling of storm surge inun‐ dation along the New Jersey Hudson River waterfront. Journal of Atmospheric & Oceanic Technology, 32, 1486–1497. Blumberg, A. F., & Mellor, G. L. (1987). A description of a three‐dimensional coastal ocean circulation model. In N. S. Heaps (Ed.), Three‐dimensional coastal ocean models (Vol. 4, pp. 1–16). Washington, DC: American Geophysical Union. Chen, M., Lin, H., Lu, G., He, L., & Wen, Y. (2011). A spatial‐temporal framework for historical and cultural research on China. Applied Geography, 31(3), 1059–1074. Chen, M., Lu, G., Wen, Y., Tao, H., & Fei, G. (2009). Studying on distributed sharing of geographical analysis model. In Proceedings of the 2009 WRI World Congress on Computer Science and Information Engineering (Vol. 2, pp. 346–349). Los Angeles, CA: IEEE. Chen, Z., Lin, H., Chen, M., Liu, D., Bao, Y., & Ding, Y. (2014). A framework for sharing and integrating remote sensing and GIS models based on web service. Scientific World Journal, 2014, 354919. Chorley, R. J., & Haggett, P. (2013). Integrated models in geography. London, UK: Routledge. Clifford, N., Cope, M., Gillespie, T., & French, S. (2016). Key methods in geography (3rd ed). London, UK: Sage. Conlan, O., Wade, V., Bruen, C., & Gargan, M. (2002). Multi‐model, metadata driven approach to adaptive hypermedia services for personalized e‐learning. In P. De Bra, P. Brusilovsky, & R. Conejo (Eds.), Adaptive hypermedia and adaptive web‐based systems (Lecture Notes in Computer Science, Vol. 2347, pp. 100–111). Berlin, Germany: Springer. Cressie, N., & Majure, J. J. (1997). Spatio‐temporal statistical modeling of livestock waste in streams. Journal of Agricultural, Biological & Environmental Statistics, 2(1), 24–47. Crosier, S. J., Goodchild, M. F., Hill, L. L., & Smith, T. R. (2003). Developing an infrastructure for sharing environmental models. Environment & Planning B, 30(4), 487–501. Curtis‐Ham, S., & Walton, D. (2017). Mapping crime harm and priority locations in New Zealand: A comparison of spatial analysis methods. Applied Geography, 86, 245–254.
CHEN et al.
| 23
David, O., Ascough, J. C. II, Lloyd, W., Green, T. R., Rojas, K. W., Leavesley, G. H., & Ahuja, L. R. (2013). A software en‐ gineering perspective on environmental modeling framework design: The object modeling system. Environmental Modelling & Software, 39(1), 201–213. Demeritt, D., & Wainwright, J. (2005). Models, modelling and geography. In N. Castree, A. Rodgers, & D. Sherman (Eds.), Questioning geography (pp. 206–225). Oxford, UK: Blackwell. Derome, J., Brunet, G., Plante, A., Gagnon, N., Boer, G. J., Zwiers, F. W., … Ritchie, H. (2001). Seasonal predictions based on two dynamical models. Atmosphere‐Ocean, 39(4), 485–501. Doetterl, S., Berhe, A. A., Nadeu, E., Wang, Z., Sommer, M., & Fiener, P. (2016). Erosion, deposition and soil carbon: A review of process‐level controls, experimental tools and models to address C cycling in dynamic landscapes. Earth‐ Science Reviews, 154, 102–122. El‐Gayar, O., & Tandekar, K. (2007). An XML‐based schema definition for model sharing and reuse in a distributed envi‐ ronment. Decision Support Systems, 43(3), 791–808. Ezer, T., & Mellor, G. L. (2000). Sensitivity studies with the North Atlantic sigma coordinate Princeton ocean model. Dynamics of Atmospheres & Oceans, 32(3&4), 185–208. Filatova, T., Verburg, P. H., Parker, D. C., & Stannard, C. A. (2013). Spatial agent‐based models for socio‐ecological sys‐ tems: Challenges and prospects. Environmental Modelling & Software, 45(5), 1–7. Fischer, M. M., & Getis, A. (2011). Handbook of applied spatial analysis: Software tools, methods and applications. London, UK: Taylor & Francis. Folkesson, A., Jelsbak, L., Yang, L., Johansen, H. K., Ciofu, O., Hoiby, N., & Molin, S. (2012). Adaptation of Pseudomonas aeruginosa to the cystic fibrosis airway: An evolutionary perspective. Nature Reviews Microbiology, 10, 841–851. Fook, K. D., Monteiro, A. M. V., Casanova, M. A., & Amaral, S. (2009). Geoweb services for sharing modelling results in biodiversity networks. Transactions in GIS, 13(4), 379–399. Freedman, D. G. (1974). Human infancy: An evolutionary perspective. Mahwah, NJ: Lawrence Erlbaum Associates. Goodchild, M. F. (2007). Citizens as sensors: The world of volunteered geography. GeoJournal, 69(4), 211–221. Granell, C., Schade, S., & Ostländer, N. (2013). Seeing the forest through the trees: A review of integrated environmental modelling tools. Computers, Environment & Urban Systems, 41(5), 136–150. Huang, B., Wu, B., & Barry, M. (2010). Geographically and temporally weighted regression for modeling spatio‐temporal variation in house prices. International Journal of Geographical Information Science, 24(3), 383–401. Hülse, D., Arndt, S., Wilson, J. D., Munhoven, G., & Ridgwell, A. (2017). Understanding the causes and consequences of past marine carbon cycling variability through models. Earth‐Science Reviews, 171, 349–382. Huret, M., Petitgas, P., & Woillez, M. (2010). Dispersal kernels and their drivers captured with a hydrodynamic model and spatial indices: A case study on anchovy (Engraulis encrasicolus) early life stages in the Bay of Biscay. Progress in Oceanography, 87(1–4), 6–17. Laniak, G. F., Olchin, G., Goodall, J., Voinov, A., Hill, M., Glynn, P., … Hughes, A. (2013). Integrated environmental model‐ ing: A vision and roadmap for the future. Environmental Modelling & Software, 39, 3–23. Lauf, S., Haase, D., Hostert, P., Lakes, T., & Kleinschmit, B. (2012). Uncovering land‐use dynamics driven by human deci‐ sion‐making—A combined model approach using cellular automata and system dynamics. Environmental Modelling & Software, s27&28(1), 71–82. Lin, H., Batty, M., Jørgensen, S. E., Fu, B., Konecny, M., Voinov, A., … Chen, M. (2015). Virtual environments begin to em‐ brace process‐based geographic analysis. Transactions in GIS, 19(4), 493–498. Lin, H., & Chen, M. (2015). Managing and sharing geographic knowledge in virtual geographic environments (VGEs). Annals of GIS, 21(4), 261–263. Lin, H., Chen, M., & Lu, G. (2013). Virtual geographic environment: A workspace for computer‐aided geographic experi‐ ments. Annals of the Association of American Geographers, 103(3), 465–482. Liu, L. Y., & Di, H. (2017). Study on the construction of historical toponymic information management system for essence of the geographical content of the history books. Annals of GIS, 23, 281–291. Lu, G. N. (2011). Geographic analysis‐oriented virtual geographic environment: Framework, structure and functions. Science China, 54(5), 733–743. Maguire, D. J., Batty, M., & Goodchild, M. F. (2005). GIS, spatial analysis, and modeling. Journal of Luminescence, 132(11), 3035–3041. McGrattan, K. B., McDermott, R. J., Weinschenk, C. G., & Forney, G. P. (2013). Fire dynamics simulator: Technical reference guide (6th ed.). Gaithersburg, MD: NIST Special Publication No. 1018. Mellor, G. L., Häkkinen, S. M., Ezer, T., & Patchen, R. C. (2002). A generalization of a sigma coordinate ocean model and an inter‐comparison of model vertical grids. In N. Pinardi & J. Woods (Eds.), Ocean forecasting (pp. 55–72). Berlin, Germany: Springer. Metcalf & Eddy, Inc. (1971). Storm water management model: Final report. Washington, DC: U.S. Environmental Protection Agency.
24
|
CHEN et al.
Noone, D., & Sturm, C. (2010). Comprehensive dynamical models of global and regional water isotope distributions. In J. West, G. Bowen, T. Dawson, & K. Tu (Eds.), Isoscapes. Dordrecht, The Netherlands: Springer. Perry, G. L. (2009). Modeling and simulation. In N. Castree, D. David, D. Liverman, & B. Rhoads (Eds.), A companion to environmental geography (pp. 336–356). Oxford, UK: Blackwell. Real, R., & Vargas, J. M. (1996). The probabilistic basis of Jaccard’s index of similarity. Systematic Biology, 45(3), 380–385. Seenath, A. (2015). Modelling coastal flood vulnerability: Does spatially‐distributed friction improve the prediction of flood extent? Applied Geography, 64, 97–107. Skilling, H. (1964). An operational view. American Scientist, 52(4), 388A–396A. Torrens, P. M. (2015). Intertwining agents and environments. Environmental Earth Sciences, 74(10), 7117–7131. Torrens, P. M. (2017). A computational sandbox with human automata for exploring perceived egress safety in urban damage scenarios. International Journal of Digital Earth, 10(1), 1–28. Voinov, A., & Cerco, C. (2010). Model integration and the role of data. Environmental Modelling & Software, 25(8), 965–969. Voinov, A., Coltekin, A., Chen, M., & Beydoun, G. (2018). Virtual geographic environments in socio‐environmental model‐ ing: A fancy distraction or a key to communication? International Journal of Digital Earth, 11(4), 408–419. Voinov, A., & Shugart, H. H. (2013). ‘Integronsters’, integral and integrated modeling. Environmental Modelling & Software, 39, 149–158. Walker, R., McKenzie, P., Liddell, C., & Morris, C. (2015). Spatial analysis of residential fuel prices: Local variations in the price of heating oil in Northern Ireland. Applied Geography, 63, 369–379. Wen, Y., Chen, M., Lu, G., & Lin, H. (2013). Prototyping an open environment for sharing geographical analysis models on cloud computing platform. International Journal of Digital Earth, 6(4), 356–382. Wen, Y., Chen, M., Yue, S. S., Zheng, P. B., Peng, G. Q., & Lu, G. N. (2016). A model‐service deployment strategy for collaboratively sharing geo‐analysis models in an open web environment. International Journal of Digital Earth, 10(4), 405–425. You, L., & Lin, H. (2016). Towards a research agenda for knowledge engineering of virtual geographical environments. Annals of GIS, 22(3), 163–171. Yue, S., Chen, M., Wen, Y., & Lu, G. (2016). Service‐oriented model‐encapsulation strategy for sharing and integrating heterogeneous geo‐analysis models in an open web environment. ISPRS Journal of Photogrammetry & Remote Sensing, 114, 258–273. Yue, S., Wen, Y., Chen, M., Lu, G., Hu, D., & Zhang, F. (2015). A data description model for reusing, sharing and integrating geo‐analysis models. Environmental Earth Sciences, 74(10), 7081–7099. Zhang, C., Chen, M., Li, R., Fang, C., & Lin, H. (2016). What’s going on about geo‐process modeling in virtual geographic environments (VGEs). Ecological Modelling, 319, 147–154.