ORIGINAL RESEARCH CONTRIBUTION
Developing a Diagnosis-based Severity Classification System for Use in Emergency Medical Services for Children Evaline A. Alessandrini, MD, MSCE, Elizabeth R. Alpern, MD, MSCE, James M. Chamberlain, MD, Judy A. Shea, PhD, Richard Holubkov, PhD, and Marc H. Gorelick, MD, MSCE, for the Pediatric Emergency Care Applied Research Network*
Abstract Objectives: Lack of adequate risk adjustment methodologies has hindered the progress of emergency medicine health services research. The authors hypothesized that a consensus-derived, diagnosis-based severity classification system (SCS) would be significantly associated with actual measures of emergency department (ED) resource use and could ultimately be used to examine severity-adjusted outcomes across patient populations. Methods: A panel of subject matter experts used consensus methods to assign severity scores (1 = lowest severity to 5 = highest severity) to 3,041 ED International Classifications of Diseases (ICD), 9th revision, diagnosis codes. SCS scores were assigned to ED visits using the visit diagnosis code with the highest severity. We tested the association between the SCS scores and measures of ED resource use in three data sets: the Pediatric Emergency Care Applied Research Network Core Data Project (PCDP), the National Hospital Ambulatory Medical Care Survey (NHAMCS), and the Connecticut state ED data set. Results: There was a significant association between the five-level SCS and all six measures of resource use: triage category, disposition, ED resource use, Current Procedural Terminology Evaluation and Management (CPT E&M) codes, ED length of stay, and ED charges within the three ED data sets. Conclusions: The SCS demonstrates validity in its strong association with actual ED resource use. The use of readily available ICD-9 diagnosis codes makes the SCS useful as a risk adjustment tool for health services research. ACADEMIC EMERGENCY MEDICINE 2012; 19:70–78 ª 2012 by the Society for Academic Emergency Medicine
From the Department of Pediatrics, University of Cincinnati College of Medicine, James M. Anderson Center for Health Systems Excellence and Division of Emergency Medicine, Cincinnati Children’s Hospital and Medical Center (EAA), Cincinnati, OH; the Department of Pediatrics, University of Pennsylvania School of Medicine, Division of Emergency Medicine, The Children’s Hospital of Philadelphia (ERA), Philadelphia, PA; the Departments of Pediatrics and Emergency Medicine, George Washington University School of Medicine, and the Division of Emergency Medicine, Children’s National Medical Center (JMC), Washington, DC; the Department of Medicine, Division of General Internal Medicine, University of Pennsylvania School of Medicine (JAS), Philadelphia, PA; the Department of Pediatrics, University of Utah Health Sciences (RH), Salt Lake City, UT; and the Department of Pediatrics, Medical College of Wisconsin and Section of Emergency Medicine, Children’s Hospital of Wisconsin (MHG), Milwaukee, WI. Received May 4, 2011; revisions received July 2 and July 5, 2011; accepted July 6, 2011. *PECARN members are listed in Appendix A. Presented in part at the Pediatric Academic Societies Meetings, May 2007, Toronto, Ontario, Canada. Funding was obtained through an HRSA Emergency Medical Services for Children (EMSC) Targeted Issues Grant (Grant H34MC02547) and The Pediatric Emergency Care Applied Research Network (PECARN) is supported by cooperative agreements U03MC00001, U03MC00003, U03MC00006, U03MC00007, and U03MC00008 from the EMSC program of the Maternal and Child Health Bureau, Health Resources and Services Administration, U.S. Department of Health and Human Services. The authors have no further disclosures or conflicts of interest to report. Supervising Editor: Lowell Gerson, PhD. Address for correspondence and reprints: Evaline A. Alessandrini, MD, MSCE; e-mail:
[email protected].
70
ISSN 1069-6563 PII ISSN 1069-6563583
ª 2012 by the Society for Academic Emergency Medicine doi: 10.1111/j.1553-2712.2011.01250.x
ACADEMIC EMERGENCY MEDICINE • January 2012, Vol. 19, No. 1
T
he Emergency Medical Services for Children (EMSC) Program mission statement maintains that the EMSC program ‘‘aims to ensure state-ofthe-art emergency medical care for the ill or injured child and adolescent.’’1 To achieve this aim, quality of EMSC care must be assured across settings, patient populations, and practitioners, yet children present to emergency departments (EDs) with illnesses of varying severity and acuity, ranging from rashes and colds to respiratory failure and cardiac arrest. Moreover, patients receive their emergency care in a variety of settings, in various geographic locations, and from practitioners with varying degrees of training and experience, resulting in significant variation in care delivery and quality.2–8 Because EDs provide care to patients with a full spectrum of illnesses and injuries, it is important to have a severity of illness scale that is applicable to all pediatric emergency patients. While several injury scoring systems exist,9–12 they are only applicable to the approximately 25% of pediatric ED visits that occur as a result of trauma.13 Other systems that classify severity of illness focus on adults or inpatients, and not children receiving emergency care.14 Although there are two risk-adjustment tools to assess severity of illness for pediatric ED visits, both tools require significant data abstraction from ED patient records.15,16 This is timeconsuming and costly and precludes the application of severity adjustment to large administrative databases. Furthermore, because patient chart review raises personal health information concerns, it is unlikely that these severity measures will be used on a large scale except in carefully controlled research studies and thus has limited applicability for administrative and policy purposes. A sensible way to classify illness severity for EMSC would be to base such classification on a readily available, familiar, and widely used system. The International Classification of Diseases and Related Health Problems, Ninth Revision, Clinical Modification, commonly referred to as ICD-9, is a system developed to classify diagnosis data for indexing medical records, case reviews, and ambulatory and other medical care programs and to provide basic health statistics. It is familiar internationally, widely used, and often captured in administrative databases. To address the need for a system that can easily be applied to existing ED data, we developed a diagnosis-driven, resource-focused, severity of illness classification system for EMSC using ICD-9 diagnosis codes. We hypothesized that a diagnosis-based severity classification system (SCS) developed using an expert panel and consensus methods would be significantly associated with visit-level measures of resource use (a measure of severity) found in existing administrative ED data sets. Ultimately, such a system could be used to examine severity-adjusted outcomes across patient populations so that EDs may improve the quality of care delivered. METHODS Study Design A panel of subject matter experts used consensus methods, including Delphi surveys and the nominal group
•
www.aemj.org
71
technique, to assign severity scores to diagnosis codes. These consensus methods provide a means of synthesizing information where unanimity of opinion does not exist owing to insufficient (or conversely an overload of) information.17–19 The methods assess the extent of agreement (consensus measurement) and resolve disagreement (consensus development). Strengths of these methods include 1) anonymity—dominance is avoided by using private ratings in nominal group and questionnaires in Delphi; 2) multiple iterations—processes occur in ‘‘rounds,’’ allowing individuals to change their opinions; 3) controlled feedback—the distributions of the group’s responses are shown; and 4) statistical group response—judgment is expressed using summary measures of the full group response, giving more information than just a consensus statement.17–19 In the absence of a reference standard for severity of illness, we chose to test construct validity: the association between our severity measure and another measure expected to correlate with severity of illness. For our construct of severity we chose resource utilization, under the assumption that, while actual resources used may not perfectly reflect resources needed for an individual patient, when averaged across large numbers of patients and providers, resource use is a reasonable proxy for resource requirements.16 Therefore, resource use should reflect overall severity across large groups of patients. We performed secondary analyses of existing emergency medicine (EM) data sets to assess the association between the consensus-derived SCS and measures of actual ED resource use. The study was reviewed and determined to be exempt or approved by the institutional review boards of the participating investigators’ hospitals and by the university of the central data center of the research network in which this study was conducted. Study Setting and Population The study was performed within the Pediatric Emergency Care Applied Research Network (PECARN), a federally funded national network with diverse hospital types, patient populations, and providers.20,21 We convened an expert panel of 14 general and pediatric emergency physicians, moderated by an experienced consensus group facilitator (JAS). Panel members included physicians from across the United States, practicing in a variety of hospital settings. Specifically, we had representatives from academic and nonacademic hospitals; from small-, medium-, and large-volume EDs; and from urban, suburban, and rural hospitals. This panel previously developed a diagnosis grouping system (DGS) for pediatric ED visits using similar methodology.13 The DGS is a clinically sensible method for describing pediatric ED diagnoses by grouping ICD-9 codes into one of 77 mutually exclusive diagnosis subgroups. Study Protocol Principal Data Source. The data source used to identify ICD-9 codes included in the SCS was the PECARN Core Data Project (PCDP).20 These data were obtained from extant electronic data sets from the 20 EDs within the PECARN network from which ED discharge diagnosis
72
Alessandrini et al.
codes could be reliably extracted from 2002 data.21 We included all patients treated at the participating EDs in the year 2002, aged birth to the 19th birthday. Data were collected, cleaned, and stored as previously described by the data coordinating center.20 Because up to 15 ICD-9 codes could be recorded per visit, over 1 million diagnoses were included in the 2002 PCDP. We assigned severity scores to 3,041 diagnosis codes included in the DGS.13 These 3,041 diagnosis codes represent all codes that occurred at least 10 times in the PCDP data set and accounted for 98.9% of all diagnoses given during ED visits. Definition of Severity. For this study, expert panel members were instructed to define severity of illness by the intensity of resources needed to diagnose and treat a patient in the ED with a given diagnosis. Resources could include the number and types of personnel at the patient’s bedside, cognitive effort needed, and the number and intensity of diagnostic and therapeutic interventions required. Given the potential variation in the severity of patients with an individual diagnosis, expert panel members were asked to recall all of the children they had seen with that diagnosis over the past year and to use the resources most often required for these children to assign a severity score. Creating the SCS. After an initial meeting to discuss the goals and the timeline for the project, electronic Delphi surveys were sent to panel members independently. Each panel member was asked to use his or her expert opinion to assign a severity rating to a random sample of ICD-9 codes from the DGS. Each diagnosis code was assigned a score between 1, minimal resources needed, and 5, maximum resources needed. To assist panel members, examples were provided to anchor the severity scores. The prototype for severity 1 was diaper dermatitis, where only a history and physical examination are needed, and the prototype for severity 5 was anaphylactic shock, where many personnel and diagnostic and therapeutic interventions are required. Ten of the 14 panel members assigned severity scores to a random sample of approximately 600 diagnosis codes each (20%). They rated only diagnosis codes and were blinded to accompanying resource use. To assure consideration of all diagnoses in relationship to one another, investigators on the expert panel assigned severity ratings to either half (JMC, MHG) or all (EAA, ERA) of the diagnosis codes. Thus, a total of six experts rated each diagnosis code for severity. Consensus was achieved and a final severity score was assigned to a diagnosis when at least four of the six raters assigned the same severity (simple majority), and the range between scores was not more than one (for example, four raters assigned a severity of 4, and two raters assigned a severity of 3; final severity score = 4). Diagnosis codes without severity consensus after the first evaluation were sent for a second Delphi survey round to the same reviewers. In this round, reviewers were asked to consider altering their original response after reviewing the distribution of scores for that code assigned by all six reviewers from the first round.
•
A SEVERITY CLASSIFICATION SYSTEM FOR EMSC
Again, consensus was defined as a simple majority with a range not more than one. A 1-day facilitated consensus meeting was held to finalize severity scores that could not be determined electronically using our methodology. After the data were reviewed, and to prepare for the consensus meeting, three types of nonconsensus issues were defined. In the first type, there was no majority rating and the difference between scores was greater than one severity category. These diagnoses represented those with the least consensus. In the second type, the range of responses was only one severity category, but there was no clear majority. For example, three raters may have assigned a severity of 2, and three raters assigned a severity of 3. In the third type, diagnoses received a majority rating, but the difference between scores was greater than one severity category; i.e., four raters assigned a severity of 4, and one each assigned a severity of 3 and 2. Panel members were also given a spreadsheet for each DGS subgroup with all subgroup diagnosis codes placed within their severity category. Codes without a consensus severity were listed in a separate column on the same sheet. This allowed the group to assess consistency of severity ratings across diagnosis codes, since the same diagnosis with different ICD-9 codes should have the same severity. For example, urticaria may be coded as ‘‘idiopathic,’’ ‘‘unspecified,’’ or ‘‘allergic.’’ DGS subgroup spreadsheets also allowed panel members to assess severity trends within a subgroup, ensuring that there is a logical increase in severity and that different diagnoses within a severity category are similar with regard to resource use. For example, within the allergic, immunologic, and rheumatologic subgroup, urticaria requires fewer resources than Henoch-Schonlein purpura, which in turn requires fewer resources than anaphylactic shock. In addition, diagnoses in the same severity category, such as systemic lupus erythematosus and juvenile rheumatoid arthritis, should require a similar level of resources in the ED. The final consensus meeting used the nominal group technique, and proposals by investigators or panel members were adopted if agreed upon by two-thirds of panel members. Recognizing that all standards are arbitrary,22,23 and balancing the need to move the project forward with the knowledge that these codes had already been through two rounds of review, the investigative team chose two-thirds rather than a more stringent cutoff. Validating the SCS. We assessed the association between our expert panel’s assignment of diagnosis severity and our validity construct and the actual measures of ED resource use, for diagnoses found in three data sets in 2002: the PCDP, the National Hospital Ambulatory Medical Care Survey (NHAMCS), and the Connecticut state ED data set. The PCDP included two versions: PCDP I (637,271 visits), electronic administrative data from calendar year 2002 and 3 months of 2003 (February through April); and PCDP II (9,444 visits) data obtained by manual chart abstraction from up to 60 randomly selected pediatric patients per site per day
ACADEMIC EMERGENCY MEDICINE • January 2012, Vol. 19, No. 1
seen on 10 randomly selected dates within February to April 2003 at participating PECARN sites. The NHAMCS is designed to collect data on the utilization and provision of ambulatory care services in hospital emergency and outpatient departments. ED findings are based on a national probability sample of visits to the ED of noninstitutional general and short-stay hospitals and in 2002 represented 28,358,128 ED visits.24 The Connecticut Hospital Association ChimeData Program (n = 315,308 visits in 2002) maintains a proprietary health care information system that incorporates statewide clinical, financial, and patient demographic data and is available on a fee-for-service basis (Chime, Inc., http://www.cthosp.org). We created a visit-level definition of severity called the SCS score, which is based on the highest severity of all diagnoses associated with the visit. Given that each visit could have multiple diagnoses, the SCS score was assigned based on the diagnosis that carried the highest rated severity for that visit. SCS scores were assigned to each ED visit in all study data sets. We then tested the association of the SCS scores with actual measures of ED resource use in each data set. Outcome Measures of Resource Use. We tested the association between the SCS score and six distinct measures of resource use: 1) triage category, 2) ED disposition, 3) actual ED resource use, 4) Current Procedural Terminology Evaluation and Management (CPT E&M) code levels, 5) ED length of stay, and 6) ED charges. Triage category was coded as emergent, urgent, or nonurgent in the PCDP II and as visit urgency in NHAMCS (time to be seen 1 to 2 hours, and >2 to 24 hours). Disposition was categorized as discharged to home; admitted, transferred, or observed; admitted to an intensive care unit or for surgery; and died, in both PCDP II and NHAMCS. PCDP I included three categories: discharged, admitted ⁄ transferred ⁄ observed, or died. The Connecticut database included only two categories: discharged or admitted, transferred, or observed. Categories of resource use were routine nursing and medical care (patient discharged to home from the ED with no diagnostic tests or therapeutic procedures performed), discharged to home after diagnostics performed and ⁄ or therapeutics received in the ED, and admitted to the hospital or died in the ED.16 Six CPT E&M codes used to report services in the ED were examined: 99281 (presenting problems are self-limited or minor), 99282 (low to moderate severity), 99283 (moderate severity), 99284 (high severity, require urgent evaluation by a physician but do not pose an immediate significant threat to life), 99285 (high severity and pose an immediate significant threat to life), and 99291 ⁄ 99292 (critical care services provided to the critically ill or injured patient) and were reported in the PCDP I. CPT codes are reported only for hospitals with reliable collection20 and accounted for approximately 50% of ED visits. Length of stay was defined as arrival time subtracted from ED discharge time and was reported in minutes in both PCDP databases as well as the NHAMCS. Charges were included in the Connecticut database only and excluded any inpatient charges.
•
www.aemj.org
73
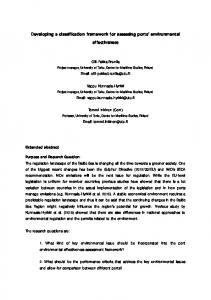
Data Analysis For validation of the system, the unit of analysis was the ED visit. Our analysis plan used nonparametric statistics to assess the significance of associations between the ordered five-category SCS score and disposition ⁄ resource use variables that were binary, ordered categorical, or continuous. Specifically, the Mantel-Haenszel chi-square statistic was used to assess significance of association of SCS score with binary outcomes, the Jonckeheere-Terpstra statistic was used to assess the significance of association of SCS score with ordered categorical outcomes, and a tau test (of the hypothesis that the Kendall’s tau-b statistic is significantly different from zero) was used to assess the significance of association of SCS score with continuous outcomes. For the continuous outcomes, ED length of stay and charges, we used medians and rank-based measures to eliminate the effect of extreme outliers. ED length of stays longer than 1,440 minutes were excluded, and ED charges were truncated at the 99th percentile, as these values were felt to represent data errors in a majority of circumstances. All analyses were performed in SAS statistical programs (SAS Institute, Cary, NC); p < 0.05 was considered statistically significant. Reported p-values were not formally adjusted for multiple comparisons; magnitudes of significance in all tests performed were sufficiently high that such adjustment would not affect the interpretation of our findings. RESULTS Severity Scores at the Diagnosis Level A total of 3,041 ICD-9 codes were rated by the expert panel. Consensus was achieved on 1,535 of 3,041 (50.5%) of ICD codes in the first round of Delphi surveys. Of the remaining codes, consensus was achieved on 1,152 of 1,509 (76.3%) in the second Delphi survey round. Overall, after two electronic Delphi survey rounds, 88% of codes had an assigned severity score. The remaining 12% (354 diagnosis codes) of severity ratings were assigned at the consensus meeting. Of these diagnosis codes, 60 (17%) did not have a majority severity score and the range of scores exceeded one; 214 (60%) did not have a majority, but the range was only one; and 80 (23%) had a majority severity score, but the range exceeded one. After the final consensus meeting, all 3,041 diagnosis codes had received a severity designation: 7% of codes were assigned a severity score of 1, 22% were assigned a code of 2, 43% were assigned a score of 3, 25% were assigned a score of 4, and 3% were assigned a code of 5. The most prevalent ICD-9 codes within each severity rating are shown in Table 1. Severity Scores at the Visit Level Figure 1 shows the distribution of visit-level severity derived from the SCS scores in each of the study data sets. More than 80% of visits in each data set were assigned a score of 2 or 3; severity scores of 1 or 5 comprised less than 5% of visits. SCS Validity Tables 2 through 4 show the association between the SCS scores and actual measures of ED resource use
74
Alessandrini et al.
Table 1 Most Common Diagnosis Codes (ICD-9) Within Each Severity Category
ICD Code
Description
Severity Rating 1 6929 Contact dermatitis and other eczema, due to unspecified cause V583 Attention to surgical dressings and sutures 6910 Diaper or napkin rash Severity Rating 2 4659 Acute upper respiratory infections of unspecified site 3829 Unspecified otitis media 07999 Unspecified viral infection in conditions classified elsewhere and of unspecified site Severity Rating 3 7806 Fever 49390 Asthma, unspecified, unspecified 78703 Vomiting alone Severity Rating 4 78039 Other convulsions 7850 Unspecified tachycardia 49391 Unspecified asthma, with status asthmaticus Severity Rating 5 7990 Asphyxia 0389 Unspecified septicemia 78603 Apnea
Percentage of All Visits in the 2002 PCDP 0.57 0.41 0.31 4.44 3.91 3.73
4.98 2.30 1.83 0.84 0.31 0.26 0.08 0.06 0.06
PCDP = PECARN Core Data Project.
Figure 1. Severity Classification System Score.
available within each data set. Disposition and ED resource use are reported for all three data sets, CPT E&M codes are only available for PCDP data, and charges are available only in the Connecticut state ED data set. Within each data set, higher SCS scores are associated with increased probability of being triaged as higher urgency. Higher SCS scores are associated with increased probability of hospital admission. Disposition recorded specifically as death in the ED occurred only in visits with a SCS score of 5 in NHAMCS data and PCDP II; 84% of deaths occurred in the SCS
•
A SEVERITY CLASSIFICATION SYSTEM FOR EMSC
category 5 in the PCDP I. Each table shows the relationship between the SCS score and ED interventions. Visits with higher SCS scores are more likely to include diagnostic or therapeutic interventions. In addition, higher SCS scores are associated with higher CPT E&M codes, indicating a higher complexity of medical decision-making. Finally, results demonstrate that higher SCS scores are associated with increased ED length of stay and increased ED charges. Median length of stay in the ED increased from approximately 60 minutes to over 180 minutes as visit severity increased from 1 to 5. Median charges as recorded in the Connecticut database increased steadily from $158 for SCS score 1 visit to over $1,600 for SCS score 5 visits. Two-tailed p-values are