We attempt to develop a framework for the distributed processing of images, in ..... an introduction to visual programming languages and the fourth section is a sur- ..... viewed as a struct (using C's terminology) with any number of fields of different ... Our VPL is to provide a concise set of features but without making it over-.
UNIVERSITY OF ADELAIDE Department of Computer Science
Developing a Distributed Image Processing and Management Framework
Submitted in partial fulfillment of the requirements for the degree of Honours in Computer Science
Author: Simon J. Del Fabbro Supervisors: Drs. Ken Hawick and Paul Coddington Date: June 2000 1
Abstract We attempt to develop a framework for the distributed processing of images, in particular, the remote accessing and manipulation of large geo-referenced images. The development is broken down into two different stages. The first involves the development of a dataflow visual programming language (VPL) to allow users to develop programs out of chains of image operators. Programs are represented by directed acyclic graphs (DAGs). One of the goals of this tool is to allow nonprogrammers to develop complex programs that can be computed in parallel. The dataflow computational model on which the VPL is based is ideal since the relationship between data and its operators are explicit and writing programs is intuitive. The development of the distributed image processing infrastructure was the final stage of the project. Once a program is written, data and instructions are sent to a network of machines for processing. For the processing of images we used Java Advanced Imaging (JAI). We also evaluated the use of Java RMI and sockets to distribute the data.
2
Acknowledgements I would like to thank my supervisors Dr. Ken Hawick and Dr. Paul Coddington for their supervision and guidance throughout the last 12 months. I would also like to thank Dr. Andrew Wendelborn for reading and commenting on my work on dataflow languages and exception handling. I would also like to thank Dr. Heath James for reading my thesis and for his valuable comments. I would like to thank my family and friends for their support. In particular, I would like to thank the following people: my brother Nigel and his girlfriend Karen for cooking dinner for me every Tuesday night when I was working and our parents were away; Michael Hollfelder for encouraging me to do honours midyear; Alex Prichard and Andrew Walker for organising my social life; and finally, my parents for their support and encouragement. Thanks also goes to my colleagues who shared with me the sometimes hellish experience known as honours: John Bastian, Joseph Kuehn and Daniel Pooley.
3
Contents 1 Introduction 1.1 Distributed Computing . . . . . . . . . . . . . . . . . 1.1.1 Introduction . . . . . . . . . . . . . . . . . . . 1.1.2 Developing distributed applications . . . . . . 1.1.3 Image Servers . . . . . . . . . . . . . . . . . . 1.2 Dataflow for distributed computation . . . . . . . . . 1.3 Visual Programming Languages . . . . . . . . . . . . 1.3.1 Introduction . . . . . . . . . . . . . . . . . . . 1.3.2 Advantages of VPLs . . . . . . . . . . . . . . 1.3.3 Design Issues with VPLs . . . . . . . . . . . . 1.3.4 Typing . . . . . . . . . . . . . . . . . . . . . . 1.3.5 Categorising Visual Programming Languages . 1.4 Visual Programming Languages for Image Processing 1.4.1 Cantata . . . . . . . . . . . . . . . . . . . . . 1.4.2 AVS . . . . . . . . . . . . . . . . . . . . . . . 1.5 Visual Languages for Parallel Applications . . . . . . 1.5.1 HeNCE . . . . . . . . . . . . . . . . . . . . . 1.5.2 CODE . . . . . . . . . . . . . . . . . . . . . . 1.5.3 Meander . . . . . . . . . . . . . . . . . . . . . 1.6 Summary of project . . . . . . . . . . . . . . . . . . . 2 Dataflow Visual Programming Language 2.1 Introduction . . . . . . . . . . . . . . . . 2.2 Control Structures . . . . . . . . . . . . 2.2.1 Switch . . . . . . . . . . . . . . . 2.2.2 If-Else . . . . . . . . . . . . . . . 4
. . . .
. . . .
. . . .
. . . .
. . . .
. . . .
. . . .
. . . . . . . . . . . . . . . . . . .
. . . .
. . . . . . . . . . . . . . . . . . .
. . . .
. . . . . . . . . . . . . . . . . . .
. . . .
. . . . . . . . . . . . . . . . . . .
. . . .
. . . . . . . . . . . . . . . . . . .
. . . .
. . . . . . . . . . . . . . . . . . .
. . . .
. . . . . . . . . . . . . . . . . . .
9 11 11 12 13 14 15 15 16 17 19 20 21 21 25 26 26 27 27 27
. . . .
30 30 32 32 32
2.3 2.4 2.5 2.6
2.7
2.2.3 Case . . . . . . . . . . . . . . . . . . . . . . . . . . . . . . 2.2.4 Selector . . . . . . . . . . . . . . . . . . . . . . . . . . . . Miscellaneous functions . . . . . . . . . . . . . . . . . . . . . . . . 2.3.1 Clone . . . . . . . . . . . . . . . . . . . . . . . . . . . . . Get and Set property operators . . . . . . . . . . . . . . . . . . . Control Loops and Iteration . . . . . . . . . . . . . . . . . . . . . Type System . . . . . . . . . . . . . . . . . . . . . . . . . . . . . 2.6.1 Overview of typing and type checking issues in textual languages . . . . . . . . . . . . . . . . . . . . . . . . . . . . . 2.6.2 Image representation and typing in AVS and Cantata . . . 2.6.3 Geo-image representation and Typing . . . . . . . . . . . . Exception Handling and Propagation . . . . . . . . . . . . . . . .
3 Implementing the VPL environment 3.1 The Interface . . . . . . . . . . . . . 3.1.1 Workspace . . . . . . . . . . . 3.2 Lexical Analysis . . . . . . . . . . . . 3.2.1 Introduction . . . . . . . . . . 3.2.2 Lexical Analysis . . . . . . . . 3.3 Syntactical Analysis . . . . . . . . . 3.4 Type Checking . . . . . . . . . . . .
32 34 34 34 35 36 38 38 41 41 49
. . . . . . .
56 56 56 58 58 59 60 64
. . . . . .
66 66 67 69 72 73 74
5 Future Work and Conclusion 5.1 Conclusion . . . . . . . . . . . . . . . . . . . . . . . . . . . . . . . 5.2 Future Work . . . . . . . . . . . . . . . . . . . . . . . . . . . . . .
77 77 79
. . . . . . .
. . . . . . .
. . . . . . .
. . . . . . .
. . . . . . .
. . . . . . .
. . . . . . .
. . . . . . .
. . . . . . .
. . . . . . .
4 Compilation and Distributed Processing Framework 4.1 Introduction of the Execution Model . . . . . . . . . . 4.2 Compilation process . . . . . . . . . . . . . . . . . . . 4.3 Implementation of Distributed Processing Framework . 4.4 Java Advanced Imaging (JAI) . . . . . . . . . . . . . . 4.5 Java RMI and JAI . . . . . . . . . . . . . . . . . . . . 4.6 RMI vs Sockets . . . . . . . . . . . . . . . . . . . . . .
5
. . . . . . .
. . . . . .
. . . . . . .
. . . . . .
. . . . . . .
. . . . . .
. . . . . . .
. . . . . .
. . . . . . .
. . . . . .
List of Figures 1.1 Image operator graph in JAI . . . . . . . 1.2 Example of a simple dataflow diagram of sion 1*2+3*4 . . . . . . . . . . . . . . . 1.3 Screen shot of Cantata . . . . . . . . . .
. . . . . expres. . . . . . . . . .
10
31 31 33 33 34 35 35 36 37 38 45 45
2.14 2.15 2.16 2.17 2.18
General syntax of a function node . . . . . . . . . . . . . . . . . . Example of a small dataflow program that divides 8 by 2 . . . . . Switch control structure . . . . . . . . . . . . . . . . . . . . . . . If-else control node . . . . . . . . . . . . . . . . . . . . . . . . . . Case control node . . . . . . . . . . . . . . . . . . . . . . . . . . . Selector control node . . . . . . . . . . . . . . . . . . . . . . . . . The clone operator . . . . . . . . . . . . . . . . . . . . . . . . . . Get and Set operators . . . . . . . . . . . . . . . . . . . . . . . . Simulating iteration with recursion . . . . . . . . . . . . . . . . . Initial call to recursive function that simulates iteration . . . . . . UML class diagram for GeoGenericMultiBandImage . . . . . . . . UML inheritance diagram for format specific classes . . . . . . . . Separating the task of reading and writing to a specific file and the data representation . . . . . . . . . . . . . . . . . . . . . . . . . . UML diagram for geo-image file-specific factory design . . . . . . Simple dataflow diagram . . . . . . . . . . . . . . . . . . . . . . . Centralised exception model . . . . . . . . . . . . . . . . . . . . . Isomorphic exception model . . . . . . . . . . . . . . . . . . . . . Hierarchial control plane . . . . . . . . . . . . . . . . . . . . . . .
3.1 3.2
Screen dump of our visual programming environment . . . . . . . Compilation process for textual languages . . . . . . . . . . . . .
57 59
2.1 2.2 2.3 2.4 2.5 2.6 2.7 2.8 2.9 2.10 2.11 2.12 2.13
6
. . . . . . . . . the arithemetic . . . . . . . . . . . . . . . . . .
15 22
46 47 50 51 53 54
3.3 Transition diagram adapted from [50] . . . . . . . . 3.4 Toy example . . . . . . . . . . . . . . . . . . . . . . 3.5 Graph program to illustrate parsing . . . . . . . . . 3.6 Graph in Figure 3.5 with symmetric adjancency set
. . . .
. . . .
. . . .
. . . .
. . . .
. . . .
. . . .
. . . .
59 62 63 63
4.1 4.2 4.3 4.4
. . . .
. . . .
. . . .
. . . .
. . . .
. . . .
. . . .
. . . .
67 68 72 72
Chain of image operators . . . . . . . . . . . . Mapping from a Node to its Operator . . . . . Compiled form of the program shown in figure Pipeline of JAI operators . . . . . . . . . . . .
7
. . . . 4.1 . .
. . . .
List of Tables 4.1
Experimental results. . . . . . . . . . . . . . . . . . . . . . . . . .
8
76
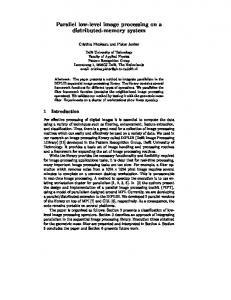
Chapter 1 Introduction The purpose of this honours project is to develop a framework for distributed processing of images. In particular, to develop a visual programming language (VPL) that allows users to create programs that can be executed in a distributed environment. Motivation for the project arose from the development of a geospatial image (geo-image) server by the Distributed and High Performance Computing (DHPC) group [42] with the Defense Science and Technology Organization (DSTO). The server, known as the On-Line Geospatial Archive Server (OLGAS), enables remote users to search for and download geo-spatial images. The focus of recent work was to extend the functionality of the server to allow image processing capabilities in addition to accessing geo-images. For example, a user may specify a particular image and then a set of image processing operations to be carried out on the image. The server would then retrieve the raw image from some local high capacity storage facility such as a tape silo or RAID and then process the image before returning the final product. The image processing may be computationally intensive and therefore suitable to distributed processing. To process the images, the Java Advanced Imaging (JAI) [22] class library is used. An important feature of JAI is the ability to create complex series of operations by chaining together image operations into a directed acyclic graph (DAG). For example, consider figure 1.1 which depicts a simple process graph. As can be seen, a tool that can build such ‘programs’ would be useful in aiding users to quickly and easily specify the operations they wish to perform. To construct a program, the user could drag and drop operations onto a work space and connect them together with arrows that represent data flow. 9
Image 1
Image 2
WarpOp
EdgeOp
AddOp
Final Image
Figure 1.1: Image operator graph in JAI Figure 1.1 indicates that operators WarpOp and EdgeOp can be performed in parallel. That is, WarpOp could process Image 1 on one machine and EdgeOp process Image 2 on another, with AddOp possibly performed on yet another machine and the final image returned to a client on a remote machine. The development of a distributed processing infrastructure that can handle distributed processes is the final aspect of the project. We used Java as our development programming language and we examined the performance and functionality of the two distribution technologies available: Java sockets and Java RMI. For the rest of this introductory chapter we introduce the background ideas and work on which this project is centred and discuss relevant work that has previously been done. The chapter is broken down into six sections. The first section discusses distributing computing and how it can be used for the processing of images. The next section discusses the dataflow paradigm. The third section is an introduction to visual programming languages and the fourth section is a survey on dataflow visual languages that have been developed for image processing. Section five briefly surveys VPLs for the development of parallel programs. In the final section, we discuss in detail the aims and specifications of this project.
10
1.1
Distributed Computing
1.1.1
Introduction
Distributed computing refers to solving a computational task over a set of physically distributed machines connected together by some network. The reasons for building a distributed application are many. The following is a list of some of the benefits and reasons [1,2,3]. 1. Performance For a single sequential processor there is a limit to the level of performance that can be achieved. To achieve greater performance one can either purchase a more powerful machine or add one or more machines and spread the work over all of them. However, this is only possible if the problem can be decomposed into smaller parts and then computed in parallel. As a general rule, the communication costs grow in direct proportion to the number of processors thrown at a problem. Thus attempts to sub-divide a problem further and use more processors may actually degrade performance rather than improve. This relationship can be expressed by the following equation which is a modification of Amdahl’s law [26,27]. 1 1 1 = + Sp P rp
(1.1)
where Sp is the speedup, P the number of processors and rp is the ratio of computation-to-communication costs. Equation 1.1 is a simplification of Amdahl’s equation as it assumes that the problem has no serial component and is an embarrassingly parallel problem i.e. a problem that can completely broken up into an arbitrary number of tasks. The computational size of the tasks is referred to as the granularity. As it can be seen, it would be preferable to have rp as large as possible. Large rp can be achieved with low latency or high bandwidth, or with the computation of the tasks large enough to overshadow the communication overhead. Thus for any parallel solution, the characteristics of the hardware and the problem need to be considered when attempting to achieve greater perfor11
mance. For many distributed applications where the both the bandwidth and latency is low, the granularity must be large as possible so that rp is large as possible. 2. Resource Sharing Data and resources are typically distributed. Computational resources and data resources such as supercomputers, databases and image archives are rarely found in the same location, let alone together on a single machine. 3. Elegance Many problems can be naturally solved with a distributed system. For example, some problems exhibit data parallelism and thus can be solved in parallel. The image processing example shown in figure 1.1 exhibits such data parallelism – the operators WarpOp and EdgeOp are data independent since they operate on different sets of data. However, the operator AddOp is data dependent. Notice that the graph structure naturally reveals data-parallelism – no reordering or pre-processing is required to obtain a parallelized form.
1.1.2
Developing distributed applications
Developing distributed applications is a notoriously difficult task. The developer of a distributed application is faced with many complexities that don’t exist in developing a standalone application. If we recall from the previous section, one of the reasons for building distributed applications is to make use of distributed data and computational resources. The separation between access of data and processing of data is an important issue. Repositories of data are static in that they are housed in well defined locations and require remote access. Therefore, in building a distributed application, we need to locate the data and then retrieve it. Data can be accessed explicitly using ftp (file transfer protocol), http (hypertext transmission protocol) or any other data transferring protocol to ferry the data to some other location for processing. Such explicit retrieval is considered to be cumbersome and for some cases it is possible to use a Network File System (NFS) to transparently represent local and remote data. However, NFS is limited to smaller local area networks (LANs) as it it does not scale well over machines connected with networks of low bandwidth and high latency. Current mechanisms 12
available to programmers to access remote data are typically explicit. It would be far more desirable if the location and access of data could be made more transparent. To develop an application that distributes the computation, we are faced with a similar problem; namely, the allocation of work to processing nodes needs to be done explicitly. Current distributed programming technologies include Java RMI [4], Remote Procedure Call (RPC) [29], Message Passing Interface (MPI) [30], PVM [33] and CORBA [5]. With each of these, the programmer needs to explicitly specify on which machine work is to be done, along with what is to be done. Clearly, this makes the task of writing a distributed application far more complicated and also modification and reconfiguration costly as the dynamics of the system change.
1.1.3
Image Servers
The efficient access and handling of large archives of digital image data of different formats is a challenging problem. In recent years the amount of digital image data produced has grown rapidly. For example, vast amounts of data is collected from earth observation satellites and aerial photography. The increase in availability has corresponded with an increase in their use for Geographical Information System (GIS) applications and areas such as environment policy making, agriculture, land management, mining and defense [7]. There have been many projects that have built on-line interfaces to digital libraries of geospatial images. Projects such as the Synthetic Aperture Radar Atlas (SARA) at Caltech [8,9]; Microsoft’s commercial web interface to satellite and aerial image archive (Terraserver) [10]; ERIC [11,12]; NASA’s Earth Observing System Data and Information System (EOSDIS) [13]; the Australian Centre for Remote Sensing (ACRES) digital Catalogue [14]; and On-Line Geospatial image Archive Server (OLGAS) [15]. These archives are broadly classified as “conventional data archives” since the data available is passive and a user may only retrieve data that is available – there is no additional functionality to allow user requested processing. Current focus of research is examining how these types of repositories can be integrated into wider applications. For example, developing well defined standards and specifications for interfacing to interoperable distributed geospatial image archives [7]. 13
With the exception of the OLGAS image server, all the above projects, all have been built with their own propriety interface – not to a standard interface that would allow other application programs to interoperate with it. However, in recent years there have been a concerted effort by various government agencies, academic and industry groups to formulate standardized interfaces to the remote access of geodata and geoprocessing resources. The U.S. National Imagery and Mapping Agency (NIMA) [16] has drafted standards and specifications for the U.S. Imagery and Geospatial Information System (USIGS) [17,18] for the use by the U.S. intelligence and defense forces. The USIGS specification is made of a number of components, with the fundamental one being the Geospatial and Imagery Access Services (GIAS) specification [19]. The GIAS specification defines a standard interface to distributed libraries and provides standardized services for the ingestion, querying and downloading of geospatial data.
1.2
Dataflow for distributed computation
The dataflow model [31,32,34] represents computation as a directed graph where nodes in the graph represent data operations and the edges represent the flow of data or tokens. The data is active and flows asynchronously through the graph, activating each operator when all the required input data has arrived. A dataflow model is said to be static if only one token per arc in the dataflow graph is allowed and dynamic if each token is tagged and stored at a shared location. A static dataflow model better represents the dataflow model adapted to a distributed processing context. That is, each operator could reside on a machine connected together by a network, with an edge representing the network connection – it is only possible for a single token to be transported per edge. However, the model can be generalized by assuming the arcs are first-in-first-out (FIFO) queues of unbounded capacity [35]. To illustrate the dataflow model, consider the acyclic dataflow program shown in figure 1.2, which depicts the arithmetic expression 1*2 + 3*4. An important and powerful feature of the dataflow approach is the ability to explicitly reveal data dependencies between operations. In figure 1.2, the operations 1*2 and 3*4 can clearly be performed in parallel – the graph naturally expresses parallelism visually. Since the program is represented by a directed
14
1
2
3
*
4
*
+
Figure 1.2: Example of a simple dataflow diagram of the arithemetic expression 1*2+3*4 acyclic graph, the program shall always terminate. Another important feature is explicit determinacy. That is, results do not depend on the relative order in which potentially parallel nodes execute. Therefore there is no need for synchronization of concurrent processes.
1.3 1.3.1
Visual Programming Languages Introduction
The primary motivation for the development of VPLs is to avoid the necessity of translating visual ideas into artificial textual representations [20]. That is, the visual representations and constructs provide a more natural view to the programmer during the programming process. The term visual programming is commonly misunderstood and confused with visual programming environments (VPEs). With a visual programming language (VPL), the programmer develops programs using visual expressions such as drawings, arrows, icons and other graphics. There exists a visual syntax and semantics of the language may be defined in more than one dimension. The important characteristic of VPLs is that the programmer creates a program visually as visual expressions and subsequently debugs and executes the program in the same visual environment. The programmer does not need to modify any textual representation that may be the interim form of the program. Of course, the visual program
15
may be stored to a file in some textual form, but the program is compiled directly and not to an interim textual language and then compiled by the user. In contrast, VPEs simply provide a convenient way to rapidly develop programs whose underlying form is textual. Many commercial VPEs available are graphical GUI builders that allow the GUI aspect of development to be completed quickly, however the programmer still needs to edit text files to define new objects and their behaviour. Examples of VPEs include Microsoft’s Visual Basic and Visual C++. VPEs are classified as being in the middle ground between pure VPL and traditional textual languages. The common ground between VPLs and VPEs is that to program in a VPL you need a visual programming environment. The VPE for visual programming language is the visual editor from which the programmer may create, modify and compile visual programs - similar to a text editor for a text based languages. The environment typically consists of a set of tools and a user interface from which visual objects are manipulated.
1.3.2
Advantages of VPLs
The development of visual programming languages was motivated by a desire to provide a different conceptual framework in the programming process. Traditional text based languages are found to be difficult to program in and to learn since they require the programmer to take an algorithm that has been developed visually and map it to a sequential form using the appropriate data and control mechanisms available. A visual programming language provides a direct and natural relationship between the data and computation. That is, the language enables the programmer to better express program logic and how it works. This feature allows the programmer to concentrate on finding a solution to the problem and less time concerning how the solution will look in some programming language. VPLs try and offer some, if not all, of the following four advantages [21]: 1. Fewer programming concepts The programmer is shielded from programming issues such as pointers, storage allocation, declarations, scope or variables.
16
2. Concrete programming process The programming process is more concrete because of the ability to see and manipulate objects and view how they interact. The visual representation is more than likely to mirror the actual form of the data and how the data is going to be operated on. 3. Explicit depiction of relationships The visual representation explicitly indicate the relationships between different objects. For example, a dataflow visual language depicts the paths of data to operators with arrows. 4. Immediate visual feedback When some aspect of the program is edited, changes are immediately made to the appearance of the program, including the consequences of the changes. For example, the programmer may update a data value or modify a formula which may in turn cause anything dependent to be reevaluated. Such immediate visual feedback may be familiar to users of spreadsheets that allow dependent objects such as graphs and formulas to reevaluate on changes to data. The level of immediacy is referred to as ‘liveness’ [23]. There are four levels of liveness with level 1 being no feedback and level 4 with complete feedback on all actions. Level 1 liveness is what a programmer writing with a text editor in a traditional textual language would experience. At level 2 the programmer would receive some delayed semantic feedback about a portion of a program. At level 3, the programmer is provided with incremental semantic feedback as the program is written. Computational changes may be made after the edit is made as in a spreadsheet. Finally at level 4, there exists not only semantic feedback but changes may affect the current state of a evolving computation that is in progress. Level 4 liveness would correspond to changing the input parameters to, say, a simulation that is in progress.
1.3.3
Design Issues with VPLs
When designing a traditional textual language, the designer is faced with numerous language design issues. One important design aspect is the size of the language. Although there exists no precise definition, the size of the language 17
is often related to its complexity and built-in features it offers. Most languages provide a core set of primitive features that can be used to create more complex features. For example, basic data structures and control structures may be provided, but they are not usually modifiable. The syntax is fixed and if some feature doesn’t exist that cannot be created with existing features, then it is not available. However, if one of the design goals is to maximize utility, then this not only increases the size of the language but also adds to the complexity of the compiler. The ideal middleground between simplicity and feature-rich is hard to determine: too simple a language may not be powerful enough to express a variety of actions. A related issue is flexibility. Flexibility refers to absence of restriction and while this has it advantages, it can also lead to poor programming practices and unreadable code. For example, the C programming language is recognized as a very flexible language that allows statements with mismatches of semantically similar types and mechanisms such as pointers. However such lack of restriction sometimes produces incredibly obfuscated code and increases the likelihood of unforeseen errors. In contrast, Ada [36] provides greater restriction. For example, it is a strictly typed language and prohibits features such as explicit address manipulation and unrestricted indexing of arrays. Other design issues may include [24]: • Paradigm. Shall we design a procedural, functional or object-oriented language? Most languages are more or less fundamentally alike and choice of paradigm is largely determined by reasons such as the target application domain, compiler complexity, etc. For example, some functional languages are better suited to list processing such as Lisp. • Semantic clarity. Do the semantics of the language lead to programs that have expressions that are unambiguous? • Modeling ability. Does the language provide features that help the programmer to model a problem more fully, more precisely or more easily? • Readability and convenience. Does a particular feature aid in writing less code and does it provide a clear idea of its intent?
18
The designer of a visual programming language is faced with the same design issues as a designer of a textual language. However the designer is also burdened with further design issues since the syntax and semantics of a visual language may be multi-dimensional. There is a potential of including features that may negate the advantages of visual programming. For example, while a visual representation may communicate more information than a textual equivalent, a representation that crowds the real estate of the screen has the opposite effect. The screen is a finite space and its utilization must be carefully managed. To illustrate this, imagine a large dataflow program that consists of many function nodes that are linked together by arrows. On the screen the program may appear as a distorted mesh with arrows crossing over each other. Such a program is harsh on the eye and hard to understand. A possible solution to over-crowding is for the programming environment to allow zooming in and out and scrolling. But this may not avoid the problem of visual complexity and there is a limit to the amount of zooming out before objects become too small. A better solution is to use something that is hard to imagine without in a textual language – procedural abstraction. By using procedural abstraction, a set of tasks can be grouped together to form a procedure that encapsulates the subtask details. For example, with our messy data-flow program we could select and iconify a section of code. This not only frees-up space on the screen but also makes the language more scalable; that is, large programs can be written. The procedure that is formed can also be reused by adding it to a library of procedures that the programmer has constructed.
1.3.4
Typing
The notion of type is an essential part of modern programming languages. The syntax of a language defines how a program may be written, while types assist in conveying the semantic intent of an expression. To the computer a data object is simply a meaningless binary string. A programmer does not view the data in this way but by its type. The design of a language type system and its associated type policies play a crucial role in a language’s flexibility and power. The type checking process is used to detect semantic errors such as operand incompatibility and incorrect application of functions. Type checking can be performed in three ways. Firstly, statically with distinct types, dynamically 19
and finally, statically with implicit types. Static type checking with explicit types is the method commonly used by traditional textual languages such as C and Ada. All objects are given explicit types and detection of type incorrect programs occur at compilation. The disadvantage of this approach is that it requires the programmer to specify the type of all objects and is not suited to polymorphism, which without, a programmer would need replicate the same code to accommodate all new types. Most VPLs use dynamic typing since it achieves flexibility and is easier for programmers. The drawback is lack of immediate feedback. Typing errors are detected at run time and may also not be discovered until after final production. For applications with lengthy computation such as distributed applications, debugging is a frustrating and time consuming process since errors are detected later rather than sooner. Static typing with implicit types is commonly found in functional languages. The language appears to be typeless and data objects do not appear to have a type bound to a particular type. All functions can appear to be applied to any object. When compiling the compiler infers the type of all objects and performs a semantic check on all statements. This approach is preferable as it removes some of the obstacles of efficient programming such as a restrictive type system and replaces it with a simpler type model. Static typing also provides feedback to assist the programmer in debugging.
1.3.5
Categorising Visual Programming Languages
Categorising visual programming languages is a difficult task since many languages share features of many distinct categories. The process of classification is more of identifying particular characteristics that a language exhibits than exactly pigeon-holing it. Visual programming languages can be identified by two broad characteristics [25]. Firstly by the paradigm the language follows. For example, data-flow model for computation, object-oriented, rule-based, functional, imperative, form-based and so on. The other means for identifications is the form of the visual syntax. There are three broad categories by which VPL can be identified by its visual appearance: diagrammatic languages which represent data and functions as graphical objects that are linked together to define some relation; iconic languages that represent objects as drawings or shapes where re20
lations are defined through overlapping; and some languages are based on static pictorial sequences – like a story board. The classification may not only be restrained to the paradigm a language follows or to visual representation. A visual programming language can also be categorized by its design use. Many VPLs are designed with a domain specific role such as image processing or database querying. Other characteristics that may also be considered in additional classification include the way in which the language can be formally classified [26] and features offered.
1.4
Visual Programming Languages for Image Processing
There are several existing visual languages whose intended application domain is image processing. Cantata and AVS are two examples of such visual languages. Cantata [37] is a commercially available VPL that forms part of the Khorus [37] system. The AVS [38] package is used in applications such as data visualisation and image processing. Part of the package includes a VPL-like environment known as the Network Editor, which enables users to construct complex visual programs and interfaces. In this section we shall highlight some of the important and relevant features of Cantata and AVS.
1.4.1
Cantata
Introduction Cantata is a visual data-flow language provided with the software integration system Khorus. It is a language that was originally designed for image processing but has been extended to further areas such as signal processing and for the designing of control systems. A visual program is described by a directed graph where each node represents an operator or function. The directed arcs represent the path over which data flows. The operators are represented by icons known as glyphs. A program is created by dragging and dropping glyphs onto a workspace and joining them into a network. Figure 1.3 shows a screen taken of the Cantata environment.
21
Figure 1.3: Screen shot of Cantata
22
Each glyph has designated input and output connections for data and are represented visually by coloured squares. A yellow colour is shown when a data connection is required and blue when optional. Each glyph also has an input and output control connection so that the execution of a glyph can be delayed before another. This feature is used to view the effects of a sequence of operations. A console button at the bottom of the every glyph indicates error information. If an error is raised during execution, the console turns red. The user can then select the button to bring up a panel with information about the cause of the error. There are several types of glyphs. There are the standard glyphs that represent the various operators that are available within the Khorus environment. Input glyphs provide a user an interface to access data from a file whose format is supported. Control glyphs represent data flow control mechanisms such as selection and iteration. Control constructs The following control constructs are supported: 1. If-Else: diverts data flow onto one of two outgoing paths based on some condition. 2. Merge: forwards data objects onto the single outgoing path from two separate incoming paths. That is, both data objects take the same outgoing path regardless of whether one arrives before the other. 3. Switch: a single object is selected from one of two incoming paths based on some condition. 4. Trigger: acts as a synchronization mechanism. A trigger glyph will delay execution until data has arrived at another glyph. The glyph on which synchronization occurs need not be connected to the dependent glyph. The looping constructs enable repeated execution of an embedded procedure. There are two constructs available: 1. Count loop: The count loop is equivalent to the for loop in many textual languages. It repeats a particular piece of visual code a fixed number of times. A count loop is created by firstly dragging the appropriate glyph 23
from the tool palette. The body of the loop is created by entering the loop workspace and filling it with the code that is to be repeated. To specify the number of iterations, a loop variable, its range and amount it is incremented by on each iteration is entered. This step is done textually. The loop variable is local to the loop body and can be accessed by the loop body only as in some textual languages. 2. While loop: The while loop repeats its body as long as some condition is true. The body of the loop is constructed in almost the same way as the count loop, except a boolean expression is specified for a defined loop variable. Again, this is written in textual form. With both loops, the flow of execution and its control is contained within the glyph. There are no mechanisms available to externally set loop variables or affect some condition. Variables Although Cantata is a data-flow language, it supports the notion of a variable that can be accessed and modified with arithmetic expressions. A variable is declared for a given workspace by defining a name, a data type, and an initial value. The data types available include string, integer, float and double. The expressions are written in textual form and may include built-in or user-defined functions. An expression is calculated and assigned to a variable as part of the control structure or with an expression glyph. Variables defined within a particular procedure or loop are local and can only be used within that procedure or loop, and in any sub-procedures or loops. Procedural abstraction To avoid cluttering the workspace and to promote the development of large programs, Cantata supports procedural abstraction. A procedure is created by rubber banding a collection of glyphs. Once created, the procedure can then be re-used elsewhere.
24
Execution Model The Cantata execution model is neither data-driven or demand driven. A visual program is dynamically interpreted and with each glyph scheduled and dispatched as a separate process. Once a glyph has been scheduled, a dispatcher is responsible for transporting data and the process execution mode. A program begins execution when the user clicks the RUN button. Thus Cantata has a liveness level of two. However, a user may choose responsive mode and the program executes automatically whenever the user edits the program or modifies input data. This corresponds to a liveness level of 3. The execution of glyphs can occur either locally or over a group of heterogeneous machines. To distribute the processing over a network, the user needs to specify a list of hosts that are configured to host the remote execution daemon. To dispatch a particular glyph on a remote machine requires the user to specify for that glyph the location of the execution – localhost by default. When the program is run, the glyph is dispatched and executed on the remote machine. Once finished it returns its data and control to the machine from which it was dispatched.
1.4.2
AVS
The AVS system allows users to dynamically connect modules to create data flow networks. Central to developing program networks is the Network Editor. The Network Editor is a visual programming environment that allows users to visually connect AVS modules. A user may also specify the execution and data model for any program. The AVS modules define fundamental units of computation. Modules process input data and the generated data is passed onto the next module. The modules can represent coarse-grained units of computation. Modules available include a wide range of image processing routines. User defined modules can be incorporated by writing the module in a language such as C or FORTRAN and conforming to the AVS API. AVS operates on a wide number of computing environments and can perform distributed processing over a heterogenous environment. To support heterogenous distributed processing, AVS provides the External Data Representation
25
(XDR) format, so that binary data from different architectures can interoperate. Writing portable user defined modules is difficult since they must not use platform specific routines. Such general implementations may not take advantage of particular hardware capabilities. Distributed processing in AVS is performed using remote procedure calls. A user must specify which modules should be executed in parallel and on what machine. AVS supports two general types: primitive data types such as bytes, integers, floating-point numbers, and aggregate data types. Aggregate data types can be viewed as a struct (using C’s terminology) with any number of fields of different type, including other structs. A user may define their own aggregate data type and read a foreign format into this structure. Modules which receive aggregate data as input must be aware of their structure, i.e. parameter type must be the same. Therefore objects of a user defined aggregate data type can only be used with user defined modules. However, by explicitly extracting the primitive data, existing modules can be used.
1.5
Visual Languages for Parallel Applications
Visual representations of parallel programs are better able to communicate their behaviour than the textual form that it was originally written. Complex interdependencies are obscured by the linear textual description. Writing parallel programs in a text-based language is difficult for the same reason. Thus developing parallel programs visually would aid a programmer with implementation of their program. There exist numerous tools or visual programming environments designed for the development of parallel and distributed applications. In this section we briefly survey the systems: HeNCE, CODE and Meander.
1.5.1
HeNCE
HeNCE [39] is targeted at building programs for heterogenous systems. It is a PVM based tool that enables users to construct graphs of coarse-grained parallel PVM tasks. The graphs indicate control flow and the nodes fire when all predecessors have fired. HeNCE uses a shared name model: two or more nodes can access the same variable. The problem with HeNCE is that it fails to graphically 26
display the communication between nodes (tasks) since the graph shows control flow and not dataflow.
1.5.2
CODE
CODE [40] produces directed graph-based programs that depict dataflow between nodes of sequential programs. It also supports shared variables. A node fires when the programmer-supplied firing rules are satisfied. However, the nodes generally fire when the data on all incoming arcs are present. Features of note included procedural abstraction and the allowing of cycles.
1.5.3
Meander
Meander [41] is more of a development environment rather than a visual language. The sequential components are implemented using ANSI-C, while the parallel aspects such as communication are expressed as a graph known as a specification graph. The specification graph describes the relationship between processes with the edges indicating communication of either data or control. There exists three types of edges: causal, sync and async. causal depicts the order in which processes can execute, sync and async represent synchronous and asynchronous data flow, respectively.
1.6
Summary of project
We wish to develop a dataflow visual programming language that can be used to write image processing programs. The dataflow model of computation was chosen for the following reasons: • Dataflow graphs can be constructed by chaining JAI operators • Image processing operations resemble dataflow behaviour; that is, as soon as images become available, they are consumed, operated on and passed onto the next operator. • Shared variables don’t exist and hence no need to be concerned with sideeffects.
27
• The result is not dependent on the order in which the graph is executed and hence here is no need for synchronization of concurrent processes. • Dataflow graphs naturally reveal potential parallel behaviour. Distributed programs are inherently complex. A programmers mental view of a distributed program is multi-dimensional and reflects how it behaves when executing in the physical environment. That is, the relationship between processes on different machines and flow of data is multi-dimensional. Therefore it is natural to develop programs in a visual environment than in a textual form. The advantages of VPLs in parallel programming include: • The behaviour of the program maps to a visual representation and hence is easier to understand. • Less effort required to write parallel programs visually since there is no need to translate the programmer’s mental visual representation to a linear text-based form. • More accessible to non-programmers. • Provides a basis from which parallelism can be exploited. Our VPL is to provide a concise set of features but without making it overcomplex. This can be achieved through defining well defined interfaces that allow users the potential to extend the definition of the language. Control flow structures such as if-else, case and switch shall also be included – it will not be just a dataflow language where data flows through a graph of image processing operators. Execution times in distributed computation are typically high and run-time errors can be costly. To avoid such problems, the VPL needs to be strongly typed so that as many potential errors are detected as early as possible. Similar to text-based languages, we need to write a lexical analyzer, parser and semantic analyzer. To ensure against over-crowding of the workspace and scalability, our VPL needs to support procedural abstraction. A strategy needs to be developed for communicating and handling exceptions in a distributed system. Exceptions and their handling is an important feature 28
in many sequential textual languages to catch and deal with abnormal run-time errors. Communication of exceptions in a distributed system is complicated by having a set of concurrent processes on machines that are physically separated by a network with possibly high latency. When an exception occurs at a node in our program graph, we need mechanisms to communicate to other active processes of the exception, so that we can abort the entire program as soon as possible. The final project requirement is to develop the distributed processing framework. Once the user has developed their program, the data and code is transported to remote severs and executed, and then the final image is returned. There exist a number of VPLs designed for parallel or distributed processing. Cantata and AVS offer many of the above features. However both Cantata and AVS do not properly support geo-images and the incorporation of new geospatial formats. Both AVS and Cantata of provide limited distributed processing facilities. Cantata is restricted to homogeneous machines. AVS allows heterogenous distributed processing, however porting new AVS modules is difficult and cumbersome because they are typically written in imperative languages such as C or FORTRAN, which do not port well. CODE and Meander VPLs are targeted at developing fine-grained programs for tightly coupled parallel machines and therefore the visual constructs available are not suited to coarse grained distributed programs. HeNCE uses a shared name model and programs depict control flow, thus is not suitable for distributed image processing where programs specify data flow. Our framework is developed in Java and therefore portable to all machines which support a Java virtual machine. We develop a flexible distributed processing framework that would allow greater experimentation with different policies such as dynamic load balancing, granularity and job placement. Finally, our environment can be integrated with an image server (OLGAS) that conforms to a well defined specification.
29
Chapter 2 Dataflow Visual Programming Language In this chapter we introduce the syntax and semantics of our dataflow visual programming language.
2.1
Introduction
Our dataflow VPL allows a user to develop a graphical representation of a dataflow program which can be directly executable. Much of the syntax and features have been borrowed and adapted from AVS and Cantata. The structure of all our visual language program is a directed acyclic graph (DAG). A program may not be disconnected. That is, a program cannot consist of two or more separate graphs – there can only a single program graph. The language consists of three types of nodes: function operators, control operators and input/output data portals. Arcs represent the path of data objects (commonly referred to as tokens). We represent functions as a square with an arbitrary number of arcs incident to the node to represent the input parameters (see figure 2.1) and a single output. The input arcs are uniquely labelled so that the incoming data can be bound to the appropriate parameter. The function node is labelled f i and is executed (fired) when all incoming the arguments become available on the incoming arcs. When the function fires, it consumes the incoming data objects and produces a single data object on the outgoing arc. 30
1 2
f
i
n
Figure 2.1: General syntax of a function node
8
1
div
2
Output Portal
2
Figure 2.2: Example of a small dataflow program that divides 8 by 2 The data input/output portals are also visually represented as squares. Input data portals enable literal data to be entered or a filename of an image file. Visually an input data portal may appear as a buffer to a function node, however the data object is “executed” as soon as the data object that it represents becomes available and passed to the function node. An input data portal has no in arcs and only a single out arc. Output portals define a return point to the environment. An output data portal consists of a single in arc and no out going arc. To illustrate input and output data portals and some of the other features, consider the example in Figure 2.2. In this simple example, the data object representing the integer 8 is divided by the integer 2. These data objects are introduced through an input data portal. The function div requires two parameters: a numerator and denominator. These parameters are bound to their values with arc labels 1 and 2 – 1 for the denominator and 2 for the numerator. The result returned from the function is passed to the output data portal whereby the user can view it. For distributed applications, the output data portal is bound to a particular port number of the local machine – see chapter 4 for further details. As seen by this simple example, the dataflow model relieves the user from many of the problems that are encountered when writing a distributed program
31
such as synchronization and determinacy. Operations are performed on the data as they arrive and the resulting data is forwarded onto the next operation. Designing a program is very simple and intuitive. A user merely needs to specify data sources and link together a chain of function nodes to achieve the actions they wish. Since dataflow languages are purely data driven, the language is not burdened down with complexities of variables, which introduce problems, such as scoping, in applications of functions and variable declarations.
2.2
Control Structures
Since our visual language follows the dataflow paradigm, the control structures are concerned with diverting or selecting the flow of incoming data objects. Our VPL has four predefined control structures: if-else, case, selector and the switch node.
2.2.1
Switch
The switch control structure operates like a 2-way valve. The node receives three parameters: a boolean and two data objects (see figure 2.3). If the boolean object is true then the data object on the incident edge labelled T (i.e. a) is directed out of the node; otherwise if false, then the object on F edge (i.e. b) is sent out. The two parameters must be of the same type. The labels T and F must both be present.
2.2.2
If-Else
Similar to its textual equivalent, the if-else node directs an object to two different paths based on a boolean value. Consider figure 2.4. If the boolean parameter is true, then the data object a is directed onto the edge labelled T; otherwise if false, then it goes on edge labelled F. The labelled edges are required.
2.2.3
Case
Again, similar to its textual counter part, the case node routes a single data object down a particular out-going edge according to an integer value (see figure
32
a T
boolean
11111 00000 11111 00000 F
b
Figure 2.3: Switch control structure
boolean
T if-else
a
F
Figure 2.4: If-else control node
33
integer
1
c
2 case
a
n
Figure 2.5: Case control node 2.5). The incoming edge for the case must be labelled c to distinguish the case parameter from the incoming data object that is going to be directed. The integer value passed to the case parameter is indirectly mapped to a labelled outgoing path. That is, the user specifies a given value or range of values the case parameter may have and this corresponds to the data object taking a particular out-going path.
2.2.4
Selector
The selector control node receives two or more incoming data objects and forwards on a single one based on some integer value. Consider Figure 2.6 which shows the general form of the selector node. The incoming edge on the top face is similar to the case parameter in the case node - an integer data object with the edge labelled ‘c’. Each incoming data object is mapped to a unique set of integer values. If the ‘case parameter’ falls within a given set, then the data object coming in on the edge with that defined set is passed on. All other data objects are consumed. The node fires when both the case parameter arrives and a data object arrives on the correct edge. If all data objects arrive and the case parameter does not fall within any of the defined sets, then an exception is raised. The data type of the incoming objects must be of the same type.
2.3 2.3.1
Miscellaneous functions Clone
The clone operator produces an exact replica of a data object as well as passing on the original. Consider figure 2.7, the incoming data object and its clone are sent out on two different path. 34
Integer
C
Object 1 Object
2 Selector
Object
Object
n
Figure 2.6: Selector control node Object
Object
Clone Object
Figure 2.7: The clone operator
2.4
Get and Set property operators
To access individual property values of some data object, we define the Get and Set operators (shown in figure 2.8). The Get operator receives a property name and data object which has the property as parameters. The edge on which the property name is received is labelled ‘P’. If the data object does not have the property given, an exception is raised. Exiting the node is the original object data and the property value. Again, the edge taken by the property value is distinguished by the edge label ‘g’. The Set operator allows a particular property of a data object to be modified. The two parameters are the property name and the data object that is to be modified. The output is the updated data object. At first glance, these operators appear to violate the pure dataflow model since they introduce the notation of state within data objects and therefore can be viewed as global variables that can be modified. However this is an incorrect view. The semantics of the dataflow model suggest that the incoming tokens are consumed and new data is produced. Thus the issue of side-effects is avoided.
35
Propert name
Property object Object
Object
P
P
Get
Set
g
Object
Property object
Object
Figure 2.8: Get and Set operators
2.5
Control Loops and Iteration
For a dataflow visual language to be powerful, it is necessary to support iteration Hils [43] . Iteration enables programs to be more compact, especially when applying a group of operations over a large set of data. For the processing of images, loops are used in two ways: looping over a set of pixels and looping over one or more images. Pixel level operations are fine grained and such operations can be generally be performed internally by a single operator. The dataflow VPL described is concerned with operations on sets of images or repeated application of an operatot on a single image. However, our language definition stipulates that a program must be a directed acyclic graph. Loops violate this condition and thus have not been included in the definition of the language. Loops can be artificially created by unrolling. However this is assuming the programmer knows how many iterations are to occur. Unrolling also increases the size and readability of the code. The problem is that control loop do not fit with the dataflow model since they are concerned with control of program flow as oppose to dataflow. VPLs that have included looping features avoid these problems by defining self contained loop operators. For example, Cantata’s count and while loop specify a loop control body that is a dataflow diagram and the control side is achieved separately. A programmer is unable to create an indeterminate loop that is
36
IN integer object
clone
< 10
boolean if-else
1
ADD
T OP
F
foo
OUT
Figure 2.9: Simulating iteration with recursion dependent on that data its body is operating upon. The feature is more of a convenience mechanism. However, we can simulate loops with recursion [31,34]. Consider figure 2.9. Imagine that we want to the operator OP on a data object 10 times. We define our own function (shown as foo in figure 2.9) and then within it’s body we call itself. foo takes two parameters: the data object which is to be operated and an integer value that records the number of recursive calls. On every call of foo, the integer value is checked to see if it is less than 10 and incremented by 1. While the integer value is less than 10, the data object is directed to the OP operator and then passed again to foo. On the tenth call of foo, the data object breaks out of the recursion. Figure 2.10 shows how the recursive function is initially called.
37
Object 0
foo
Object
Figure 2.10: Initial call to recursive function that simulates iteration
2.6
Type System
The purpose of this first sub-section is to introduce some basic type theory and various issues related to designing a type system. Its inclusion is due to the common design issues between textual and visual languages. The balk of what is described is a condensed form of relevant parts of chapters 1, 2, 14 and 15 of [24]. The author suggests the reader skip this first sub-section if they are familiar with basic type concepts in textual languages.
2.6.1
Overview of typing and type checking issues in textual languages
A data type can be considered to be some abstraction which has an associated description of a set of properties. These properties or attributes define the physical and semantic meaning of an object of a particular type. The properties are independent of any specific instance of an object and typically describe the objects encoding, size and structure. The encoding property tells us how the data is transformed or represented in binary; the size usually refers to the size of the object in bits; and the structure property indicates whether or not it is a simple object with no subparts (e.g. integer) or a compound object such as an array or a record. All this information is stored in what is referred to as a type object. A type object consists of three components: a name, a type and a body of in38
formation. The name is obviously the name by which we refer to this type, the type of a type indicates how to interpret the body of information, and the body of information tells us to how to interpret objects of that type. For example, the common 16-bit integer type would have in its type object something like: integer, primitive type, size = 16 bits and uses twos complements representation. An array or record type would include the name, compound type, number of elements, overall size and element size(s). Objects are said to be a member of a domain if the objects share common physical properties and semantic properties, such as encoding and intent, with other objects in the domain. In most languages, the type name is used to define domain membership and thus each domain has a membership size of one. However it is not as simple as it appears since there may not be a one-to-one relationship between type names and distinct domains. What we consider to be important is the role of the notion of type in clarifying the semantics of statements. In earlier languages, a type name was simply a shorthand notation for its type description i.e. its physical description, just so the compiler could allocate the appropriate amount of memory. In modern languages the type description is almost irrelevant. The type name is used by the compiler to not only differentiate objects but also to assist the programmer in achieving semantic validity. That is, to give meaning to the possible operations that are available. To emphasize the point further, consider how the C programming language treats integers and characters. C views integers and characters as being in the same internal domain, while the programmers views them in separate external domains. Internal domains define distinct types that are recognized and maintained by the compiler. External domains consist of the distinct domains seen by the programmer. Integers and characters are both internally represented as integers. Since according to the C compiler they are viewed as members of the same domain, it is possible to operate on a character as an integer in arithmetic operation. From the programmers perspective this appears to be semantically invalid. The effect is of course a calculation that produces an erroneous result. C allows allows this because it was designed to be used as a system programming language that valued simplicity and flexibility rather than supporting semantic validity. Type checking is kept to a minimum. When writing C programs, a programmer shall more than likely encounter more semantic errors since the compiler has no way
39
of distinguishing objects in distinct external domains if their internal domains are the same. Thus, the compiler is unable to assist the programmer in avoiding unintended and meaningless operations. In contrast, the Ada programming language is known as a strongly-typed language. Each type name defines a clear and unambiguous semantic entity. The advantages of strongly typed languages are that they are easier to learn and use, and a compiler that supports full type checking is a powerful aid in locating semantic errors. Ada also refines the notion of type further by allowing the user to define their own domain which is then considered to be distinct. This helps to further achieve semantic validity. User defined domains (types) can be formed by either defining a completely new type description or by extending an existing domain. Extending an existing domain is known as domain mapping. Elements of an existing domain are mapped into the new domain. This results in two domains with a common implementation but with dissimilar semantic intent. For example, consider the following type declarations. type MinorsAge is new integer range 0..17; type AdultsAge is new integer range 18..120; Types MinorsAge and AdultsAge are considered to be semantically distinct from each other (and from integer) even though they are structurally similar. Completely new types are formed by either combining elements from existing types into a new structure or listing all its members. For example, an enumerated type declaration such as type Fruit is (apple,banana,pear,orange); produces a clearly distinct domain. The keyword type is known as a type constructor. Since Ada is a strongly typed language, a domain created by the type constructor is considered to be dependent and therefore incompatible with all domains. While this facilitates better semantic validity, it means that no functions can be applied to objects from a particular domain unless they have been explicitly defined for that domain. Thus for newly defined types there are no basic functions are available to use. There are two alternatives solutions to this problem. The 40
design could incorporate within the language extensive type checking and compatibility rules or provide type casting that allows types created from domain mapping to be converted to the parent domain. The first alternative is undesirable since it adds further complexity to the definition of the language and requires the programmer to learn all the compatibility rules. Type casting is only suitable for translations between domain mapped types and their parent domains, and between semantically similar objects such as integer and real numbers. However such mechanisms can only be applied to objects that are a member of an internal domain. Type casting between external domains is not possible since they are user defined and therefore the compiler is unable to handle the conversion.
2.6.2
Image representation and typing in AVS and Cantata
Both AVS and Cantata support a number of commonly used image file formats. However neither associate type with different types of images. Each defines an abstract data object which abstracts over the internal implementation. An API (know as the DataService API in Cantata) is provided to enable new formats to be integrated. However, their approach assumes their own universal datamodel and therefore the APIs provided are not well defined for supporting all kinds of geo-images. Therefore formats with metadata properties that do not map to the existing datamodel cannot be supported. New formats can be created in AVS by defining a new datamodel, but they cannot be used easily with existing image operators because they are user defined and thus not recognized by AVS. By defining a universal datamodel for their supported images, there is no need to associate type with any image.
2.6.3
Geo-image representation and Typing
The specific application of this visual programming language is in the processing of images, in particular satellite and aerial images. Since the chosen programming paradigm is dataflow, the data tokens being passed around should represent images. In our design we therefore need some way to represent image data and to introduce the notion of type. Typing is necessary to prevent incorrect application of operations to some data of different format. For example, a program may use 41
a particular property field that is unique to that format in a calculation. The image the data of the geo-images is still simply pixels, it’s just that they have associated meta-data that is unique to that format. But we still want to be able to reuse all the image operators since they work on just the pixels. Most languages support a set of primitive types. The decision to implement a particular type is usually determined by hardware characteristics and the intended use of the language. A language designer must decide to include or exclude a type as primitive by considering the cost of implementation versus its expected usefulness. A language that attempts to support every possible useful data representation would be immense and unwieldy. For every new primitive there needs to be ways for representing literals, inclusion of input and output routines as well as basic primitive functions such as relational and arithmetic operators. The cost of omitting a primitive type is inefficiency. Operations on primitive types execute significantly faster than user-defined types. Many of the primitive functions and routines cannot be extended to all user defined types. If these functions can’t be extended, then a user defined type can never be as convenient or easy to use as a primitive type. Our VPL domain specific application means that including a image primitive type would appear to be a sensible design choice. However the problem is that not all geo-spatial images that represent geo-spatial data are the same. There exists a large number of different formats for storing geo-spatial data. Each format defines its own meta-data schema or datamodel and how to interpret the raw data. Such file formats include the National Imagery Transfer Format (NITF) [44], HDF [45], Band Interleaved by Line (BIL) format, GeoTiff and many other proprietary formats used in GIS programs. The nature of the data being stored may also be different e.g. infra-read (IR), visual, ultra-violet (UV), rainfall and population density, and thus the actual data may not represent an actual image. The data is interpreted into an image representation. The metadata are properties which describe the associated data. These properties may include fields for image size, date information, image description and so on. Each format usually has its own field names and representations for its meta-data. Thus, to represent all geo-referenced images requires a separate primitive type for each format i.e. a distinct internal domain for every format. For example, we could define an NITF type which would allow us to create NITF objects that
42
represented data stored in the NITF format. Its associated meta-data acts as a type object, except meta-data can be read and modified at run-time while type object information is fixed. The major problem with defining a primitive type for each geo-spatial data object is that the type system can only be extended to new formats by rewriting the compiler. User defined procedures are limited to operations on predefined primitive objects and hence this does not promote code reuse. The alternative choice is to allow the user to define their own geo-image objects. For many textual programming languages this is a relatively simple task. In an object-oriented language such as Java, a class could be defined that encapsulated the data, constructors and methods to read and write data from a file. In a visual language, support for the creation of abstract data types (ADTs) requires mechanisms to specify visually the data contained within the object, methods to access the data and possibly a constructor. With our data-flow visual language, an ADT could be formed by specifying a list of property names. The data is accessed with the Get and Set operators. The problem is how to read the data from a file into the ADT. The data-flow VPL described so far is not suited to this kind of work since there are no mechanisms available to the user to access files or helpful control mechanisms such as loops. In a language such as Java we could open up the file and then according to the file format specification load all the data. Even if a means to access files was included, a data flow language has no notion of state and control of execution flow that is crucial when parsing data. What we need is to fit geo-images into our type system so that each type represents a distinct domain, while at the same time providing a mechanism so that the geo-images can be considered to be in the same internal domain. The practical benefit is that is allows operators to be re-used without programmer knowledge. We wish to define a strongly typed language which enables us to create a type that has a clear and unambiguous semantic identity. For programs that may be executed in parallel we would like to identify errors as early as possible. Thus a strongly typed language is clearly a desirable choice. Geo-image representation The first step is to define a data object that can represent all geo-images. It should be noted that while datamodels may be different in various formats, the actual 43
pixel data or image data will be of a consistent form; namely, a two dimensional arrays of some primitive type. The USIGS Common Object (UCO) specification [17] is a collection of broad data types defined as part of the USIGS architecture. SimpleGSImage is defined to represent simple grayscale image i.e. a single-band image. In IDL it is defined as struct SimpleGSImage { unsigned long width; unsigned long height; Buffer pixels; } where Buffer is defined as an array of either bytes, doubles, floats and (short/long) integers. The UCO specification also defines a type for colour image by including three fields for the red, green and blue bands. However most satellite data has more than 3 bands, and it is up to the user or application to choose how they are represented as colour RGB images. To accommodate all geo-images we introduce the class GeoGenericMultiBandImage which can support multiple bands and the associated meta-data. Figure 2.11 depicts the UML class diagram that describes this class (See Appendix A for full description of class and its methods). In accordance with the GIAS specification, metadata is represented by name-value pairs grouped together into a DAG. Early attempts at defining a type interface GeoGenericMultiBandImage defines a generic data object for geo-images. It can be considered as the internal domain as mentioned in the previous sub-section. The problem faced now is how do we provide a mechanism to access different file formats into the same internal domain and then hide this fact from the client. One early attempt was to define GeoGenericMultiBandImage as an abstract class then implement classes for a given format as shown in figure 2.12. For each child there would be methods to perform the task of accessing a specific file format. The notion of type or identity is established by having unique classes for every format. Polymorphism means that NITF, BIL and HDF formats can be used with an image library that has been defined with object of GeoGenericMultiBandImage. 44
GeoGenericMultiBandImage -buffers: SimpleGSImage[] -type: String -metadata: GIAS.DAG -primitive: String -bands: integer +GeoGenericMultiBandImage ( buf: SimpleGSImage[], typ: String, md: GIAS.DAG) +getAllBands(): SimpleGSImage[] +setAllBands(allbands: SimpleGSImage[]) +getType(): String +setType(name: String) +getMetaData(): GIAS.DAG +setMetaData(inmetadata: GIAS.DAG) +getBand(band:int): SimpleGSImage +setBand(band:int, simg: SimpleGSImage) +getAttribute(name: String): Object +setAttribute(name: String, value: Object) +getNumBand(): integer +getPrimitive(): String +setPrimitive(prim: String)
Figure 2.11: UML class diagram for GeoGenericMultiBandImage
GeoGenericMultiBandImage
NITF
BIL
HDF
Figure 2.12: UML inheritance diagram for format specific classes
45
NITF file
NITFReaderWriter
HDF file
HDFReaderWriter
BIL file
BILReaderWriter
GeoGenericMultiBandImage
Client
Figure 2.13: Separating the task of reading and writing to a specific file and the data representation However, a better design would be if the process of reading and writing from a data source was decoupled from the actual GeoGenericMultiBandImage data object. The task of reading and writing can be encapsulated within separate classes for every format. An interface could be defined which implementors must follow when introducing a new reader-writer class for a new file format. When reading a file, the data is loaded into an instance of GeoGenericMultiBandImage. When writing a GeoGenericMultiBandImage is passed as a parameter to the appropriate method. Figure 2.13 illustrates this situation. There exists two problems with this approach. Firstly, the type of data held within GeoGenericMultiBandImage cannot be distinguishable from other formats. To circumvent this problem, the GeoGenericMultiBandImage object is included with a type field as shown in figure 2.11. The second problem is how the appropriate reader/writer class is chosen and how is the client made aware of their existence so that they can find out what formats are supported. Final Design Consider the UML diagram shown in figure 2.14. The IOPortal class is the object through which data is accessed. The task of providing the data on request and locating the particular reader/writer is shielded from IOPortal and delegated to the DataService object. DataService’s role is to request for a particular reader-writer and for registration of available types. This is achieved through using the Factory Method pattern [46,47]. The DataService requests a particular reader-writer object through the GeoRWFactoryIF interface. GeoRWFactory implements this interface and provides the method createFactory that dynamically loads the ap46
IOPortal
GeoReaderWriter
NITFReaderWriter
GeoGenericMultiBandImage
+read(filenames: String[]): GeoGenericMultiBandImage * +write(filenames: String[], ggmbi: GeoGenericMultiBandImage) +read(filenames: String[], g: Region): GeoGenericMultiBandImage +read(filenames: String[], g: GeoRegion): GeoGenericMultiBandImage
BILReaderWriter
*
* creates
1
1
+read(filenames: String[], type: String): GeoGenericMultiBandImage +write(filenames: String[], ggmbi: GeoGenericMultiBandImage) +read(filenames: String[], type: String, g: Region): GeoGenericMultiBandImage +read(filenames: String[], type: String, g: GeoRegion): GeoGenericMultiBandImage
creates
uses
DataService
GeoRWFactory 1
+createReaderWriter(type: String): GeoImageReaderWriter
GeoRWFactoryIF +createReaderWriter(type: String): GeoImageReaderWriter
+TypeStatus(type: String): boolean +TypesAvailable(): String[] +writeFile(filenames: String[], ggmbi: GeoGenericMultiBandImage): boolean +readFile(filenames: String[], type: String): GeoGenericMultiBandImage +readFile(filenames: String[], type: String, g: Region): GeoGenericMultiBandImage +readFile(filenames: String[], type: String, g: GeoRegion): GeoGenericMultiBandImage Requester
1
* creater
Request-creation
Figure 2.14: UML diagram for geo-image file-specific factory design propriate reader/writer class. Therefore the DataService object is independent of the task of instantiating a particular reader-writer class by delegating the choice of which reader/writer class to instantiate to GeoRWFactory and referring to the newly created reader-writer object through a common interface. Thus DataService uses reader-writer objects, whose existence it knows nothing of – all it is aware of is the abstract methods read and write of GeoImageReaderWriter. However, DataService is informed of the type of file to be accessed through the type parameter passed to it by IOPortal, but it is decoupled from the actual task of accessing a particular file format. An additional function added to DataService is type discovery. Types are discovered by a configuration file. Thus if a user specifies a format type that is not recognized, then DataService can inform the requesting IOPortal before a request is made to the factory. The advantage of this design is that new formats can be easily introduced without significant modification to the framework. All that needs to be done is to
47
implement the GeoImageReaderWriter class for a given file format and modify a configuration file that maps type to reader/writer class. Thus we have effectively designed a system whereby user-defined data types can be implemented through writing the methods to read and write from that file format and present the data internally in the same representation. The type information is introduced at the top level as a static check when type checking. Run-time errors Each instance of GeoGenericMultiBandImage can be discernable from other instances which hold data obtained from files of different format by the type field. This ensures that attempts to mix types inappropriately are raised as an error when parsed. However this does not prevent run-time errors. Consider two NITF images of different size that are attempted to be overlayed into a single image. This error can not be detected until run-time. The introduction of sub-types, as found in Ada, is a potential solution to this problem. A sub-type field could be introduced so that the programmer may add to further constrain an instance of some data with a unique identification. However this approach implies the nature of the image data will be known when type checking is performed. This can never be the case since information such as dimensions can only be revealed at run-time. If the data source, such as a file residing on disk, is available before run-time then a more responsive capability could lead to its details being known when the visual programmer first enters its name. AVS operates this way. Type checking occurs everytime a user makes a connection between operators. However, this may be never possible since the data may be retrieved from a remote database. Also, increased responsiveness in this case might be a problem when the task of reading the file is time consuming and the user is making numerous changes. Beyond image data For completeness, the typical primitive types that are found in many textual languages are also included. They are as follows: Integer, Float, Double, ShortInt, Byte and Boolean. As in the case of the image class, these types are uniquely qualified by their type name. Since the implementing language is Java, their behaviour will mimic Java’s equivalent type. 48
2.7
Exception Handling and Propagation
In traditional textual programming languages that support exceptions, the exception event and data are viewed separately. Consider the following Java fragment. try { float result = 10/0; } catch (Exception e) { System.out.println(‘‘Exception has occurred’’); } Event handling is a control mechanism. In this piece of code, when 10 is attempted to be divided by 0 it raises an exception. The control of the program is handed over to the exception routine which handles the exception and then either exits the program or returns control to the program which then proceeds to continue the normal flow of execution. The model for exceptions and their handling in Java is suited to sequential processing where control and data control are contained in a single processor. The notion of exceptions in distributed applications is complicated by the distributed nature of execution. Dependent processes may be separated over a network and in the event of an exception there needs to be mechanism to notify other processes. To better understand this problem, consider the dataflow diagram shown in Figure 2.15 which depicts several processes and their relationship. There are four processes (A, B, C and D) and as can be seen the final result is the byproduct of the process D after it has received data from processes A and C. Imagine that process A raises an exception and terminates. B and then C continue to process their data before C passes data onto D. D receives the data from C and waits for data from A. Since A no longer exists, D waits forever. One approach is for A to handle the exception and instead of terminating, pass an error token onto D. Processes B and C proceed unaware that an exception has occurred and pass the data onto D. It is only when the stage of computation has reached a common point that the existence of an exception becomes effectively known. The approach of passing a small error token that is then forwarded to all other processes removes the notion of separation of event control and data: the excep49
A
D
B
C
Figure 2.15: Simple dataflow diagram tion event is now considered as data. This view is suited to the dataflow model since it follows the paradigm as well as being simple. However this approach is unable to address the problem of halting runaway concurrent processes. For example, processes B and C keep on going even though the creation of the final result is not possible. Not only is this a waste of effort but also of computational time if B and C are time consuming. From a programmer’s perspective it is frustrating since the notification of an exception arrives possibly a significant length of time after it actually occurred. The other problem is that the exception may take a significant amount of time to propagate down to where the final result would be delivered. Although an exception is treated as a null process, it still needs to forward a message to all processes further up the dependency hierarchy. Therefore the network on which the process graph is overlayed is unnecessarily flooded with error tokens and wasted connections. An additional drawback is the inability to produce an error traceback for debugging purposes. An exception is not discovered until the end, therefore the location of the error is unknown unless some record is kept of where and why the exception occurred. Sometimes the delayed notification of exceptions may be acceptable since some results may not be dependent on the process that has thrown the exception. For example, in a system that provides fault recovery mechanisms, the computation could possibly be re-started at the point of failure after a correction is made, leaving other unaffected parts of the computation to proceed normally.
50
Central controller
Control plane
A B
C
Data plane D
Figure 2.16: Centralised exception model An alternative exception model is to do what Java and other languages use: have a separate event controlling mechanism from data control. One such approach is the centralised model where each process communicates with a central controller as shown in figure 2.16. There exists a data plane where arrows denote flow of data and a control plane with a single central controller that sits above and monitors for exception messages along the communication lines denoted by the dashed lines. When an exception occurs it broadcasts the message to all processes. When a process receives an exception message it may handle it by either terminating or ignoring it. Figure 2.16 indicates that the central controller has established communication seemingly before any actual computation has taken place. That is, each process is initially set-up and sits waiting for data to arrive. This would obviously incur a significant start-up cost to firstly establish the process and then link up the central controller to all processes. A possible refinement is to have each process establish and sever connection as it starts and finishes. This is an obvious refinement since it makes no sense to send an exception message to a dead process. Therefore in our example, processes A and B would first establish communication with the central controller. When B completes it sends on its data to process C and notifies the central controller of its impending death. Process C then establishes communication with the central controller and carries on with its work. If at this stage A raises an exception, an error message is sent to the controller which then sends out an error message to all active processes, 51
i.e. C. The centralised exception handling model solves the previous problem of cutting short run-away processes. However it introduces a new problem of having to establish the control plane. The benefit of the error token approach is its simplicity and robustness. The centralised model relies on a single controller that may exists on a remote machine, while the error token approach produces multiple error tokens across all the machines. This chain reaction effect may seem to be wasteful but is more likely to be successful. There exists an additional problem with the current way we have used the centralised model. Consider our original example and imagine that the central controller was being hosted on a remote machine from the machine that hosts process C. Thus, we can consider the latency between the controller, C and B to be significant. As before, at the start A and B notify the central controller of their existence and proceed. A raises an exception and notifies the central controller. The central controller informs all the active processes of A’s exception. At this stage B has finished, passed on its data and C is about to start. B is about to die when it receives the exception error message. So B terminates and sends a message back to the central controller of its decision to terminate. The central controller, having received the message, terminates as its function is no longer required. But while this is happening, C tries to notify the nowdeceased central controller and proceeds with its task, unaware that it is stranded. Assuming that it knows where to send its output data, part of the dataflow program continues until it most likely blocks from starvation at D. This problem is introduced because we assume the controller only notifies the active processes and not all processes. Rather than reverting back to this approach, we could adapt the current approach by requiring a process to wait for an acknowledgement from the central controller to pass on data. This would prevent any stranded processes from starting since the central controller would be able to firstly prevent processes such as C from starting and secondly, if it did start the central controller would be aware of it and therefore be able to send it an exception message. However, this approach has effectively introduced a form synchronization - something which the dataflow paradigm avoids. Therefore this approach partially ruins one of the advantages of the dataflow paradigm.
52
A* D* C*
B*
Control plane
A B
C
Data plane D
Figure 2.17: Isomorphic exception model Another approach is to still have a control plane, but instead of a central controller a graph of controllers that is isomorphic to the dataflow graph is grafted on top of the data plane. The graph is a spanning tree such that each node is reachable from each other; that is, the graph is connected. Figure 2.17 illustrates the possible configuration for our running example. The functionality of this approach is identical to the error token model except that data and event handling are clearly separated. In the event of an exception, an error token is sent over the isomorphic control plane. When a controller receives an error token, it forwards the token onto all outgoing edges except the edge on which it received the token. It continues to pass the token around until it arrives at a node of out degree of 1. The error token approach is simple but inefficient as it is unable to halt runaway concurrent processes immediately after an exception is raised. Modeling exception handling separately from the data solves this problem but introduces additional mechanisms and an initial run-time overhead in setting up the control plane. Procedural abstraction further complicates our exception model as the number of processing nodes increases. So far we have considered the processes to be indivisible. In the example shown, a process could represent a procedure that encapsulates a number of sub-processes which in turn could represent further subprocesses. For the isomorphic model, the program would need to have procedures flattened out into a single graph so that each node can be reachable. The data token model would require no modification, but increasing the number of nodes 53
A* D* B*
C*
Top control plane
Procedure control plane
Data plane
Figure 2.18: Hierarchial control plane adds to its ineffectiveness to quickly handle exceptions. Thus this approach is not scalable. Consider figure 2.18 which shows a hierarchy of control planes for two levels of abstraction. To reduce the cost of setting up a control plane for all processes, we define a hierarchy with each procedure having its own control plane which co-ordinates the handling of exceptions. When an exception occurs, a message is passed to all the local processes and to the higher levels where it filters to the top level. At the top level we can expect that the higher level processes to have not been allocated to some group of machines and the granularity of the data tokens can be considered to be coarse relative to the lower levels. The lowest level represents the operators that the procedure encapsulates. Within a procedure there is a greater coherency than at a higher level. The granularity of the data may be finer and operations may be performed amongst machines that are relatively close or even on a single machine. At this level we could assume that all processes have been allocated and hence their locations known. With such a small grouping of possibly localized processes, the exception model chosen for this level could 54
acceptably be the data token model. Figure 2.18 indicates how the final process in the data flow diagram can pass an error token onto its parent level. Using a similar argument, the exception model could also acceptably use the centralised model. All the tasks of a particular procedure could be serviced on the same machine. Of course, this depends on how all tasks are scheduled. There has been relatively little work on developing exception models for distributed systems. Xu et al [48] developed an Object-Oriented (OO) exception handling model that can used with a wide set of OO languages and can be applied to systems which are incapable of simple backward recovery. Their model define mechanisms which enable exceptions from concurrent processes to be coordinated and handled. They introduce a production cell application of an assembly line robot that works on a metal plate as their example [48]. the robot interacts with other concurrent processes such as a conveyor belt and press. In the event of an exception, all other processes need to be informed to prevent an accident and then reset to some start state before continuing. Unlike the production cell example, our dataflow model can not be backwards recoverable since dataflow is asynchronous. When an exception occurs, the data produced, if any, from that node is invalid; that is, the data produced can’t be used to obtain a correct final result. Therefore recovering may not be possible. For example, adding two images of different sizes. The exception has occurred and no recovery mechanism, other than what is done locally, can produce a sensible result. Thus we need to inform the other processes as soon as possible. This is the main objective of the mechanisms discussed in this section. Exceptions that occur due to machine failure is related to fault tolerance and is not considered in this work.
55
Chapter 3 Implementing the VPL environment 3.1
The Interface
In this section we briefly overview the VPL interface and discuss some of the more important components. For more information on the operation of our VPL, refer to Appendix B.
3.1.1
Workspace
The interface was implemented using the Java Swing graphical toolkit [49]. Figure 3.1 shows a screen dump of the environment. The left-hand window is the palette from which operators can be dragged and dropped onto the workspace, and then connected into a task graph representing a program. As operators are dragged and dropped onto the workspace, the relationship between the nodes is maintained by a directed acyclic graph object. Each operator is represented by a node in the graph and the in-coming and out-going arrows are recorded by the nodes adjacency sets. When an arrow is added, the task graph is checked to see if it is a DAG; if not, then the connection will not proceed and the user is issued an error message. It is also not possible for an arrow to have either its tail or head not connected to some node, i.e. a dangling arrow in free space. Each node stored in the graph is an instance of the abstract class SIcon. This class contains all the information and methods required to visually represent
56
Figure 3.1: Screen dump of our visual programming environment
57
an operator. Information contained within this class include its position, height, width, the name of operator that this icon represents and any other miscellaneous information that is needed. Methods provided includes get and set methods for accessing private data and how to draw the icon. SIcon is the parent class for all operators. To introduce a new operator, the implementor needs to implement the following methods: public void displayIcon(Graphics g, JPanel panel); public void parse(GraphParser gp); public String typeCheck(GraphParser gp); The first method is called everytime the workspace is drawn. Thus an implementor needs to specify how the operator should look like and draw it onto the workspace. The next two methods are concerned with parsing and type checking and is the subject of the next two sections.
3.2 3.2.1
Lexical Analysis Introduction
Before the tasks specified by a visual program can be performed, it is necessary to verify that it conforms to the syntax and semantics of the language. With traditional textual languages this is done as part of the compilation process. A source program is fed into the compiler and goes through a series of stages before the target code is generated. Referring to figure 3.2, lexical analysis scans a sequential stream of text and picks out combinations of characters that form legal symbols. These are known as lexemes or tokens. The stream of tokens are fed into the parser which verifies that the code conforms to the definition of the language syntax. The parser produces a parse tree that is passed on for semantic analysis. This phase determines whether or not the syntactically valid sentences are semantically correct. Type checking is performed at this stage. Once the process has passed these stages without error, the target code is generated and the program can be executed. In this section we discuss lexical analysis and in the next parsing.
58
Input Text
Lexical
Syntax
Analysis
Analysis
(Scanner)
lexems
Semantic
(Parser)
Parse Tree
Analysis
Code Intermediate Code
Generation
Figure 3.2: Compilation process for textual languages a, b,..., z
A, B,..., Z 0, 1,..., 9
S
a, b,..., z
z1
other
identifier reserved word
other
number
A, B,..., Z 0, 1,..., 9 0, 1,..., 9
:
z2
=
z3
assignment
colon
Figure 3.3: Transition diagram adapted from [50]
3.2.2
Lexical Analysis
Lexical analysis of textual languages consists of reading a text file and mapping a series of characters in the defined alphabet to some valid symbol such as a reserved word, numeral, operator or identifier. Figure 3.3 shows part of a simple transition diagram for a simple language. The transition diagram consists of a series of finite automata which read in a character at a time until a legal word is found. Therefore the following fragment of code foo := 10; would produce identifier, assignment, number and semicolon. As operators are dropped onto the workspace and the relationship between them formed with arrows, the program is recorded as an abstract graph. Therefore lexical analysis is not necessary since the task of picking out of tokens has 59
Target Code
already been done, i.e. the nodes of the graph must all be legal words. Unrecognizable operators (nodes) are not possible since the user is constrained to selecting from a palette of legal operators (nodes). In contrast, some visual languages [51,52] are not based on linking together predefined icons into a program. A programmer attempts to construct a program by drawing structures onto a workspace with an almost freehand drawing package-like interface. The image of the ‘program’ is scanned pixel by pixel for recognizable shapes. This is analogous to scanning in textual languages, except in two dimensions. The task is vastly more difficult because of the extra dimension and the variance in possible sizes and form of shapes that can be drawn by mouse. Our approach of maintaining an abstract graph to represent a program is a lot more pragmatic and workable.
3.3
Syntactical Analysis
Techniques of syntactical analysis or parsing of textual languages are well known [53]. A parser ensures that the program being parsed conforms to the syntax of the language. The parser receives a stream of tokens and produces a parse tree which is a description of how the input tokens make up the grammatical construct. A language’s syntax can be expressed in a formal language such as Extended Backus Naur form (EBNF) [54]. The language’s syntax can then be expressed by a set of EBNF productions. The productions can then be used as the basis for writing a parser. For example, we can describe simple arithmetic expressions by the following productions:
::= ::= ::= ::=
[+]∗ [*]∗ |() 0 | 1 | 2 | 3 | 4 | 5 | 6 | 7 | 8 | 9
Therefore an expression such as 6*4 + 2 would be legally parsed, but 6*4 + 2 + would not. Specification is possible since textual languages are one dimensional and thus there exists only a single relationship between symbols of a sentence. VPLs 60
may have multi-dimensional relationships. The wide variety of different types of relationships has meant that there does not yet exist a universally agreed upon formalism to express all VPLs. The focus of current research is to produce an analog to EBNF for VPLs. An example of an attempt to define a general formalism for VPLs is Constraint Multiset Grammars (CMGs) [55]. A CMG production indicate which geometric conditions need to be satisfied for a given 2-D collection of diagrams that represent a visual sentence in the VPL. Expressing the syntax of out VPL in a formal grammar such as CMG is not necessary. There is no advantage in doing so for the purpose of developing a parser. The visual syntaxes described in chapter 2 are presented in a form that is similar to syntax graphs that are found when describing text-based languages. Therefore parsing is a simple task. To illustrate this, consider the toy example shown in figure 3.4. This example shows the value 2 is being subtracted by 1. Edge labels 1 and 2 qualify which value is be taken from the other. All that is required to parse SUB is to check that there are the correct number of in-going and out-going edges and that the labels are correct. The parser for the SUB operator would therefore be written as (using Java syntax): public void parse(GraphParser gp) { // check to if it has already been visited; if so, then return if (this.visited) return; // check for the correct number of in/out-coming edges if (!(MustHaveNumIn(2))) gp.setParseState(false); if (!(MustHaveNumOut(1))) gp.setParseState(false); // check if it has the correct edge labels int oklabels = 0; ArrowStem[] arrows = this.getInedges(); for(int j=0; j < arrows.length; j++) { if (arrows[j].getLabel().equals(‘‘1’’) | arrwos[j].getLabel().equals(‘‘2’’)) oklabels++; } if (oklabels != 2) gp.setParseState(false); // parse all nodes on in-coming edges SIcon[] innodes = this.getInNodes(); 61
2
1 SUB
1
2
Figure 3.4: Toy example for(int i=0; i < innodes.length; i++) innodes[i].parse(gp); } To parse an entire program, we perform the following sequence of operations: 1. Check to see if the program graph, which is a DAG, is not disconnected. We recall that a disconnected non-directed graph is a graph that can have two nodes which are not connected. To find if our DAG is disconnected, we must first convert it to a directed graph with a symmetric adjacency set and then perform a depth first search (dfs). If the graph is not disconnected, then dfs should visit every node. The dfs method used, returns a forest of dfs trees, i.e. an array of trees. If there exists more than single tree, then the graph is disconnected and we stop parsing. 2. To parse the entire program, we start from the set of output data portals and progress back to the input data portals. To find a list of all output data portals, we find all nodes with out-degree of zero. 3. For every node in this list (remember that each node is a child of SIcon), we call its parse method. Of course, if any of these nodes are not an output data portal, then a parse error shall be raised. 4. Once a node has been parsed, it then grabs a list of all nodes that is on an in-coming edge and calls it parse method. See code above. 5. We continue 4 until nodes with in-degree of zero is reached, i.e. an input data portal. 62
A C
D
K
M
E
F
B
G I
J
H
Figure 3.5: Graph program to illustrate parsing A C
D
K
M
E
F
B
G I
J
H
Figure 3.6: Graph in Figure 3.5 with symmetric adjancency set To illustrate how the parser operates, consider the example shown in figure 3.5 The node labelling has no particular meaning and do not refer to any actual operators. The parser would initially verify that the length that the program graph is not disconnected. The graph is converted to a directed graph with a symmetric adjacency set as shown in Figure 3.6. As it can be seen, a single dfs tree is produced when starting from any node. Then starting with nodes M and F, we call their parse method. M and F should be output data portals. If we call F’s parse method first, we then parse E next. From E we parse D or J. If J then parse I, followed by G and H. G and H should be input data portals and since they have no in-coming edges, we recursively move back up the graph to E and start parsing D and so on. We now parse M and then K. Since D has already been parsed, we proceed no further. The parsing process is now complete. When a parsing error is found, an error message is recorded and the node is flagged. The particular node on workspace is highlighted by a red border as 63
shown in figure 3.7, and an error message dialog can be brought up with the error messages (see Appendix B for further details on the operation of the interface).
3.4
Type Checking
Type checking occurs after a successful parse. The process operates in a recursive way similar to the parsing process described before. As with parsing, we start from the output data portals and progress through the graph until we have reached the input data portals. Once we have the initial data type from the input data portals, we recursively move back and anontate the graph as we go. As mentioned earlier in subsection 3.1, each operator icon (represented internally by the class SIcon) that is dragged onto the workspace, has the method typeCheck(GraphParser gp). This method returns the data object exiting this operator. returning to our simple toy example in figure 3.4, the typeCheck method for the SUB operator would be written (again using Java syntax) as: public String typeCheck(GraphParser gp) { SIcon[] nodes = this.getInEdges(); String type1 = nodes[0].typeCheck(gp); String type2 = nodes[1].typeCheck(gp); if (!(type1.equals(type2))) gp.setSemanticState(false); return type1; } Therefore to type check an entire program, we perform the following sequence of operations: 1. Obtain a list of all the nodes with out-degree of zero. 2. For every node in this list, call its typeCheck method. 3. Each node calls the typeCheck method on all nodes that are on an incoming edge. 4. Continue 3 until a node with an in-degree of zero is reached i.e. an input data portal.
64
To see how type checking works, consider again figure 3.5 and let A and B represent integer vales and G and H floating-point values. Starting from F, we call E’s typeCheck method. From E, D’s and J’s typeCheck methods are called. This continues until the input data portals (A, B, G and H) are reached. E should receive an integer data type from D and a float from J. Since the in-coming types are different, a type error is raised. One of the types is then selected and passed on. From M, no type checking errors are raised since integer data types are passed from A and B to C, then to D and finally K. From the code for SUB’s typeCheck method, type1 is always passed. We currently haven’t implemented any error recovery mechanisms or strategies to select the most appropriate type to pass on, and therefore type errors may unnecessarily get propagated further down the graph. A possible strategy would to select the frequent in-coming type. In our example shown, there is only two in-coming edges and therefore returning either one is sufficient. When a type error is raised, the node at which the error is detected is high lighted red. An error message is also recorded and can be viewed in the error message dialog box.
65
Chapter 4 Compilation and Distributed Processing Framework In this chapter we discuss the compilation process and the model of distributed processing. The compilation process is more of a transformation process. A program graph consists of nodes of class SIcon. Compilation takes this graph and transforms it to a structure suited to our model of distributed processing. To transport data between machines, we used Java sockets. Image data is processed using Java Advanced Imaging (JAI). JAI allows for distributed processing using Java RMI. We compare the performance of using sockets to using JAI with RMI.
4.1
Introduction of the Execution Model
Imagine a user has constructed a program out of some image processing operators (as shown in figure 4.1) and has specified that operation OP1 is to be done on machine A and OP2 on B and so on. Assuming that the raw images img1 and img2 are stored at a location other than at A and B, the images are transported to the appropriate machine, operated on and passed onto the next machine to be processed. At D, it must wait until it receives image data from both A and C before executing OP4 and returning the final image to the user. The mode of execution follows the dataflow model. Each machine must ‘fire’ when all the data that is required has arrived. With our distributed processing framework, each of the machines runs a lightweight server. That is, it receives both the image data and the Java byte66
A img1
img2
OP1
B
C
OP2
OP3
D
Client
OP4
Final Img
Figure 4.1: Chain of image operators code to operate on the image. However, the server still requires access to JAI classes. The approach taken in may ways operates like Java RMI. The details of now this is achieved, are discussed later in this chapter. The next section discusses how and what the program graph is transformed to.
4.2
Compilation process
Consider figure 4.1 again. When a server receives data, it needs to know three things: how many other data objects are to be received before we attempt to execute; what operation is to be performed; and where are we to send the data once we have finished. To represent all this data, we define the two classes: Node and Machine. Machine represents a particular machine and contains four fields: hostname, portnumber, a program counter that associates this machine with a particular Node object and an outgoing edge label. The label field is usually not necessary since most operators have only a single outgoing edge. However control operators such as if-else have more than one outgoing edge, therefore the edge-label is needed to associate the edge to a particular machine’s destination. Node represents a node in our program. It is a stripped down version of its equivalent SIcon object. It contains information such as number of in-coming and outgoing edges, a value that maps this node to a particular operator and an array of Machine objects, which represents all the possible machines that a data object may go to after the current machine has processed its data. Since different operators are used and produce data of different type, we define the abstract class Operator, which contains a single method:
67
Array of objects of type Node
Array of objects of type Operator
Figure 4.2: Mapping from a Node to its Operator public Result execute(Parameter[] parameters, Machine[] outgoing); To introduce a new operator, an implementor need only to implement this method. execute takes two parameters: an array of objects of type Machine to represent the possible destination machines for the data that is produced from this operator, and an array of objects of type Parameter. The Parameter class contains three fields: an object to represent the data, a string field to store the datatype and the in-coming edge’s label on which this data has arrived. execute returns an object of type Result. The Result class simply contains the resulting data object, it’s type and destination machine. For more information on the field and methods of these classes, see Appendix A. The compilation process takes the graph of SIcon objects and flattens it out into an array of objects of type Node. It also builds up an array of Operator objects. Each Node object has an integer field (as mentioned earlier) that indexes to a particular Operator in the Operator array. This field shall be referred to as the operator map index. For any given graph, this may visually appear like what is shown in figure 4.2. The array of objects of type Operator shall be referred to as the toolbox since it is like a workman’s toolbox – it contains all the operators that this program 68
needs without duplicate. To flatten the graph into the array, the following sequence of operations are performed: 1. Obtain an array of all SIcons in the program graph. 2. For every SIcon in the array do 2.1. Get a list of SIcons which are on the out-going edge for this SIcon. 2.2. For every SIcon in this out-going list do 2.2.1. Obtain all information such as hostname, portnumber, the index of this particular outgoing SIcon in the array that was obtained at 1. 2.2.2. Create a Machine object using the details obtained above. Add this Machine object to a running list. 2.3. Should have a list of all outgoing machines with their details. 2.4. Obtain the name of the operator that this SIcon represents and its index number. 2.5. Create a Node object with the above information. At the end of this process, we have an array of objects of type Node, with each mapped to the correct operator object in the toolbox, and each Node object has a list of machines which data produced from this Node may send its data and their details.
4.3
Implementation of Distributed Processing Framework
We use the dataflow model as our model of execution. Operators are executed by a server on a particular machine when all the data arrives. The current implementation assumes that only a single program can be processed at any one time. The execution of a program built in our VPL can be summarized by the following sequence: 1. First obtain a list of all the input data portals, i.e. all nodes with in-degree of 0. 69
2. The index to the ‘compiled’ nodes is referred to as a program counter (PC) since its function is similar to that of a program counter used inside a processor. For each of the input data portals, we obtain the next PC – this was determined during the compilation phase, i.e. at phase 2.2.1 above. Since input data portals have only a single outgoing edge, there should be only a single destination machine. 3. For each of the input data portals, obtain the input data object and then bundle the data, the next PC and the array of Nodes and Operators into an object called MessageOnEdge (see Appendix A for class description), and send this to the destination machine. 4. When the server first receives a MessageOnEdge object, is uses the PC sent by the previous server to lookup the array of Node objects, to find the Node object that is associated with this server. It then finds out how many input parameters are expected. This value is used to determine when the server should proceed and process the data. When the server receives all the data, it uses the PC to lookup the array of Nodes to find out which operator is to be executed. It uses the operator map index to obtain the Operator object. It then calls its execute method with data it has obtained as parameters. The method returns a Result object which contains the resulting data and destination machine. 5. Obtain the next PC from the destination machine returned and bundle up the array of Operators, Nodes, data and the next PC, and send off to the next machine. 6. Repeat 4 and 5 until data is received by the client. An important feature of this implementation is that the severs are all lightweight – both the code and data is brought to them. They are able to execute the operators since they have copy of the parent class to all operators, i.e. Operator. This approach is similar to how RMI operates. With RMI, a client can remotely invoke methods on an object on a remote server. RMI has also the ability for a server to download an object’s byte-code from the client and execute it methods. This is possible if the object being transported from the client implements a remote interface known as a skeleton. Therefore the server can receive objects 70
that implement this interface and call the methods defined in the interface. Thus our abstract class Operator can be considered to act as a skeleton and since objects sent to the server which implement this class, the server can call it’s execute method. The main difference is that our client does not have the equivalent stub object that RMI uses to allow a client to forward method calls to the server. To handle exceptions, we use the data error token approach proposed in section 2.7. The MessageOnEdge object contains a boolean field called exceptionflag, which is set to true when an exception is encountered. At phase 4 of the program execution sequence, the server first checks to see if exceptionflag is set to true; if true, then it proceeds normally and once it has received all the data, it skips the execution steps and passes on the array of Nodes and Operators and a null data object. Each Node object also has a boolean flag called hasException, which is set true when an exception is raised when executing its operator. Since all the Node objects are transported throughout the execution of the program, we are able to provide error trace-back by mapping a Node object to its equivalent SIcon object in the program graph. To better understand how the compilation takes place and then execution, consider figure 4.1 again. After compilation, we may have something like what is shown in figure 4.3. The processing phase starts with the input data portals and grabs the data img1 and img2. A thread is spawned by the client and a socket connection is made to A and img1 is sent with PC set to 1, and another thread is spawned and a socket connection is made to B and img2 is sent with PC set to 2. After A has completed, it looks at the toMachine field and sees that it must send its processed data onto D. Therefore A spawns a thread and makes a socket connection to D and sends the data with PC equal to 4. Similarly, at B after it has finished, it sends its data onto C with PC set to 3 and C then sends its data data after it has completed OP3 to D with PC set to 4. D, after receiving the first parameter, uses the PC (which is equal to 4) and records that OP4 requires two parameters. So it goes back into the wait state until it receives the second parameter and then proceeds to call the execute method of OP4 which it loads from the toolbox.
71
opname = OP1 inparams = 1 outedges = 1 mapindex = 1 toMachines = hostname = D pc = 4
opname = OP2 inparams = 1 outedges = 1 mapindex = 2 toMachines = hostname = C pc = 3
OP1
OP2
opname = OP3 inparams = 1 outedges = 1 mapindex = 3 toMachines = hostname = D pc = 4
OP3
OP4
opname = OP4 inparams = 2 outedges = 1 mapindex = 4 toMachines = hostname = clients machine
Array of Node objects
Toolbox
Figure 4.3: Compiled form of the program shown in figure 4.1
OrigImage
Invert
Exp
FinalImage
Figure 4.4: Pipeline of JAI operators
4.4
Java Advanced Imaging (JAI)
The Java Advanced Imaging (JAI) class library is a more advanced image processing extension to Java 2D, which was an earlier Java image processing API. Java2D provided some basic image processing features. JAI provides a greater range of features such as deferred execution, multi-tile imaging and a rich set of imaging processing operators that can have multiple sources. JAI supports a wide range of common formats and more complex formats, including images of up to three dimensions and an arbitrary number of bands. A powerful feature of JAI is the ability to create complex series of operations by chaining together operators into a DAG. JAI supports the pipeline or pull model. This means that an image is ‘pulled’ through a series of operators when requested. The older AWT imaging model used the ‘push’ model, where an operator is a producer of data to the next operator which is the consumer of the data. To illustrate the pull model, consider the pipeline of operations shown in figure 4.4. When a request is made for FinalImage, the request is passed up the chain and OrigImage is pulled through the chain and processed. If results are required only for a particular region of an image, then only that region is pulled through the chain. Therefore for very large images, a region can be efficiently processed without processing the entire image. The Java AWT API architecture introduced two integrated imaging layers: 72
renderable and rendered layer. The renderable layer is a device independent layer. An image in this layer can be considered to be abstract and are an instance of the class RenderableImage. The rendered layer transforms a RenderableImage to a RenderedImage, whose contents are specific to the context of a particular device. That is, RenderedImage is a representation of what a particular device thinks RenderableImage should appear as. for example, a Postscript file is a renderable representation and what is seen on the screen or print out is the rendered image. JAI can process an image in its renderable or rendered form. RenderOp for rendered images and RenderableOp for renderable images. The difference is that a RenderedOp processes an image immediately, while a RenderableOp processes until there is a request for a rendered form. DAGs of either RenderedOps or RenderableOps can be formed. For example, the following fragment of code represents the pipeline of operations shown in figure 4.4. The first line reads a TIFF file called image1.tif to create OrigImage. OrigImage is then has each pixel inverted to create the intermediate image op1. op1 is then passed to the next operator which takes the the exponential of each pixel to create FinalImage. RenderedOp OrigImage = JAI.create(‘‘fileload’’,’’image1.tif’’); RenderedOp op1 = JAI.create(‘‘Invert’’,OrigImage); RenderedOp FinalImage = JAI.create(‘‘Exp’’,op1);
4.5
Java RMI and JAI
JAI uses Java Remote Method Invocation (RMI) to implement remote image processing. A client can request the processing of images on remote servers. The client instantiates a stub object which acts as a proxy to the corresponding remote server object. The client makes calls to the stub whose arguments are transmitted to the server for processing. To start a server, the host machine must be running an RMI registry process and have a RemoteImageServer listening on a port (1099 by default). RemoteImageServer is started by running com.sun.media.jai.rmi.RMIImageImpl. No server-side code is required. On the client side, data and the server name is passed to the predefined stub object RemoteImage, which transports the data to the server for processing.
73
Returning to the example shown in figure 4.4 to process the first operation on a machine chilli and then perform the Exp operation on machine paprika, we would write the following piece of code. RenderedOp src = JAI.create(‘‘fileload’’,’’image1.tif’’); Rendered op1 = JAI.create(‘‘invert’’,src); RemoteImage rmt1 = new RemoteImage(‘‘chilli’’,op1); RenderedOp op2 = JAI.create(‘‘Exp’’,rmt1); RemoteImage rmt2 = new RemoteImage(‘‘paprika’’,op2);
4.6
RMI vs Sockets
The performance of distributed processing using JAI and Java sockets was compared with using Java RMI. We experimented with four pixel based JAI operators distributed over two of the PCs in the honours lab. Each machine has a Celeron 333 MHz processor with 128 Mb of main memory and runs the Solaris operating system. The machines are connected by fast Ethernet network cards and are relatively highly coupled, i.e. latency is low and bandwidth is high between machines. The machines are shared with other users, thus network traffic and machine loads varied during the experiments. Each machine worked on two operators. The first machine inverted and then calculated the exponential of each pixel of the image. The second machine found the natural log and then a bitwise logical NOT operation on each pixel. The image data used consisted of a TIFF image scaled to 500×500, 1000×1000, 1500×1500 and 2000×2000. These images corresponded to files of size 0.7, 2.9, 4.7 and 8.5 MBytes. For each of these images, the experiment was repeated 17 times, with the best and worse times discarded. Timing data was obtained using the getTime() method in the java.util.Date object, which returns a long integer value that represents the number of milliseconds since 00:00 GMT Jan 1 1970. The time was taken just before the data was sent and immediately after the data had returned to the client this varied a bit and depended on which implementation was being tested. We also performed the experiment with a serial version. Since JAI uses the pull model, the source image data is not pulled through the chain of operators until data is requested, i.e. the data sink makes a request for data. This request typically occurs when the image is required to be viewed in a 74
window or to be written to a file. To force an image to be rendered, we called the getData() method with the RenderedOp object (sockets) or RemoteImage object (RMI) returned. For example, using the previous code example, the RMI version would call rmt2.getData(). getData() returns a Raster object representation of the image. Calling getData() would then send a message back through the chain of operators and the source image is pulled through. The socket version sent a RenderedOp object as its image data token. At each machine, the incoming RenderedOp is passed to the next RenderedOp until it returns to the client. Table 4.1 shows the results obtained from these experiments. The values shown are the average time in seconds and the error ranges given are one standard deviation. The sockets implementation behaves as expected: as the size of the image increases, the time to complete the operators increases. The RMI version initially behaves as expected, but the timings with the 2000×2000 image were all significantly lower than for some smaller images. Since JAI implements its own stub and skeleton code, thus we are unable to time individual machines and therefore obtain data on what was happening. The socket version we wrote both the client and server-size code and therefore we examined the time of execution and communication costs for each of the experiments. The results obtained revealed that our socket implementation was incorrect. The actual computation was occurring on the client side, but was being hidden by the call to getData(). Contributing to this problem was that the operators selected were not computationally intensive. With the socket implementation, the server was receiving a RenderedOp object, but not data – that was left with the client. It was incorrectly assumed that the data travelled with the RenderedOp object. The analysis showed that the servers were spending approximately 0.4-0.7 seconds on both of the operators. What was being produced was a chain of operators, chained together over two machines. When the operator returned, its getData() method was called and the local image was pulled through this chain. To verify this, we removed the getData() call and found that for all images, the time taken was always about 10.5 seconds. That is, it took approximately 10.5 seconds to build this chain of RenderedOps. This result is confirmed by the serial version which is approximately 10 seconds less than the sockets version. However, this doesn’t help to explain why the timings for the 2000×2000 image using RMI are so low. We has no explanation as to why this is the case. It is very unlikely that RMI is
75
Image Size 500×500 1000×1000 1500×1500 2000×2000
Sockets RMI Serial 12.1±0.1 9.3±1.6 1.9±0.1 14.9±0.1 20.4±1.9 3.9±0.1 20.7±0.1 25.1±1.9 9.3±0.1 35.4±0.1 19.9±2.9 14.9±0.1
Table 4.1: Experimental results. processing the image on the client side. Further analysis is required with different image sizes. The advantage of RMI over sockets is that it requires significantly less programming effort. The socket implementation was approximately 500 lines of code. Whereas the RMI version was approximately a dozen lines of code. The advantage of using sockets is that there is greater flexibility to introduce customized policies such as dynamic job placement. An additional advantage of using sockets over JAI’s version of RMI is that with sockets other types of data can be used. RemoteImage can only be used with JAI objects. This analysis current analysis fails to determine the performance difference between using sockets and RMI. For further analysis requires the socket implementation to be properly implemented and to consider more complex chains. For example, the analysis should consider operators that are computationally intensive and vary the communication costs between processing nodes.
76
Chapter 5 Future Work and Conclusion 5.1
Conclusion
The motivation for this project arose from the development of an on-line image server (OLGAS) by the DHPC group and DSTO. The image server enables users to search for and download geo-spatial images. The current development is to extend the functionality of the server to enable images selected to be processed before returning to the client. The images processing may be computationally intensive and therefore can be distributively processed. To specify how images are to be processed, a tool was required to enable clients to visually build chains of image operators. In this honours project we prototyped a framework for distributed processing of geo-spatial images. We developed a dataflow visual program language and environment from which users can build chains of image operators. The image operators represented Java Advanced Imagining (JAI) operators. Representing programs as directed acyclic graphs (DAGs) naturally reveals the data dependencies between operators and the parallelism that is available. The dataflow computational model is ideal for distributed image processing since it relieves the user from many of the problems faced when writing distributed programs such as determinacy, synchronization and race conditions. The image operations in JAI also behave in dataflow fashion; that is, the image operators are data driven, consume and produce data. The data tokens in our dataflow VPL may be geo-images. Geo-images can be images that consist of a number of bands and has associated metadata that 77
is unique to a particular format. To represent all these kinds of geo-images, we developed the class GeoGenericMultiBandImage and is based on data structures defined in the UCO specification. Our VPL environment could therefore interoperate with a GIAS compliant image server such as OLGAS. We also developed an interface to the VPL environment that allows new formats to be integrated without any significant modifications. We have attempted to introduce strong typing into our VPL so that potential run-time errors due to type mismatches are detected as early as possible. To distinguish different types of geo-images, we introduced a type field to the GeoGenericMultiBandImage class. Therefore any attempt to use an operator that uses a unique metedata property of a particular geo-format with a different format will result in a compile time error. However, the type system developed is not able to prevent run-time errors such as adding two images of the same type but of different size. Introducing an AVS-like approach of incremental compilation, where the data is interrogated during program construction for type information, may not possible be possible since the data may be not be available at compile time. For example, getting data from a remote server. Exceptions and their handling in distributed systems is difficult and complicated by having several concurrent processes on machines that may be physically separated by networks of high latency. We have examined several strategies in which exceptions are propagated throughout a distributed dataflow program. The goal of these strategies is to terminate other currently active concurrent processes as soon as possible. In our distributed processing framework, we have implemented only a simple data error token approach. To distribute the processing, we used Java sockets. Although the current version is incorrectly implemented, using sockets provides greater flexibility and control to experiment with different policies such as dynamic job placement than with Java RMI. There exist a number of VPLs such as AVS and Cantata which support geospatial images and are able to perform distributed image processing. However, these systems support a limited range of geo-spatial formats and extending to new formats is cumbersome and difficult due to a lack of a well defined API. Cantata allows only homogeneous distributed processing, while AVS’s distributed processing is limited due to poor portability of code and data. Our
78
VPL is implemented in Java and therefore provides greater portability. We have developed a representation that conforms to a well defined specification (UCO specification) and can be interoperable with systems which conform with these specifications.
5.2
Future Work
The current implementation of the visual programming environment and distributed framework is a prototype version that enables simple image processing programs to be constructed. Future work to the VPL includes • Enable programs developed to be saved and recovered from a file. Program files need to be portable so that they can be loaded and executed from other platforms. XML [56] is a portable markup language that could be used to save graph-like structures. • Introduce progressive feedback on state of execution. For example, as programs are executed, the interface can be provide progress information and performance data at different stages. • General clean up of interface. The servers assume that only a single program can run at any one time. The reason is that the servers are unable to distinguish data from one program from another. To solve this requires each program to have a unique identifier and modification to the server. Currently the allocation of tasks is static – the user must specify which machine is to do what. Future work may consider the dynamic allocation of tasks according to machine availability and load. For example, a client could develop a program and submit the program to a front-end server to a group of machines. The front-end server could then allocate the program’s tasks to these machines to achieve the greatest performance possible. The current implementation use of the error token approach to exception propagation fails to address the problems of halting concurrent processes as early as possible. Future work may consider implementing and experimenting with the alternative approaches discussed in chapter 2. 79
The VPE and distributed processing framework developed is currently a standalone application. The next step is to integrate the OLGAS server into the visual programming environment and distributed computing framework. We could imagine that a user could drag and drop an OLGAS client icon onto the workspace which would then act as a source of data like an input data portal. A user could then enter a query through a particular OLGAS client window and connect this to a series of image processing operators. Procedural abstraction is an important feature that has yet to be included. The image processing programs discussed so far have been small enough to fit on the workspace. In future, procedural abstraction may be required to achieve scalability, better management of workspace real estate and visual code reuse.
80
Bibliography [1] E. Freeman, S. Hupfer and K. Arnold. JavaSpaces Principles, Patterns and Practice. Addison-Wesley, 1999. [2] T. Lewis and H. El-Rewini. Introduction to Parallel computation. AddisonWesley, 1989. [3] K. A. Hawick. Distributed and High Performance Computing Terminology. August, 1997 [4] Sun MicroSystems Inc. Java Remote http://www.java.sun.com/jdk/rmi
Method
Invocation
(RMI).
[5] Object Management Group. Common Object Request Broker Architecture (CORBA). http://www.omg.org/corba/ [6] K. A. Hawick et al., DISCWorld: An Environment for Service-Based Metacomputing. DHPC technical paper no. 42, June 1998. [7] P. D. Coddington et al, Interfacing to On-line Geospatial Imagery Archives. The 27th Annual Conference of AURISA, Leura, NSW, Australia, November 1999. [8] Roy Williams, SARA project, http://www.cacr.caltech.edu/˜roy/sara/ [9] R.Williams and B. Sears, A High-Performance Active Digital Library, August 1997, http://www.cacr.caltech.edu/˜roy/papers/sarcan.pdf. [10] Microsofts Terraserver, http://www.terraserver.com/ [11] K.A. Hawick and H.A. James, Distributed High-Performance Computation for Remote Sensing, Proc. of Supercomputing ’97, San Jose, November 1997. 81
[12] K.A. Hawick and H.A. James, A Web-based Interface for On-Demand processing of Satellite Imagery Archives, Proc. of the Australian Computer Science Conference (ACSC) ’98, Perth, February 1998. [13] NASA Goddard Space Flight Center, Earth Observing System Data and Information System, http://www.spsoun.gsfc.nasa.gov/New EOSDIS.html. [14] Australian Centre for Remote Sensing, http://acs.auslig.gov.au/intro.html
ACRES Digital Catalogue,
[15] P.D. Coddington, K.A. Hawick et al., Implementation of a Geospatial Imagery Digital Library using Java and CORBA, Proc. Technologies of ObjectOriented Languages and Systems Asia (TOOLS 27), Beijing, Sept 1998, J. Chen et al., (IEEE 1998). [16] The U.S. National http://www.nima.mil/
Imagery
and
Mapping
Association,
[17] The U.S. National Imagery and Mapping Association, U.S. Imagery and Geospatial Information System (USIGS) Architecture Framework, http://www.nima.mil/sandi/arch/products/uaf/uafb-fin.pdf, August 1999. [18] The U.S. National Imagery and Mapping Association, U.S. Imagery and Geospatial Information System (USIGS) Technical Architecture, http://www.nima.mil/sandi/arch/products/uta/nuta-a-990126.pdf/, August 1999. [19] The U.S. National Imagery and Mapping Association, USIGS Geospatial and Imagery Access Services (GIAS) Specification, verion 3.3, http://www.nima.mil/sandi/arch/gias33asbuilt062299.pdf [20] M. Boshernitsan and M. Downes, Visual Programming Languages: A survey. http://www.cs.berkley.edu.au/˜maratb/cs263/paper.html [21] M. M. Burnett et al., Scaling Up Visual Programming Languages. IEEE Computer, Vol. 28, No. 3, March 1995. [22] Sun MicroSystems Inc. Java http://www.java.sun.com/jdk/jai 82
Advanced
Imaging
(JAI).
[23] S. Tanimoto, VIVA: A Visual Language for Image Processing. J. of Visual Languages and Computing, Vol. 1, No. 2, June 1990, pp127-139. [24] A. E. Fischer and F. S. Grodzinsky, The Anatomy of Programming Languages, Prentice-Hall, New Jersey, 1993. [25] M. M. Burnett and M. J. Baker, A classification system for visual programming languages. J. of Visual Languages and Computing, September 1994, pp.287-300. [26] K. Marriott and B. Meyer, Formal Classification of Visual Languages. J. of Visual Languages and Computing, ?, ? [27] G. M. Amdahl. Validity of the single-processor approach tp achieving large scale computing capabilities. AFIPS Conference Proceedings vol. 30, 1967, pp.483-485 [28] G. S. Almasi and A. Gottlieb. Highly Parallel Computing (2nd edition). Benjamin/Cummings, 1994. [29] A. D. Birrell and B. J. Nelson. Implementing remote procedure calls. ACM Transactions on Computer System Vol. 2, No. 1, 1986. [30] MPI Forum, MPI Standard, www.mpi.org [31] A. L. Davis and R. M. Keller, Dataflow program graphs, Computer, Vol. 15, Feb. 1982, pp. 26-45 [32] W. B. Ackerman, Dataflow Languages, Computer, Vol. 15, Feb. 1982, pp. 15-25 [33] V. S. Sunderam, PVM: A framework for parallel distributed computing. Concurrency: Practice and Experience Vol. 2. No. 4, Dec. 1990. [34] J. R. Gurd, Fundamentals of Dataflow, Distributed Computing. Edited by F. B. Chambers et al. APIC Studies in Data processing no. 20, Academic Press, 1984. [35] G. Kahn, The semantics of a simple language for parallel programming. Proceedings of IFIP Congress 74. 83
[36] Reference manual for the Ada programming language. United States Department of Defense, Feb. 1983. [37] Khoral Research, www.khoral.com [38] Advanced Visual Systems, www.avs.com [39] A. Beguelin, J. Dongarra, G. Geist, R. Machele and V. Sunderam. Graphical development tools for network-based concurrent supercomputing. Proceedings of Supercomputing 91, Alburquerque, New Mexico, August 1991, pp. 435444 [40] P. Newton and J. C. Browne, The CODE 2.0 Graphical Parallel Programming Language, Porceedings of the ACM International Conference on Supercomputing, July 1992. [41] G. Wirtz, The Meander Language and Environment, Software for Muliprocessors and Supercomputers, Moscow, Sept. 1994. [42] Distributed and High Performance Group, www.dhpc.adelaide.edu.au
University of Adelaide,
[43] D. D. Hils, Visual Languages and Computing Surveys: Dataflow Visual Programming Languages, Journal of Visual Programming, Vol. 3, No. 1, March 1992, pp. 69-101. [44] U.S. National Imagery and Mapping Association, National Imagery Transfer Format Standard (NITFS) Home Page, http://www.nima.mil/imagery/NITFS/ [45] Hierachal Data Format [46] E. Gamma, R. Helm, R. Johnson and J. Vlissides. Design Patterns: Elements of Resuable Object-Oriented Software. Addison-Wesley, 1995. [47] M. Grand, Patterns in Java, Vol. 1. Wiley, 1998. [48] J. Xu, A. Romanovsky and B. Randal, Coordinated Exception handling in Distributd Object Systems: from Model to System Implementation. Tech. Report No. 618. Department of Computer Science, University of Newcastle. 84
[49] Sun MicroSystems Inc. Java Swing. http://www.java.sun.com/jdk/swing [50] B. Teufel, S. Schmidt and T. Teufel, C2 Compiler Concepts. Springer-Verlag, 1993. [51] D. Ingalls et al, Fabrik: a visual programming environment. Proceedings ACM OOPSLA 1988, Sept. 1988, pp.176-190. [52] D. D. Hils, DataVis: a visual programming language for scientific visualisation. Proceedings of the 1991 ACM Computer Science Conference, San Antonio, Texas, March 1991, pp.439-448. [53] A. V. Aho, R. Sethi and J. D. Ullman. Compilers - Principles, Techniques and Tools, Addison-Wesley, 1986. [54] P. Naur (Ed). Revised Report on the Algorithmic Languag ALGOL60, CACM Vol. 6, 1963. [55] K. Marriott, Constraint Multiset Grammars. Proceedings of the IEEE Symposium on Visual Languages, Oct. 1994, pp. 118-125. [56] W3 Consortium, XML, w3.org.
85
Appendix A API Documentation Class GeoGenericMultiBandImage Used to represent different kinds of geo-images. Field Details private SimpleGSImage[] buffers Array of SimpleGSImages to hold the bands of pixel data. private String type Name of the format type. private GIAS.DAG metadata DAG to represent the metadata. private String primitive The primitive data type of the pixel data of SimpleGSImage. May be either integer, float, double and longint. private int bands The number of bands. Constructor Details public GeoGenericMultiBandImage( SimpleGSImage[] buf, String type, GIAS.DAG md, String p) Parameters: p – primitive type buf – pixel data type – geo-image type GIAS.DAG – metadata. Method details 86
public SimpleGSImage[] getAllBands() Returns an array with all the bands of pixel data. public void setAllBands(SimpleGSImage[] allbands) Set all bands to allbands. public String getType() Returns the primitive pixel data type. public void setType(String name) Set the primitive pixel data type to name. public GIAS.DAG getMetaData() Returns a GIAS.DAG that represents the metadata. public void setMetaData(GIAS.DAG inmetedata) Set the metadata to inmetadata. public SimpleGSImage getBand(int n) Return the nth band of pixel data. public void setBand(int n, SimpleGSImage simg) Set the nth band to simg. public Object getAttribute(String name) Return the attribute data of name. public void setAttribute(String name, Object value) Set the attribute name to value.
Class Machine Represents a server’s details such as hostname and portnumber. Field Details private String hostname The name of this machine private String portnumber Port number to this machine. private String edgelabel From this machine perpective, the edge label on an in-coming edge. private int thisPC The program counter for this machine. Maps this machine to a Node object in the ‘compiled’ Nodes. Constructor Details 87
public Machine(int p, String h, String l, int pc) Parameters: p – port number h – host name l – incoming edge label pc – maps this machine to a Node. Method details public String getHostName() Returns the hostname. public int getPortNum() Returns the port number. public String getEdgeLabel() Returns the incoming edge label for this machine. public int getPC() Returns the program counter associated with this instance of a Machine.
Class Node Node class encapsulates all the information necessary to represent a node in our program graph. Field Details private boolean hasException Set to true when an exception has been raised during the operation of this Node’s associated operator. private boolean visted Set to true when this Node has been executed. private String opname Name of the operator associated with this Node private int inparams Number of parameters to the operator opname private int int outedges Number of alternative path that the resulting object can take. private int instrMap Used to index the toolbox (array of Operators) and obtain the Operator object of type opname 88
private Vector errmsg Contains error messages that are raised private Machine[] toMachines Array with all the details of the destination machines Constructor Details public Node(String opn, Machine[] m, int in, int map) Parameters: opn – name of the operator m – destination machine in – number of incoming parameters map – index to the Operator opn in toolbox Method details public Vector getErrMsgs() Returns a vector of string of error messages. public addErrMsg(String s) Add an error message. public boolean hasExceptionRaised() Returns true if an exception has been raised; false otherwise. public void setException() Sets the exception flag to true. public boolean hasVisited() Returns true if this node has been executed; false otherwise public void visited() Set the visited flag to true. public Machine[] getDestMachines() Returns an array with all the destination mcahines from this node. public int getNumOfInParams() Returns the number of incoming parameters to this node. public int getNumOfOutParams() Returns the number of outgoing edges. Equals to the length of toMachines. public int getOpMapIndex() Returns the operator map index.
Class Result 89
Result class is used to wrap the data and destination machine. Produce after the execute method in class Operator. Field Details private Object data Object to store the data returned after executing an operator. private Machine destination The destination machine for this data. private String type The type of the data. Constructor Details public Result(Object d, String t, Machine m) Parameters: d – data object m – destination machine t – data type Method details public Object getData() Returns the data object. public String getType() Returns the data type. public Machine getDestination() Returns the destination machine.
Class Parameter Result class is used to wrap the parameter data and other information that is needed to pass to the server. Field Details private Object data The parameter data private String type Parameter data’s type. Can only be one of defined data types. private String edgelabel 90
The edge label on which this data has arrived on. Constructor Details public Parameter(Object d, String t, Machine m) Parameters: d – data object l – parameter edge label t – data type Method details public Object getData() Returns the data. public String getType() Returns the data type. public String getEdgeLabel() Returns the edge label.
Class MessageOnEdge The servers receive objects of this class. It contains all the information the server needs to process the data and send onto the next server. Field Details private Node[] nodes An array containing all the nodes of the entire program graph. The server knows which node it is up to by using the field currentPC as an index. private int currentPC The current program counter private Parameter current The input parameter data. private boolean exceptionraised Set to true when the program has raised an exception. private Operator[] toolbox An array containing all the Operator classes needed by the program. toolbox is like a routine library which the entire program uses.
91
Constructor Details public MessageOnEdge(Node[] n, Operator[] ops, int pc, Parameter p) Parameters: n – ‘compiled’ nodes l – program toolbox t – current program counter p – current input parameter Method details public int getCurrentPC() Returns the current program counter. public void setCurrentPC(int pc) Set the current program counter to some new value. public Operator[] getToolBox() Returns the program toolbox. public Node[] getNodes() Returns an array of the ‘compiled’ nodes of the entire program graph. public Node getCurrentNode() Returns the current node that the program counter is at. public Parameter getParam() Returns the input parameter. public Operator getCurrentOp() Returns the current operator.
92
Appendix B - User Manual B.1 Visual Programming Environment (VPE) B.1.1 Starting the VPE To start, user enters at the prompt: >java Rundimpl The user should then see the VPE as shown in figure B.1.
Figure B.1: Screen shot of VPE when first loaded.
93
B.1.2 Creating programs To create a program, the user drags and drops operators from the palette onto the workspace. The operators are connected by arrows to indicate dataflow by first selecting the tails operator while holding down the CTRL key. The operator should be highlighted in green as shown in figure B.2. To deselect this operator, the user clicks the operator while holding down the ALT key.
Figure B.2: Creating arrows between operators
B.1.3 Arrow Labels To add arrow labels, the user right clicks the mouse button over an arrow. A dialog box appears as shown in figure B.3.
94
Figure B.3: Edge label dialog box
B.1.4 Entering and viewing data Data can be entered through the input data icons by right clicking the mouse button. A pop-up menu appears as shown in figure B.4. The user selects Input Data option and a dialog box appears in which a user may select an input data type and enter a value or filename.
Figure B.4: Input data dialog box After finishing executing, the user is notified that data has arrived by highlighting of the output data portal. The output data can then be viewed by selecting Output Data from the pop-up menu.
B.1.5 Selecting remote hosts To specify which host an operator is to be calculated on, the user right-clicks over an operator. The selects the Hosts option from the pop-up menu. From the dialog box shown in figure B.5, the user enters the hostname and port number of the machine on which a server is running. 95
Figure B.5: Host information dialog box
B.1.6 Compiling and Running To compile a program, a user clicks the COMPILE button above the workspace. If any syntax or type errors occur, the points which the errors have occurred are highlighted in red as shown in figure B.6. The compile errors are viewed by right clicking over the highlighted icon and selecting Messages from the pop-up menu.
Figure B.6: Parse or type error. To run the program, the user clicks the RUN button and is notified of when the data has returned when the output data portal(s) have been highlighted green.
96
B.2 Starting up the server A server is started by firstly logging into the remote machine on which the server is to be run, and then typing at the command prompt >java ServerImpl port where port is the port number on which the server listens on.
97


![Distributed Image Processing [From the Guest Editors]](https://m.moam.info/img/260x300/distributed-image-processing-from-the-guest-editor_59a67fe21723dd0b40ac9bde.jpg)