Indonesian Journal on Geoscience Vol. 2 No. 1 April 2015: 1-21
INDONESIAN JOURNAL ON GEOSCIENCE Geological Agency Ministry of Energy and Mineral Resources Journal homepage: h�p://ijog.bgl.esdm.go.id ISSN 2355-9314 (Print), e-ISSN 2355-9306 (Online)
Developing a Geoinformatic-engineering Stability Modeling Method, using Field Data and GIS Environment: A Case Study from Al Qarara Area in Wadi Musa, Jordan Mohammad Al Farajat1, Abdullah Diabat2, Hussein Al Hassanat3, Mohammad Ibweni4, and Jamal Shawaqfeh4 Al Hussein Bin Talal University 2 Al al- Bayt University 3 Petra Development and Tourism Region Authority 4 Natural Resources Authority
G
1
Corresponding author:
[email protected] Manuscript received: January 06, 2015, revised: January 12, 2015, approved: February 20, 2015, available online: March, 26, 2015
IJ O
Abstract - By applying detailed geological field surveys, the spatial factors affecting geo-engineering stability were used to develop a geo-engineering stability modeling method to identify areas under potential threat of landsliding. The factors affecting geo-engineering stability in Al Qarara area in Petra-Jordan were studied and given assumed rates of importance, where optimization process was run by lag iterations; the produced spatial layers of the different factors were gathered and modeled using GIS; a final stability map was produced using an optimized equation. The produced map was validated qualitatively and quantitatively, where a comparison was made between the reality in the field and several maps of different equation. The modeling method which was developed in the context of this study proved to be suitable to produce micro-zonation maps of areas having landslide risk. Further applications on the method in other areas suffering landslides will further improve it. Keywords: geo-engineering stability, landslide, developing modeling method, GIS, spatial modeling, field mapping
How to cite this article: Al Fajarat, M., Diabat, A., Al Hassanat, H., Ibweni, M., and Shawaqfeh, J., 2015. Developing a Geoinformatic-engineering Stability Modeling Method, using Field Data and GIS Environment, A Case Study from Al Qarara Area in Wadi Musa, Jordan. Indonesian Journal on Geoscience, 2 (1) p.1-21. DOI:10.17014/ijog.2.1.1-21
Introduction
In Jordan, landslides affect many main roads and residential areas, especially during or after periods of heavy rain and snow falls or melts; clayey-marly formations with topographic differences in the country lead to that. Wadi Musa is located to the southern part of Jordan City, where to the eastern part of the city, the worldwide well known Petra Archaeological Park (PAP) occurs. Accelerating growth of population in this city which is due to the improvement of economic situations leads to increasing demand on lands for building and residential expansion.
Increasing residential and different land use expansion, made the Petra Development and Tourism Region Authority (PDTRA) through the Directorate of Studies and Planning, to investigate the area of Al Qarara according to its geo-engineering stability. Commissioner of Local Community Development and Environment (correspondent author, geologist) headed the technical committee and the team of the study in its different phases. PDTRA was in a crucial need to develop a geoinformatic-engineering stability modeling method, using field data and GIS environment, which can be used for similar investigations in the future.
IJOG/JGI (Jurnal Geologi Indonesia) - Acredited by LIPI No. 547/AU2/P2MI-LIPI/06/2013, valid 21 June 2013 - 21 June 2016
1
Indonesian Journal on Geoscience, Vol. 2 No. 1 April 2015: 1-21
as these may affect man-made structures and natural features such as drainage systems (Attenwell and Taylor, 1984). However, human activities can lead to either an increase in some of these phenomena, such as landslides or hillside development, or the reduction of the possibility of landslides by means of stabilizing structures or techniques on naturally sensitive slopes. In recent years, the assessment of landslide hazard and risk became a topic of major interest for both geoscientists and engineering professionals as well as for community and local administration in many parts of the world (Aleotti and Chowdhury, 1999). The main elements of risk assessment system are presented in Figure 1.
G
Geological outcrops in the city are mainly composed of carbonate rocks mixed in with different ratios of clays. Beds of clayey limestone, marl, clayey marl, and marly limestone are dominant in the different rock units of the area, where fractures, fissures, and joints are internal structures distinguishing the rocks. Landslides can be natural or man-made and may be formed by addition of material on top soil during the construction of earth dams and embankment, or by removal of material, like excavation during road and railway constructions, and/or any civil construction (Sharpe, 1938). Slopes in their final state should remain stable, but they are usually dynamic-evolving systems. Materials on non-stable slopes are constantly moving down the slope at rates that vary from unnoticeable creep of soil and sediments to landslides and rock falls that move at tremendous speeds. According to Sharpe (1938), the main factors that contribute to mass movements along slopes are: thickness and type of soil cover vegetations, type of exposed rocks, influence of surface and subsurface water, nature of stratifications, structural conditions, weathering processes, seismic activity, and man-made excavations. Down slope movements of soils and rocks under the action of gravity are of special concern
IJ O
Landslides Causes of landslides Rainfall contributes to increase in pore water pressure, which increases shear stress. During intense rainfall events, the variations in pore water pressures distributed within the soil are highly variable depending on the hydraulic conductivity, topography, degree of weathering, and fracturing of the soil. Increase in pore water pressure may be directly related to rainfall infiltration and percolation or may be the result of the build-up of a perched or groundwater table (Terlien, 1998). In low-permeability soils slope failures are caused
Landslide risk assessment
Currently stable slopes
History of landsliding
Currently unstable slopes
No history of landsliding
Quantifying extent of movement
Effect of development
Is risk low, moderate or high? Quantitying risk
Effect of development with and without controls
Cost of assessment Cost of controls
Figure 1. Flowchart showing the main elements of the risk assessment system (after Aleotti and Chowdhury, 1999).
2
Developing a Geoinformatic-engineering Stability Modeling Method, using Field Data and GIS Environment: A Case Study from Al Qarara Area in Wadi Musa, Jordan (M. Al Farajat et al.)
Chowdhury (1978) classified slides according to their causes into: 1. Landslide arising from exceptional causes such as earthquake, exceptional precipitation, severe flooding, accelerated erosion from wave action, and liquefaction. 2. Ordinary landslides, or landslides resulting from known or usual causes which can be explained by traditional theories. 3. Landslides which occur without any apparent cause. Geographic Information System is software for managing, processing, and analyzing the spatial data (including map-related picture, image, text, and data), used in different fields. Recently, this tool with a lot of options was improved. GIS can be simply used for memorizing, visualizing, querying and overlaying of maps, also for combining various analyses, comparing various attribute data and therefore solving problems which are difficult (Longley et al., 2001). GIS is important in assessing landslide hazard maps where the probability, location, and frequency of expected landslide can be predicted (Zolfaghari and Heath, 2008).
G
by long duration-moderate intensity rainfall events. In fact, the reduction in soil suction and the increase in pore water pressures due to antecedent rainfall is considered to be a necessary condition for landslide occurrence (Sanderson et al., 1996; Wieczorek, 1987). In addition, there are other factors triggering land sliding e.g., the presence of fractures, undercutting of weak materials, and the presence of marly materials that causes rotational movement. Human activities e. g. removing the lateral support such as cut for roads and canals, as well as removing trees and vegetation are participating in landslides.
IJ O
Classification of landslides Gravity produces a component of stress, directed downwards on the material in every natural or artificial slope. Slope processes are down slope movements of solid earth materials in response to stresses produced by the geometry of a slope and the force of gravity. These processes have been called Mass Wasting or Mass Movement by geomorphologists, or more popularly, landslides. These terms can be confusing if they are not fully defined each time they are used. Varnes (1972) suggested that slope movement can be used as a comprehensive term for any down slope movement of earth materials. Slope movement classification systems can be based on many features or characteristics, such as type of material moved, geometry of the failure, mechanics of deformation, type of movement, rate of movement, or a combination of the above. Each of these features or characteristics can be related to the prediction, prevention, and control of slope movements. Varnes (1978), developed a classification system of landslides based on the type of movement, in addition to the type of material which is used as a secondary classification tool. This system has the advantage that the features used to classify slope movements are preserved, thereby making classification of past events possible. In addition, classification based on type of movement also establishes the characteristics of the mechanism of deformation, which is important in the analysis of slope stability.
Previous Studies Different geological and geotechnical studies have been carried out covering different parts of Jordan. Several landslides studies took place along different sections of the Old Jerash-Irbid highway. Dames and Moore (1993) investigated the Amman- Jerash- Irbid highway and concluded that the slope stability problems along this highway are attributed to the presence of a very weak and friable interbedded sediments and their sensitivity to fluctuations in water content. Abderahman (1994) presented the effect of geological structures on the stability of slopes and rock falls in the Zarqa River Valley. Mansour (1994) evaluated the stability of slopes along the Amman- Jerash- Irbid highway on the basis of geological and geotechnical data. He concluded that the studied slopes are prone to sliding. Abderahman (1996) carried out a detailed study of landslides along Jerash-Amman highway. Al Basha (1996) studied four landslide sites along the highway and concluded that the 3
Indonesian Journal on Geoscience, Vol. 2 No. 1 April 2015: 1-21
industrial gypsum wastes for its stability hazard in the industrial area of Aqaba, the produced geophysical results were modeled using GIS. A combined seismic refraction and geomagnetic surveys were used. Studied Area In 2000, Petra Region Authority (former name of PDTRA) planned land use units of the city of Wadi Musa, Dar Al Handasah Consultants (the firm which developed the plans) classified the area of Al Qarara as a free area, and this was attributed to the presence of potential landslide risk, but the study presented no further details. Al Qarara is located in the central part of Wadi Musa, at the end of Wadi Zurraba catchment area, which extends along more than 8 km in a northeast-southwest direction. The area of the interest is 0.142 km2. Al Qarara drains a catchment area which reaches to around 30 km2, and witness flash floods in winter when thunder storms forms; this exposes some parts of the area for potential risks of landslide as the drainage path is toward it (Figure 2).
IJ O
G
studied slopes are unstable to partially stable and may have many wedge failures. Al- Homoud et al. (1999) studied the effect of rainfall on the instabilities of slopes along the highway and suggested some of remedial treatments. Malkawi et al. (2000) used remote sensing and GIS techniques to create a mass-movement hazard zoning map along the Amman-Jerash-Irbid highway depending on landsat images TM (Thematic Mapper). El-Naqa (2006) made a SINMAP terrain stability model along Amman-Jerash-Irbid highway. Muhaidat (2010) conducted stability analysis of slopes along As-Salt Wadi Shueib Road and suggested corrective measures to support the stability of non-stable slopes in the area. Al Farajat (2002) derived microzonation map of the city of Aqaba for its groundwater pollution vulnerability using GIS for landuse planning purposes. He mapped and digitized natural geological settings of the city to build the data base, where different vulnerability indexes were used. In 2008, Al Farajat used GIS in building microzonation map of the hills of the secondary
N 30o 18' 48'’
E 35o28' 08'’
Figure 2. Locality map of the studied Al Qarara area (black lines), and Wadi Zurraba catchment area (red dashed lines) with its drainage pattern (blue lines).
4
Developing a Geoinformatic-engineering Stability Modeling Method, using Field Data and GIS Environment: A Case Study from Al Qarara Area in Wadi Musa, Jordan (M. Al Farajat et al.)
Na'ur Formation Fuheis Formation Hummar Formation Shueib Formation Wadi As-Sir Formation From the detailed field survey and the aid of the available geological maps and reports and using GIS, it was possible to produce a geological map of the study area with a scale of 1:2000 (Figure 3).
1. 2. 3. 4. 5.
Na’ur Limestone Formation (Cenomanian) This is the oldest formation which outcrops in the area; and reaches a thickness of about 60 - 75 m. It consists of two massive carbonate units up to 15m thick, which comprise massive, nodular, light grey, brown dolomitic limestone, with abundant Thalassinioides burrows and oyster bivalves. The strata interbedded between these unit comprise alternating thin beds of yellow-buff algal laminated micrite green-grey, pink marl, grey buff, nodular dolomite and sandstone; corals, echionoids, bivalves, gastropods are common. The transitional beds and the overlying carbonate platform indicate a change from a restricted shallow-marine to full marine, subtidal environment of deposition (Powell, 1989). In the studied area, this formation outcrops with a thickness of 15 m in the close wadis. The beds of the upper parts of this formation are outcropping in some parts of the wadis in the studied area; and they tend to be composed of clayey marl. The upper parts of the formation are mechanically brittle and inflexible, and they are highly affected by rocks overlaying them. After precipitation events, the rocks tend to swell and then to be shrink when the water leaks out. With the presence of structural deformations and effect of gravity, the upper parts of this formation in the studied area are fractured and jointed, forming zones of risk at the limps of the wadis and steep slopes, that led to toppling and rock fall phenomena (Figure 4).
IJ O
G
In this study, the authors attempted to use GIS techniques along with field data to develop a landslide hazard identifying method, and to produce hazard microzonation map of this hazard in the studied area. The method will identify and delineate unstable areas, to help planners to choose favorable locations in locating development schemes. Detailed geologic field surveys and direct measurements on the beds, besides the available geological reports on the area and the high resolution digital elevation models (DEM), will assist in building the spatial data of the studied area. The team of the study evaluated the geology of the studied area due to its different aspects; stratigraphy, lithology, structures, dip of the layers, and topographic slopes. These aspects were digitized, given coordinates using GPS, tabulated and exported into GIS environment, where spatial layers were produced from them using GIS modeling. Each layer was reclassified using assumed weights, where optimization process was run by lag iterations, and the layers were gathered by an optimized multiplication formula, and at the end the stability map was produced. The produced map was validated qualitatively and quantitatively, where a comparison was made between the reality in the field and several maps of different equation.
Methodology
Geology
Stratigraphy The outcropping rocks in the study area are related to the Upper Cretaceous rocks. Quennell (1951) divided the Upper Cretaceous into two groups; involving the Ajlun Group (lower part) and the Belqa Group (upper part). Those outcropping rocks of the area belong to the Ajlun Group, consisting mainly of carbonate rocks. The thickness of the sequence which is ranging in age from Cenomanian to Turonian is over 800 m in north Jordan and Azraq Basin and decreases toward southeast. The Ajlun Group is sub-divided into the following formations (from bottom to top):
Fuhays/ Hummar/ Shu’ayb (Undifferentiated) (Cenomanian-Early Turonian) This formation is about 80 m thick; it consists of greyish green, pink, red calcareous siltstone5
Indonesian Journal on Geoscience, Vol. 2 No. 1 April 2015: 1-21
737700
737850
737800
737750
737900
737950
738000
738050
738100
738150
738200
3358050
3358000
3357950
N
3357900
3357850
0
25
100
50
150 m
G
3357800
3357750
3357700
3357650
IJ O
3357600
3357550
LEGEND :
3357500
Overburden
Wadi sediments
3357450
Thick soil
Marly and Clayey Limestone F/H/S
3357400
Hard Limestone
Street
3357350
Slope
Dextral fault Rock fall
3357300
Fault with vertical throw
Figure 3. Geological map of the studied area showing the different stratigraphic units and structures, with a scale of 1:2000 using GIS modeling.
mudstone, thin bedded yellow-buff fossiliferous marl, marly limestone, banded gypsum with green and red mudstone, and multicoloured sandstone beds. The depositional environment ranges from open marine to supratidal (Powell, 1989). The formation tends to swell with the presence of water, and to be shrink when the water leaks out. The majority of the buildings of the studied area are extended over this formation. 6
Because of its ability of swelling and shrinking, the houses and structures are exposed to cracking, where some displacements or creeping took place, especially with structures of weak foundations. Holocene Sediments The thick soil layers covering-different rock units, especially Fuhis/Hummar/Shuaib, are Holocene sediments, and they are found in the
G
Developing a Geoinformatic-engineering Stability Modeling Method, using Field Data and GIS Environment: A Case Study from Al Qarara Area in Wadi Musa, Jordan (M. Al Farajat et al.)
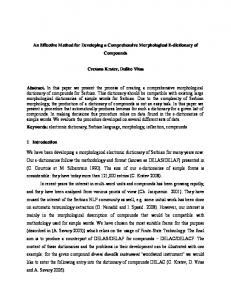
Figure 4. Toppling and rock falls in the studied area.
plane in the rock mass (Kersten, 1990). Shear and tension joints are frequently associated with major faults and when formed along a fault they are frequently referred to as feather joints because of their appearance. Intraformational shears that are, zones of shearing parallel to bedding, are also associated with faulting. Their presence means that the strength of the rock along the shear zone has been reduced to its residual value (Bell, 1993). Faults are most prominent in the harder rocks, which yield to stresses by fracturing, in contrast to soft rocks which yield by deformation. In some cases, where a fault runs parallel to the wall of cutting, the rocks up to the fault can be removed, and the fault surface left as the final slope face (Blyth, 1946). Goodman (1980) defined joints as regularly recurring fracture surfaces, usually planar, cutting across the rock with constant orientation and mean spacing from as little as centimeters to as much as several meters. Bell (1993) also defined joints as fractures along which no displacement has occurred and they are present within all types of rock. Joints are present in all competent rocks within the surface, at all orientations. Joints are many thousands of times more frequent than faults. Indeed, it is rare to find cubic meter of rock that does not contain any joint.
IJ O
eastern part of the studied area, and they are composed of clay/carbonate-marl soil fragments, containing small pieces of rocks with different sizes. These sediments found in the lower parts of the studied area, were derived from the higher ones. While the streams and wadis contain recent beds of mixed gravel, sand, and clay, with bad sorting. Under rainfall conditions, some landslides and erosions can occur in the streets and roads (Figure 5). In addition to the natural deposited recent sediments, there are man-made sediments resulted from cutting/filling processes, digging, and overburden (Figure 6).
Geological Structures Geological structures play a dominant role in the behavior of slopes; therefore, they are of primary importance for engineering geologists and geotechnical engineers. Especially in sedimentary rocks; the succession, thickness, and attitude of beds, other major and minor structural features such as folds, faults, and joints are of direct relevance to cause potential instability. These features also help in understanding slope development processes, formation of valleys, escarpments, and the development of residual soils. It is assumed that a fault is induced when deviatoric tectonic stresses produce a shear stress that exceeds the shear strength on a particular
7
Indonesian Journal on Geoscience, Vol. 2 No. 1 April 2015: 1-21
b
c
d
IJ O
G
a
Figure 5. Registered landslides (a, c) and erosions (b, d) in the streets and roads of the studied area. a
b
c
d
Figure 6. Digging (a, b) and overburden (c, d) engineering operations in the studied area.
8
Developing a Geoinformatic-engineering Stability Modeling Method, using Field Data and GIS Environment: A Case Study from Al Qarara Area in Wadi Musa, Jordan (M. Al Farajat et al.)
ing material in discontinuities may hinder natural drainage because of the presence of a significant proportion of fine clayey material, of an extremely low permeability, which results in building up of pore water pressures (Muhaidat, 2010). Thus stability is decreased due to two reasons (Chowdhury,1978), those are: 1. Reduced strength along discontinuities due to the presence of filling material. 2. High pore water pressures due to decreased natural drainage.
Geologists and engineering geologists believe that studying joints and their origins can provide valuable clues to the history of tectonic processes in near-surface rocks and also to understand slope stability problems (Priest, 1993). Joints originate from extension strain (stretching) and from shear. In the latter case, each joint is like a minor fault in the rock, and for some reasons the offset that might have occurred on one or several surfaces was dispersed on hundreds or thousands of years. Shear joints tend to be closed, whereas the extension joints are opened (Muhaidat, 2010). These openings are often filled with gouge or detrital material or chemical cements. The influence of filling material on the shear strength of a joint depends on the thickness of the filling materials (Goodman, 1993), where the shear strength is continuously reduced with the increase in filling thickness. Once the filling thickness exceeds the amplitude of the surface projections, the strength of the joint is controlled by the strength of the filling material. Additionally, the presence of fill-
Results
IJ O
G
The studied area lies within the highlands to the east of the southern segment of the Dead Sea Transform (DST). The southern segment of the DST is the Wadi Araba active strike-slip fault. It extends from the southeastern corner of the Dead Sea to the Gulf of Aqaba with a general N-S trend (Figure 7). The DST is 1100 km long and connects the Gulf of Aqaba-Red Sea
35 o
34 o
37 o
36 o
39 o
38 o
Mediterannean Sea
Damascus
33 o
33 o
Irbid
Amman
Azraq
Dead Sea
32 o
32 o
31
31 o
N
o
Petra
30 o
Ma’an Fault
30 o
Studied area Aqaba Aqaba
29 o 25
50 km
Gilf of
0
34 o
35 o
36 o
37 o
38 o
Figure 7. Structural pattern map of Jordan (Diabat and Masri, 2005).
9
Indonesian Journal on Geoscience, Vol. 2 No. 1 April 2015: 1-21
been no main faults detected, but some secondary faults were registered with normal throws, one of them was accompanied with a vertical dextral movement, besides some rock slides. Stability modeling The factors which control geo-engineering stability in Al Qarara area were given assumed rates of importance; the produced spatial layers of the different factors were gathered and modeled using GIS. A final stability map was produced by gathering the layers of the factors using an assumed equation. To validate the results of the model with the reality in the field qualitatively and quantitatively, space image and direct field measurements were used. Second phase of field survey was allocated for validation purposes, where the produced risk map was studied in the field by direct comparisons in the different parts of the studied area. Excellent correlation and fitting was found between what was on the map, and what was investigated in the field from an engineering point of view.
IJ O
G
spreading system to the convergence zone in the Taurus – Zagros Mountain. The DST is the major tectonic feature controlling the geological and geomorphological evolution of the region since the Miocene (Garfunkel, 1981). The DST was formed as a result of the northward sinistral movement of the Arabian plate associated with the opening of the Red Sea (Garfunkel et al., 1981). The movement started in the Miocene and is still active in the present times (Quennell, 1959; Eyal , 1996) . This fault system is responsible for the formation of different structures in Jordan and the studied area. Because of its key position in the geology of the region, the Dead Sea and its margins have been the subject of many detailed mapping and regional structural studies (e.g. Quennel, 1951, 1958, 1959,1983; Bender, 1968; Freund et al., 1968; Garfunkel, 1981; Kashai and Croker, 1987). Comprehensive structural studies were based on small-scales or mesostructures ( e.g. Eyal and Reches, 1983; Ron and Eyal 1985; Eyal,1996; Atallah, 1996; Zain Eldeen et al., 2002; Diabat, 1999, 2009, 2013; Diabat et al., 2004). The city of Wadi Musa overlooks Dead Sea Transform Fault System, which affected the topography of the area, and resulted in topographic difference in Wadi Musa with more than 500 m. Consequently, the outcrops of different rock formations from different ages are dominant in the city and its surrounds. Several structural features in Wadi Musa are a result of the transform fault system of the Dead Sea, and these include faults and folds of different forms, directions, and throws. Wadi Musa was affected by several main faults; the most important one is the Wadi Musa sinistral transform fault, which is extended northeast-southwest and is the result of the Dead Sea Transform Fault System. Then, the area of Wadi Musa was affected by two faults extended north-south to the eastern part from Wadi Musa Fault. All of the named faults are crossing Wadi Musa and they caused deformations in the different-rock units, affecting its stability. No main folding systems are dominant in Wadi Musa. From the previous explanation, it is obvious that Wadi Musa City itself was formed as a result of mega landslide event, which in turn led to sublandslides. In Zuraba and Qarara areas, there have
10
Lithology Lithology was considered in this study as an essential factor for the stability of the rocks and their suitability for building and different engineering purposes. Four main types of rocks were found in the studied area, each type was given a rate. Table 1 shows the method to which field data were processed and given rates (example on slope and lithological data), where optimization process was run by lag iterations to reach at these rates to simulate the study area in respect to its stability situation in the field. Hard limestone rocks of the Naur Formation were considered suitable for different engineering purposes. For that, they were given high rate, while marly limestone and clayey limestone were considered as not suitable, and they need engineering processing before any construction. On the other hand, thick soil and wadi sediments were considered less suitable and were given lowest rate (Table 2, Figure 8). Overburden and wadi sediments were excluded for their location in the studied area, which do not permit engineering construction on them.
Developing a Geoinformatic-engineering Stability Modeling Method, using Field Data and GIS Environment: A Case Study from Al Qarara Area in Wadi Musa, Jordan (M. Al Farajat et al.) Table 1. The Method to Which Field Data were processed and given Weights (example on slope and lithological data) FID Structure
Weight 1
FID Litho
1
1
6
25
10
6
2 3
1
6
26
10
2
6
26
10
4
3
3
27
5
4
6
28
6
11
6
35
10
7
12
6
36
10
8
19
6
49
9
25
10
26
10
25
10
27
11
25
10
27
12
25
10
13
25
10
15
25
10
16
25
10
17
25
10
19
25
10
20
25
10
21
25
10
Weight
Weight12
SHAPE Length
SHAPE Area
Final Weight
F/H/S
3
262.1015
2107.852
180
7
Soil
1
121.2814
7.179443
60
7
Soil
1
454.8537
3821.625
60
1
8
NL
10
177.2591
1082.773
30
10
9
F/H/S
3
292.5462
2714.635
180
16
Soil
1
220.5902
2376.339
60
17
Soil
1
893.3948
11336.09
60
3
8
NL
10
147.3271
1265.571
180
10
7
Soil
1
12.21932
1.437249
100
1
8
NL
10
1526.525
14909.58
100
1
19
F/H/S
3
249.3951
1390.59
30
29
10
10
F/H/S
3
364.9448
3135.387
300
30
10
11
F/H/S
3
237.7739
2727.872
300
32
10
13
F/H/S
3
213.5184
2117.002
300
32
10
15
NL
10
97.31339
612.4998
1000
33
10
14
F/H/S
3
89.1088
360.2782
300
38
10
19
F/H/S
3
598.9739
7865.341
300
39
10
20
F/H/S
43
1
32
NL
Lithology
G
FID Dip Slope
IJ O
OBJECT ID
3
719.9696
11880.22
300
10
824.6052
6975.344
100
22
25
10
44
10
32
NL
10
215.1645
1879.678
1000
25
25
10
56
6
32
NL
10
128.7507
653.0229
600
26
27
6
30
10
11
F/H/S
3
237.4323
2282.032
180
27
3
3
27
1
8
NL
10
6.98771
0.000542
30
28
25
10
27
1
8
NL
10
6.98771
0.000542
100
29
0
0
0
0
0
Street
0
2951.865
12060.34
0
30
0
0
0
0
0
Street
0
534.8386
3008.504
0
31
0
0
0
0
0
Street
0
120.4162
481.0096
0
36
0
0
0
0
0
Street
0
534.8386
3008.504
0
37
0
0
0
0
0
Street
0
120.4162
481.0096
0
Table 2. The obtained Typical Rating Values of Each Factor after Lag Iterations Lithology
Hard limestone
Rate 10
Structural Condition
Low faulting
Rate
Slope/dip
Rate
10
30 o
1
From the table, it is obvious that there is no medium value between the hard limestone (which was given the highest rate), and the clayey marly limestone, which was given the lowest rate, and this is attributed to that there was no rocks in the studied area to have lithology of a hardness value middle between the two mentioned rock types.
Structural values It is meant by structural settings for this study the extent to which the rocks got affected by faults, cracks, and joints, besides the rock fragility. The blocks of the rocks of the studied area which are located close to the wadis have no 11
Indonesian Journal on Geoscience, Vol. 2 No. 1 April 2015: 1-21
737700
737750
737800
737850
737900
737950
738000
738040
738100
738150
738200
3358050
3358000
N 3357950
3357900
0
25
50
100
150 m
3357850
3357800
G
3357750
3357700
3357650
3357600
IJ O
3357550
3357500
3357450
3357400
3357350
Legend:
Street
Weight 1: Soil 3: Marly and clayey limestone 10: Hard limestone
3357300
Figure 8. Produced map of the lithologically rating with a scale of 1:2000 using GIS modeling.
lateral support, for that they can show faulting, while the blocks of the rocks within beds of high dip values tend to have faults more than those within beds of low dip values (Table 2; Figure 9).
Topographic Slope and Dip Values Topographic slope is the angle of the land surface forms with the horizon, while dip is the angle of the bed forms with the horizon. In this study, a high resolution digital elevation model (DEM) with 30 m grid resolution was used to 12
visualize the area in 3-D, and to derive its slope. It was noticed that all values of the topographic slopes are in accordance with the dip values, and for that they were merged with each other. Highest and lowest slopes were measured, and accordingly weights were given (Table 2; Figures 10 and 11). Building the Risk Map of Landslide Relative stability used here means the range of stability between the different sub-areas in the studied area, depending on the conditions
Developing a Geoinformatic-engineering Stability Modeling Method, using Field Data and GIS Environment: A Case Study from Al Qarara Area in Wadi Musa, Jordan (M. Al Farajat et al.)
737700
737750
737800
737850
737900
737950
738000
738040
738100
738150
738200
3358050
3358000
N
3357950
3357900
3357850
0
25
50
100
150 m
3357800
3357700
3357650
3357600
IJ O
3357550
G
3357750
3357500
3357450
Legend:
Street
3357400
3357350
Weight 1: Highly faulted 3: Faulted 6: Medium faulted 10: Low faulted
3357300
Figure 9. Produced map of the structural rating with a scale of 1:2000 using GIS modeling.
of the geo-stability factors mentioned before. After multiplication of the produced layers, areas found with stability products between 30 and 100 were classified as relatively unstable, while areas having values ranging between 180-1000 were classified as stable zones. By multiplication of the maps produced from the different factors, the stability map was produced, which clarifies the range of relative stability of the studied area. The values of stability in the map (Table 3; Figures 12 and 13) were produced by multiplication of the assumed rates
of the different factors for each pixel in the map using GIS. Several iterations were applied using lag of values (of rates and risk classes) to reach at the models of the produced layers. The produced map was validated qualitatively and quantitatively, where a comparison was made between the reality in the field and maps of different assumed equations (produced by several iterations using lag of values -of rates and risk classes-). Also overlying the produced risk model (transparent GIS colures) on satellite images of the area was useful. 13
Indonesian Journal on Geoscience, Vol. 2 No. 1 April 2015: 1-21
70 65 60 55 50 45 40
0
500
358
000
000
358
500
357
000
000
357
500
500
356
000
500
00
5 354
000
00
40
35
25
15 10
353
352
5 0
500 351
G
00
IJ O
85
00
70
35
3
00
00
50
35
00
35
3
00
35
00
35
30
35
25
45
35
00
00
35
00
0 55
35
55
35
00
65
35
40
00
60
35
00
45
00
5 56
00
6 35
55
00
75
35
0
00
0
0 80
35
slope
20
352
500
353
35
3
355
353
000
0
00
5 35
35 30
354
500
500
355
00 555
50 355600 356
354
000
356
356
00
40
35
3
00
00 515 3
5 53
00
35
20
35
Figure 10. Produced map of 3-D topography of the studied area (bottom), and the derived slope model (top). The studied area is surrounded with white rectangle.
Discussion
The quality of a landslide hazard evaluation depends on the extent that the hazards are identified and how can be understood. Coping with land topography needs well geological and geo-morphological experience of landslide kinds and landslide behaviors, and judgment. To develop a dependable geotechnical mapping method and grasping, landslide mechanisms are of a paramount importance. This leads to that the 14
quality of evaluation is normally accompanied with the practical experience of the persons who implement the field-work and the time and efforts they spend to understand the risk. Realistic quantifying of data based on experience, and understanding of the studied area, the regional hazards of the site in question, with good knowledge of the uncertainty leads to a good decision making. Depending on the obtained geological information from the field survey on the area of
Developing a Geoinformatic-engineering Stability Modeling Method, using Field Data and GIS Environment: A Case Study from Al Qarara Area in Wadi Musa, Jordan (M. Al Farajat et al.) 737700
737750
737800
737850
737900
737950
738000
738040
738100
738150
738200
3358050
3358000
N
3357950
3357900
0
25
50
100
150 m
3357850
3357800
3357700
3357650
3357600
IJ O
3357550
G
3357750
3357500
3357450
Legend:
Street
3357400
3357350
Weight Cancelled 3: > 20 6: 10 - 20 10: < 10
3357300
Figure 11. Produced map of topography/slope rating with a scale of 1:2000 using GIS modeling. Table 3. The obtained Typical Values of Stability after Lag Iterations Stability Anstable
Assumed classes 30 60 100 180
Stable
300 600 1000
Zuraba and Qarara, the range of relative stability was modeled using obtained data from the field using GIS. Several geological factors were taken into consideration to produce the stability map, including lithologial composition of the rocks, structural situation, and topographic slope of the beds. From these main factors on which the stability highly depends, assumed values (rates) were considered (from the field experience) to reach at the final stability map. Several iterations were applied using lag of values (of rates and risk classes) to reach at the models of the produced 15
Indonesian Journal on Geoscience, Vol. 2 No. 1 April 2015: 1-21
737700
737750
737800
737850
737900
738000
737950
738040
738100
738150
738200
3358050
3358000
N
3357950
3357900
0
25
100
50
150 m
3357850
3357800
G
3357750
3357700
3357650
3357600
IJ O
3357550
3357500
Legend:
3357450
Weight
Street 30 60
3357400
100
180 300
3357350
600
1000
3357300
Figure 12. Produced map of stability with a scale of 1:2000 using GIS modeling.
16
in the area include: 1. removal of vegetation covers, 2. modifications on the natural drainage system, 3. main leaking water, 4. modification on slopes with the road structures, buildings on steep terrains, and 5. vibrations from traffic and displacement of rock blocks. From the area of study, an area of 66% was found to be unstable, while stable areas form simple part of the area. Most registered landslides took place in the area, have been recorded
layers, where the values used in this study were proved to be the type values, to represent the geo-stability layers, and the produced risk map. Despite the small size of the studied area, the diversity and wide spectrum of the geological conditions led to a wide range of stabilities. Landslides in the studied area are a cause of several ways, where these were found to include saturation of sloped rocks with water from rainfall or leakage from sewerage nets, vibrations caused by previous seismic events, and undercutting of cliffs by man-made activities. The man made activities
Developing a Geoinformatic-engineering Stability Modeling Method, using Field Data and GIS Environment: A Case Study from Al Qarara Area in Wadi Musa, Jordan (M. Al Farajat et al.) 737700
737750
737800
737850
737900
737950
738000
738040
738100
738150
738200
3358050
3358000
N
3357950
3357900
0
25
50
100
150 m
3357850
3357750
3357700
3357650
IJ O
3357600
G
3357800
3357550
3357500
3357450
Legend:
Street
Weight 30 60
3357400
100
180 300
3357350
600
1000
3357300
Figure 13. Map of stability on satellite image with a scale of 1:2000 using GIS modeling.
to take place in the rainy seasons, and mostly they were within Fuhis/Hummar/Shuaib, due to the presence of clayey limestone and marl. Thick soil layers with high slopes as in the higher part of the study area led to instability, even with the presence of supporting walls. Limps of the wadis in the study area were distinguished with rock blocks having deep vertical faults, where the wadi itself was considered as an area of high risk. Due to the low stability values, PDTRA was advised not to license any building permits. The
study confirmed the old one done by Dar Al Handasah (2000), and it was advised that the area should be given permits for light uses like parks and gardens only. After validating, the results of the model show that the modeling method has proved to assess areas under risk of instability, for areas of the same geology. Further applications on the same method in other areas suffering landslides are strongly recommended. Figure 14 illustrates the steps followed in modeling the stability of the studied area. 17
18
0
50
738200
3357300
3357350
3357400
3357450
3357500
3357550
3357600
3357650
3357700
3357750
3357800
3357850
3357900
3357950
3358000
3358050
737700
25
50
Street
737850
100
3: > 20 6: 10 - 20 10: < 10
Weight Cancelled
N
737800
Legend:
0
737750
150 m
737900
737950
738000
738040
738100
738150
738200
00
3585
00
3580
00
85
35
35
7500
0
00
8 35
00
00
00 515 3
35
00
00
35
00
3357800
50
N
100
150 m
737950
Weight 1: Soil 3: Marly and clayey limestone 10: Hard limestone
Street
Legend:
25
737900
738000
738040
738100
738150
738200
3357600
3357300
3357350
3357400
3357450
3357500
3357550
0
25
737750
50
N
737800
100
737900
150 m
737850
Slope
Fault with vertical throw
Rock fall
Dextral fault
Street
Hard Limestone
Marly and Clayey Limestone F/H/S
Thick soil
Wadi sediments
Overburden
LEGEND :
737700
737950
738000
738050
738100
738150
directions.
3357300
3357350
3357400
3357450
3357500
3357550
3357600
3357650
3357700
3357750
0
737850
3357650
3357700
3357750
3357800
3357850
3357900
3357950
3358000
3358050
faults and joints, dip values and
3
35
55
35
3357850
3357900
3357950
3358000
737800
738200
and build GIS layers
00
30
35
00
50
35
737700
3358050
738150
topographic model.
3
5 52
0 50
0
00
4 35
00
45
00
65
0
5
737750
G 35
00
60
35
20
10
15
738100
area; define stratigraphy, lithologies,
20
35
00
3545
3357300
738040
(giving rates), tabulate the data
35
00
3515
00
40
35
00
3535
00
3520
00
3540
Weight 1: Highly faulted 3: Faulted 6: Medium faulted 10: Low faulted
738000
slope model from the resulted
35
0
0 45
35
00
40
00
3525
00
3535
3357350
3357400
150 m
737950
Careful study of the geology of the
00
50
35
00 3545
00
3530
slope
Street
100
737900
values into quantitative values
00
55
35
35
00
50
25
30
35
40
50
Legend:
25
737850
Translate obtained qualitative
35
0
0 60
00
3555
6500 35 6500 00 35
3560
3357450
3357500
3357550
3357600
0
N
737800
resolution DEM of the area, and build
0
50
6 35
00
3560
00 3550
00 3555
45
50
55
60
65
70
3357650
3357700
3357750
3357800
3357850
3357900
3357950
3358000
737750
Build topographic model fro, a good
35
70
00
3565
00
75
35
00 3570
IJ O
and build GIS layers.
738150
values of risks.
738100
(giving rates), tabulate the data
738040
value according to the assumed
738000
values into quantitative values
737950
Translate obtained qualitative
150 m
737900
then build the map of the resulted
100
737850
Multiply the resulted layers, and
1000
600
180 300
100
60
30
Weight
Street
N
737800
Legend:
25
737750
Figure 14. Chart illustrates the steps of process followed in modeling the stability of the studied area.
3357300
3357350
3357400
3357450
3357500
3357550
3357600
3357650
3357700
3357750
3357800
3357850
3357900
3357950
3358000
3358050
737700
737700
3358050
738200
Indonesian Journal on Geoscience, Vol. 2 No. 1 April 2015: 1-21
Developing a Geoinformatic-engineering Stability Modeling Method, using Field Data and GIS Environment: A Case Study from Al Qarara Area in Wadi Musa, Jordan (M. Al Farajat et al.)
Conclusions
2.
3.
4.
G
1.
The following points are concluded: Modeling of an area to produce microzonation maps of the landslide hazard needs a careful study of its micro-geological aspects (stratigraphy and structures). Besides using the available geologic maps and Landsat images and DEMs, field survey is an essential and primary part of such studies. GIS environment (ARCGIS) is of high importance in dealing with and building of the different layers of the stability factors and their optimized rates. Despite the developed geo-informatic modeling method proved to be in place to produce microzonation maps of landslides hazard of the study area, it is still in need for more modification and development by applying it on other areas of different geology.
leum Geologists, Division of Environmental Geosciences, 4. Al-Basha, S., 1996. Geomechanical Characterisation of rock slopes along Amman-JerashIrbid Highway. M.Sc. Thesis, University of Jordan, Amman, Jordan, Unpublished. Aleotti, P. and Chowdhury, R., 1999. Landslide Hazard Assessment: Summary, Review and New Perspectives. Bulletin of Engineering Geology and the Environment, 58, p.21-44. Al-Homoud A. S., Prior, G., and Awad, A., 1999. Modeling the Effect of Rainfall on Instabilities of Slopes Along Highways. Environmental Geology, 37, p.317- 325. DOI:10.1007/ s002540050390 Al Farajat, M., 2002. Hydrogeo-Ecosystems in Aqaba - Coasts and Region; Natural Settings, Impacts of Land Use, Spatial Vulnerability to Pollution and Sustainable Management. UniWuerzburg, Germany, Hydrogeologie und Umwelt, Würzburg, Ph.D. Thesis. Al Farajat, M., 2008. Combined Seismic Refraction and Geomagnetic Surveys on Hills of Industrial Wastes of Gypsum in Aqaba for Stability Hazards. Jordan Journal of Civil Engineer (JJCE), Jordan University of Science and Technology, Ramtha-Jordan, 3 (1). Anbalagan, R., 1992. Landslide hazard evaluation and zonation mapping in mountainous terrain. Engineering Geology, 32, p.269-277. DOI:10.1016/0013-7952(92)90053-2 Atallah, M., 1996. Joint and fault analysis in Al-Husn fold belt -northern Jordan. Abhath Al-Yarmouk, Series of Basic Sciences and Engineering, 5, p.187-201. Attenwell, P.B. and Taylor, R.K., 1984. Ground movements and their effects on structures. New York, Chapman and Hall, 441pp. Bell, F.G., 1993. Engineering Geology. Black Well Publications London, 359pp. Blyth, F. G. H., 1946. A geology for engineers. The English Language Book Society and Edward Arnold, London, 341pp. Bender, F., 1968. Geology of Jordan. Borntraeger, Berlin, 196pp. Chowdhury, R.N., 978. Slope Analysis. Elsevier Amsterdam, 423pp. DOI: 10.1177/0309133 38100500312
References
Abderahman, N., 1994. Rock Fall in Zarqa River, Northern Jordan. Abhath Al-Yarmouk, Pure Science and Engineering Series, 3 (2), p.111-122. Abderahman, N., 1996. Amman-Jerash highway Landslide (Case study: South of Jerash New Bridge. Abhath Al-Yarmouk. Pure Science and Engineering Series, 5 (2), p.177-196. Abderahman, N., 1998. Landslide at Km 56.4 Along the Irbid-Amman Highway, Northern Jordan. The American Association of Petro-
AlHussein bin Talal University is highly acknowledged for making the hardware and software available for the different phases of the preparation of this paper. Petra Development and Tourism Region Authority represented in its commissioners' council is also highly acknowledged to adopt scientific methods in dealing with natural hazards. Teams of Natural Resources Authority are acknowledged for their support in the field survey and fruitful discussion of the results.
IJ O
Acknowledgments
19
Indonesian Journal on Geoscience, Vol. 2 No. 1 April 2015: 1-21
Goodman, R.E., 1980. Introduction to rock mechanics. John Wiley and Sons, 478pp. Johnson, R.B. and Sitar, D.S., 1990. Principles of Engineering Geology. John-Wiley and Sons Inc., Canada, 497pp. Kashai, E.L. and Croker, P.F., 1987. Structural geometry and evolution of the Dead Sea– Jordan rift system as deduced from new subsurface data. In: Ben-Avraham, Z. (Ed.), Sedimentary basins within the Dead Sea and other rift zones. Tectonopysics, 141, p.33-60. DOI:10.1016/0040-1951(87)90173-9 Kersten, R.W.O., 1990. The Stress Distribution Required for Fault and Joint Development. In: Rossmanith, H.P. (ed.), Proceedings of the International Conference of Mechanics of Jointed and Faulted Rock, Vienna, Austria. Balkema, Rotterdam, 251pp. Longley, P. A., Goodchild, M. F., Maguire, D. J., and Rhind, D.W., 2001. Geographic Information Systems and Science. John Wiley & Sons, Ltd. DOI:10.1080/041431161.2011.587098 Malkawi, A., Saleh, B, Al-Sheraiadeh, M., and Hamza, M., 2000. Mapping of landslide Hazard Zones in Jordan Using Remote Sensing and GIS. Journal of Urban Planning and Development, ASCE, 126 (1), p.1-17. DOI:10.1061/(ASCE)07339488(2000)126:1(1) Mansour, Z. M., 1994. Geological and Geotechnical Studies of the Slides and Failures Along Jerash-Amman Highway. M.Sc. Thesis, Yarmouk University, Unpublished. Powell, J. H., 1989. Stratigraphy and sedimentation of the Phanerozoic rocks in central and south Jordan. Geological mapping division, natural resources authority, Jordan, Bulletin, 11, 130pp. Muhaidat, A., 2010. Stability analysis of slopes along As-Salt Wadi Shueib Road . Priest, S. P., 1993. Discontinuity analysis for Rock Engineering. Chapman and Hall. London, 473pp. DOI:10.1007/978-94-0111498-1 Quennell, A.M., 1951. Geology and mineral resources of (former) Transjordan. Colonial Geology and Mineral Resource, London, 2, p.85-115.
IJ O
G
Dames and Moore Co., 1993. Final Report, Geotechnical Studies, Irbid-Jerash Amman Highway. Unpublished. Dar Al Handasah Consultants Report on Wadi Musa City, 2000. A report submitted to Petra Region Authority, planning land use of the city of Wadi Musa. Diabat, A., 1999. Paleostress and strain analysis of the Cretaceous rocks in the eastern margin of the Dead-Sea Transform, Jordan. Ph.D. Thesis, Baghdad University, Iraq. Diabat, A. , 2009. Structural and stress analysis based on fault- slip data in the Amman area, Jordan. Journal of African Earth Sciences, 54, p.155-162. Diabat, A., 2013. Fracture systems of granites and Quaternary deposits of the area east of Aqaba: indicators of reactivation and neotectonic activity. Arabian Journal of Geosciences, 6 (3), p.679- 695. DOI:10.1007/s12517-00110389-1 Diabat, A. and Masri, A., 2005. Orientation of the principal stresses along Zerqa- Ma,in Fault. Mu,ta Lil-Buhuth wad-Dirasat, 20, p.57- 71. Diabat, A., Atallah, M., and Salih, M., 2004. Paleostress analysis of the Cretaceous rocks in the eastern margin of the Dead Sea transform, Jordan. Journal of African Earth Sciences, 38, p.449- 460. DOI:10.1016/j. jafrearsci.2004.04.002 El-Naqa, A., 2006. Application of SINMAP terrain stability model along Amman-JerashIrbid highway, North Jordan. Electronic Journal of Geotechnical Engineering, Bunde B. Eyal, Y., 1996. Stress field fluctuations along the Dead-Sea Rift since the middle Miocene. Tectonics, 15, p.157-170. DOI:10.1029/95TC02619 Eyal, Y. and Reches, Z., 1983. Tectonic analysis of the Dead Sea Rift region since the Late Cretaceous based on mesostructures. Tectonics, 2, p.167-185. DOI:10.1029/TC002i002p00167 Freund, R., Zak, I., and Garfunkel, Z., 1968. Age and rate of the sinistral movement along the Dead Sea rift. Nature, 220, p.253- 255. DOI:10.1038/220253a0 Garfunkel, Z., 1981. Internal structure of the Dead Sea leaky transform (rift) in relation to plate kinematics. Tectonophysics, 80, p.81- 108. DOI:10.1016/0040-1951(81)90143-8
20
Developing a Geoinformatic-engineering Stability Modeling Method, using Field Data and GIS Environment: A Case Study from Al Qarara Area in Wadi Musa, Jordan (M. Al Farajat et al.)
soil and rock. Columbia University Press. New york, 136pp. Terlien, M. T. J., 1998. The determination of statistical and deterministic hydrological landslide-triggering thresholds. Environmental Geology, 2 - 3, p.35. DOI:10-1007/ s002540050299 Varnes, D. J., 1978. Slope movements and types and processes. In: Schuster, R..L. and Krizek, R.J. (eds.), Landslides: Analysis and control: Transportation Research Board, National Academy of Science, Special Report, 176, p.11-33 Zain Eldeen, U., Delvaux, D., and Jacobs, P., 2002. Tectonic evolution in the Wadi Araba Segment of the Dead Sea Rift, Southwest Jordan. EGU Stephan Mueller Special Publication Series, 2, p.63- 81. Zolfaghari, A. R.. and Heath, A. C., 2008. A GIS application for assessing landslide hazard over a large area. Computer and Geotechniques, 35, p.278- 285. DOI:10.1016/j. compgeo.2007.03.007
IJ O
G
Quennell, A.M., 1958. The structure and evolution of the Dead Sea Rift. Quaternary Journal of the Geological Society, 64, p.1-24. Quennell, A.M., 1959. Tectonics of the Dead Sea Rift. Proceedings of the 20th International Geological Congress Mexico, Asociacion de Servicios Geologicos Africanos, p.385- 403. Quennell, A.M., 1983. Evolution of the Dead Sea Rift. A review. First Jordanian Geologic Conference, p.460-482. Ron, H. and Eyal, Y., 1985. Intraplate deformation by block rotation and mesostructures along the Dead Sea transform, northern Israel. Tectonics, 4, p.85-105. DOI:10.1029/ TC004i001p00085 Sanderson, F., Bakkehøi, S., Hestenes, E., and Lied, K., 1996. The influence of meteorological factors on the initiation of debris flows, rock falls, rockslides and rock mass stability. In: Senneset, K. and Balkema, A.A. (Eds.), Landslides. Proceedings, 7th International Symposium on Landslides. Sharpe, C.S.F., 1938. Landslide and related phenomena: a study of mass movements of
21