Nov 30, 2005 ... This paper presents the development of a GIS-based Decision Support System (
DSS) designed to facilitate transportation system planning ...
Paper submitted to AASHTO GIS-T 2006 Student Paper Contest
Developing a GIS-based Decision Support System for Transportation System Planning
Kai Han, M.Sc., EIT Department of Civil Engineering University of Manitoba Room 246A Engineering Building, 15 Gillson Street Winnipeg, Manitoba, Canada R3T 5V6 Phone: (204) 474-7366, Fax: (204) 474-7513 E-mail:
[email protected]
November 30, 2005 Word count: 6366
1
Abstract This paper presents the development of a GIS-based Decision Support System (DSS) designed to facilitate transportation system planning process in the provincial transportation department. Following a substantial literature review of the current practice and academic research in the transportation DSS application field, the author capitalized on the department’s good accumulation of geospatial data sets and constructed the DSS on a GIS platform. Graphical presentation and AHP-based scoring algorithms were implemented on the GIS platform in conjunction with Access database. The DSS development also involved the establishment of an evaluation framework based on multiple performance measures and a data framework to accommodate various GIScapable data sets. The prototype system has illustrated the effectiveness of the DSS using real-world data and showed potentials for future enhancement.
2
1.0
INTRODUCTION
1.1
Background
This project is a research and development partnership between Manitoba Transportation and Government Services (MTGS) Transportation Systems Planning & Development Branch (TSPDB) and University of Manitoba Transport Information Group (UMTIG), involving the author working directly with the staff of the TSPDB to achieve the following goals: • • • •
To combine the expertise of TSPDB and UMTIG in the areas of transportation planning and geo-spatial data integration To identify issues that need to be addressed by a specially designed Geographic Information System (GIS)-based Decision Support System (DSS) To research and develop new approaches to utilize the information gathered and integrated through the previously completed GIS projects and provide better support for the transportation planning processes To update and enhance the existing GIS components to accommodate the DSS and be compatible with future information systems
From the 1960s through the early 1990s, MTGS used a Cobol-based computer program which was called the Highway Inventory and Needs Study Program. The Department used this software to program highway improvement needs based on a series of algorithms and to inventory work that was undertaken on the highway system. Over time, however, new computer technology made this program obsolete. This project provides a reintroduction of the basic capabilities of the Needs Study program using modern computer technology. GIS-based information is used to indicate where improvements are required based on a series of performance measures as indicated in Section 4 of this paper. The project is sub-divided into four tasks: 1) 2) 3) 4)
Identify needs based on solid understandings Research methodologies based on a thorough literature review Update data structure and current GIS spatial and attribute databases Implement DSS with essential functionality
1.2
Decision Support System for Transportation Planning
For the purpose of this research, DSS is defined as a specific class of computerized information system that supports business and organizational decision-making activities. A properly designed DSS is an interactive software-based system intended to help
3
decision makers compile useful information from raw data, documents, personal knowledge, and/or business models to identify and solve problems and make decisions. Transportation planners are responsible for improving system performance, rationalizing upgrading and maintenance strategies based on often conflicting interests, and providing the public with increased transparency in the whole decision-making process. They can benefit from a DSS specifically designed for transportation planning through better representation of the state and character of transportation infrastructure, clarified decision making processes, and more solid understandings of the options available within the financial and technological boundaries.
2.0
ENVIRONMENTAL SCAN
In order to identify needs for the proposed DSS based on solid understandings of regional transportation planning--its basic, dynamic nature, current planning process, data availability, and anticipated changes and future data needs, the author and staff member from TSPDB worked in a close professional partnership. This included regular meetings, frequent telephone communications, and computer information exchanges. The author also conducted an extensive literature review regarding DSS methodologies and current development for highway transportation planning purposes.
2.1
Review of the Branch’s Current Planning Process
The author, together with staff members from TSPDB, reviewed the Department's current Transportation Planning Manual (MDHT, 1998) and discussed details of the highway classification, cross section standard, and recent updates with TSPDB staff. TSPDB's highway planning process was also reviewed together with the latest weight classification and most recent cost estimate figures for different types of construction/upgrading. With regard to TSPDB's highway planning process chart (Figure 1), it is recognized that the DSS will facilitate the first two phases of the process, especially the diagnosis and evaluation modules, which are shaded in the chart. The author reviewed data sets used during the transportation planning process and focused on the various types of measurements which can be assisted by DSS. It was felt that in addition to conventional measures, such as Annual Average Daily Traffic (AADT) and truck percentage, performance measures should be emphasized during this project to support better engineering judgment and strike a balance between system-wide performance and fiscal responsibility.
4
INFORMATION ON THE HIGHWAY SYSTEM
POSSIBLE PUBLIC INPUT
INFORMATION ON THE SOCIO/ECONOMIC ACTIVITY
INFORMATION ON THE POLICY, POLITICAL AND FISCAL ENVIRONMENT
DIAGNOSIS
DECISION No. 1
IDENTIFY FISCAL AND OTHER POLICIES AND PROGRAM POLICIES
ANALYSIS (FUNCTIONAL PLANNING, DESIGN, ETC.) POSSIBLE PUBLIC INPUT DECISION No. 2 EVALUATION
SCHEDULING AND BUDGETING
PUBLIC INPUT (LANDOWNERS)
PROJECT DEVELOPMENT AND IMPLEMENTATION
DECISION No. 3
OPERATION MONITORING
Figure 1: TSPDB's Highway Planning Process
5
2.2
Literature Review of DSS and Its Transportation Applications
A number of sources are used to conduct the literature review. As DSS and its applications in transportation fields are the two focuses of this review, the following sources are exploited: • • •
Recent TRB publications (including TRR and TRB conference proceedings) Highway agencies Internet websites (i.e., FHWA, State DOTs, Provincial DOTs,) Recent reports from NCHRP regarding transportation planning
The DSS and its concept are widely used by transportation agencies for a variety of purposes ranging from transportation network planning to highway asset management and dangerous goods routing. A list of current practice and recent research is summarized as follows: Current Practice •
U.S. DOT, FHWA, Federal Transit Administration. The U.S. Department of Transportation (2002) reports the condition and performance status of highways, bridges, and transit in the United States in its “2002 Status of the Nation’s Highways, Bridges, and Transit: Conditions and Performance” (C&P) report. This document “is intended to provide Congress and other decision makers with an objective appraisal of highway, bridge and transit physical conditions, operational performance, financing mechanisms and future investment requirements.” The following are some of the findings presented in terms of the physical condition and performance of highways and bridges: “The percentage of highway mileage with ‘acceptable’ ride quality rose from 82.5 percent in 1993 to 86.0 percent in 2000.” 91 percent of all vehicle miles traveled (VMT) on the National Highway System were on pavements with “acceptable” ride quality. “The percentage of bridge deck area considered deficient dropped from 30.9 percent in 1996 to 27.9 percent in 2000.” The operational performance (the use of infrastructure as measured by travel time, delay, and congestion) of roads and bridges “has steadily deteriorated over the past decade.” Highways are “becoming safer even as travel sharply increased.” The fatality rate per million VMT has decreased from 3.3 in 1980 to 1.5 in 2000. The injury rate has also “declined in recent years.” “Total highway expenditures by all levels of government increased 25.0 percent between 1997 and 2000.”
6
•
Minnesota Department of Transportation The Minnesota Department of Transportation (Mn/DOT) (2003) published the “Minnesota Statewide Transportation Plan” (Plan) to comply with federal planning requirements. Part of the objective of the Plan is to establish a policy framework and performance measures for tracking the Mn/DOTs progress toward achieving their transportation goals. The policy framework consists of ten policies, which address the following transportation goals: (1) safety; (2) mobility; (3) accessibility; (4) security; (5) system preservation; (6) protection of the environment; (7) system management; and (8) respect for community values. Performance measures are specified for each policy within the framework. These measures “support tradeoff analysis in the policy, planning and programming context.” They also “help set appropriate targets for a policy or system plan where tradeoffs involve different system elements (e.g., highway versus transit), or different objectives (e.g., safety versus system preservation), given varying assumptions about resources available in a given timeframe.” The following criteria were used to select performance measures for the Plan: “They must have statewide significance, measuring either a systemwide attribute or an essential element of a mode or department function.” “They must meaningfully measure a key outcome of the Statewide Plan Policy Framework.” “Together they must represent all major functions, modes and customer segments for which Mn/DOT delivers a transportation service.” “They should cover outcomes over which Mn/DOT has direct or indirect influence, so that Mn/DOT can manage them.” “They should measure or influence an attribute that is important to customers and stakeholders.” The Plan provides detailed descriptions of each policy, its performance measures, and the performance targets specified for each measure.
•
Alberta Transportation Falls and Jurgens (2004) describe efforts by Alberta Transportation to increase the sensitivity of their performance measures to budget levels, and improve the effectiveness of these performance measures “as a measurement and reporting tool.” Performance measures are used by agencies to: “define policy objectives at an early stage of policy or system planning”
7
“provide the basis for annual performance reporting on system condition and performance as part of communications” “screen projects or set priorities” “allocate resources.” All performance measures “must meet the 4R test.” They must be: (1) relevant and understandable to the users; (2) technically robust; (3) repeatable; and (4) responsive to major work programs and/or budget fluctuations. Performance measures fall into three categories: Inputs – describe resources dedicated to a program (e.g., quantity of materials used) Outputs – describe products produced (e.g., miles of pavement resurfaced) Outcomes – describe the impacts of products on the goals of the agency (e.g., “discernible improvements in pavement ride”). Alberta Transportation “has recently adopted three performance measure categories: physical condition, utilization and functional adequacy.” The physical condition measure is based on an International Roughness Index (IRI) rating for segments of the provincial highway network. The performance target is expressed as the percentage of the network in “fair” or better condition (i.e. IRI < 2.70). The utilization performance measure “is defined as the percentage of the provincial highway network that is equal to, or better than, a targeted Level of Service (LOS) as defined by the Highway Capacity Manual.” The targeted LOS for provincial highways is C. The functional adequacy performance measure is defined by “the percentage of road and bridge infrastructure that is rated as meeting target criteria. A provincial highway is functionally adequate if the roadway is a standard width, free of road bans, and if the traffic is unrestricted by speed postings due to geometric constraints.” The authors analyze the physical condition performance measure in terms of its relevancy to the user and sensitivity to budgetary fluctuations. Several modifications are suggested. 1-km fixed sections should be used for monitoring and reporting network performance (as opposed to the 50-m sections previously used). “This approach presents a strong connection between monitoring and reporting at the network level and programming and planning functions at the project level.” All performance measures should be differentiated by 110 km/h and non-110 km/h network. “Threshold or trigger values for each measure should be defined separately according to each sub-network.” Condition measures should be reported by percentage of vehicle kilometers traveled (VKT), truck kilometers traveled (TKT), and length. “This will connect the reporting of network performance to the users.”
8
The definition of poor road condition should be an IRI of 1.9 for 110 km/h highways and 2.1 or 2.3 for non-110 km/h highways. •
NCHRP Report on Project 8-36 (32) – Rural Transportation Planning Tools, Techniques, and Methods Decker (2004) presented a report on NCHRP Project 8-36 (32) – Rural Transportation Planning Tools, Techniques, and Method on January 13, 2004 at the TRB Annual Meeting. The presentation stated six purposes of the NCHRP Project:
To identify recently-developed system planning tools To inventory planning tools and associated issues To identify methods used by planning issues to resolve issues To assess decision-making processes used by agencies to design, build, and deploy planning tools To prepare case studies of “best practices” and develop a “toolbox” that could be used by other agencies To recommend areas of future research. Transportation system planning tools were organized into nine categories: (1) quality of life; (2) mobility; (3) accessibility; (4) economic development; (5) environment; (6) system preservation and maintenance; (7) jurisdictional arrangements; (8) equity; and (9) project funding mechanisms. A literature review helped to identify a number of case studies of tools already in use for rural transportation planning and items to include in the development of a systems planning “toolbox.”
Recent Research •
Karlaftis, et al. (2004) outline the development of a DSS for special events public transport planning, specifically examining the case of the Athens 2004 Summer Olympics. The purpose of the DSS was to aid in:
“monitoring and managing information regarding the network” “supporting decisions about planning and operations” “deriving information that are useful for planning” “real-time decision support.”
The DSS utilizes spreadsheet and database software packages, a programming language, and model optimization procedures to assist users in data management, complex calculations, development and application of “special algorithms,” and production of “pictorial reports” for planning and real-time operation decisionmaking. The methodology for developing the DSS involved six steps: (1) definition
9
of user needs; (2) data collection; (3) definition of assumptions and scenarios; (4) DSS framework setup; (5) building the system; and (6) validation. The DSS “has been demonstrated to be an efficient and effective tool that aids decision makers and planners” in selecting appropriate courses of action. The system provides a “user-friendly environment” and can be “easily reprogrammed” to accommodate other similar planning needs. •
ElBehairy and Hegazy (2004) present a DSS for execution planning of bridge MR&R programs. Bridge management systems (BMS) are used “to prioritize bridges, allocate funds, and select appropriate repair strategies so that a network of bridges is kept serviceable and safe with low cost.” The proposed system supplements BMS by providing a “simplified but comprehensive model for execution planning of bridge maintenance programs.” The model uses a genetic algorithm procedure in a spreadsheet environment to determine “optimum” execution order, considering “practical constraints” (e.g., deadlines, owner supervision capacity, cash flow), and “other political/user constraints.”
•
Li, et al. (2004) describe a transit asset management system (TAMS) intended to support decision-making for rural and small urban transit systems. The purpose of the TAMS is to: “identify current maintenance deficiencies” “predict the future bus conditions and estimate the investment requirements” “recommend a cost effective maintenance strategy to sustain or improve vehicle condition.” Knowledge of the current and future condition of transit vehicles is “valuable in budget planning processes to identify cost-effective maintenance policies.” The spreadsheet-based decision analysis model provides quantitative measurements and optimization procedures to “help allocate sufficient funding to sustain future wellbeing of transit vehicles.”
•
Li and Sinha (2004) present a methodology for “multicriteria decision-making involving tradeoff analysis between candidate projects and optimal project selection in highway asset management under alternative scenarios of certainty, risk, and uncertainty.” The methodology includes: Identification of highway asset management system goals. For this study, system goals were defined and weighted by both highway agency groups and road user groups. The goals included system preservation, agency cost, user cost, mobility, safety, and environment. Classification of performance indicators for each goal. Performance indicators were weighted by both highway agency groups and road user groups.
10
Analysis of benefits achieved under different goals as a result of project implementation. These benefits “may be governed by any of three alternative scenarios: certainty, risk, and uncertainty.” Certainty “implies that the possible project outcomes occur deterministically.” Risk is defined as the “situation where the set of all possible outcomes of an action is known and the probability distribution of the outcomes is also known.” Uncertainty is defined for the “situation where only part or all possible outcomes of an action is known, but the probability distribution of such outcomes is not fully definable for a lack of reliable information.” The calibrated models were tested through the use of a case study, and the results compared with actual programming practice of the Indiana Department of Transportation. The findings “demonstrate that the proposed methodology provided reliable results” and that the methodology “could indeed be used by state transportation agencies for asset management practice.”
3.0
GIS PLATFORM DESIGN
A GIS platform can help convey information visually and geographically. It is more effective to implement DSS on a GIS platform than using solely conventional tables and charts. However, to better capitalize on GIS data sets compiled from a number of sources with different data structure, compatibility, and availability, the author had to overcome some technical obstacles to truly integrate these data sets into the DSS data framework. 3.1
Differences in GIS platforms
A number of GIS platforms (one single centerline and two versions of double centerline base maps) were evaluated for DSS purposes. There are advantages and disadvantages associated with each GIS platform. Data compatibility issue makes choosing one common platform for all data sets even more difficult. Major differences among these platforms were control section naming schemes, the addition of new LRS sections, and the representations of divided highways, namely single centerline vs. double centerline representation. The two schemes are both commonly used in the current GIS-T field to represent divided highways: •
Single Centerline Representation – using one line feature following the centerline of the total roadway to depict a divided highway. When this scheme is carried through the whole highway network, all highway sections are represented by single centerlines, whether they are divided or undivided. The internal compatibility and simplicity of this scheme facilitates high-level transportation planning, network analysis, and small-scale presentation of the highway system.
•
Double Centerline Representation – divided highways are portrayed by two centerlines following the centerlines of the two roadways of each side. This
11
representation, often associated with ramp details at interchanges, provides a more detailed picture of the divided highway infrastructure than single centerline. This scheme facilitates asset management processes, representation, collision analysis, and large-scale presentation. However, network-base applications are not supported very well by the double centerline scheme. The advantages and disadvantages associated with both representation schemes are summarized as follows: Table 1: Comparison of Single Centerline vs. Double Centerline Representation Schemes Single Centerline Scheme Double Centerline Scheme
Advantageous Field network, routine, traffic flow analysis, macro-scope presentation asset management, micro scope analysis, certain types of visual presentation
Disadvantageous Field lack of local detail network analysis (e.g., routing)
A visual comparison between single-centerline and double-centerline representation can be found in the example shown in Figure 2. Trans Canada Highway 1 control section 1001290 is shown in both single and double-centerline forms.
Double centerlines
Overlaid w/ single centerline
Figure 2: Single-centerline vs. Double-centerline Representation Fully aware of the advantages and disadvantages of the two representation schemes, the author decided on an approach that takes the most advantage of both representation schemes and minimizes compromises affecting attribute data structure and spatial data accuracy.
12
For DSS development, the latest version of the double-centerline base map developed by MTGS was decided to be the common GIS platform for the project based on technical considerations including spatial accuracy, level of detail, and control section update. However, due to the large-scope, small-scale nature of transportation planning, attaching data to often closely spaced double centerline has undesirable effects on accurate analyses and effective presentation. The solution around this problem, devised by the author, is to only attach non-directional attribute information, using LRS, to the right side of the two centerlines, assuming you are looking in the direction of ascending highway control section numbers. Following this approach, interoperability between the two types of base maps can be relatively easily ensured. Attribute data structure were also arranged accordingly to facilitate the implementation of this double/single-centerline technique. 3.2
LRS Compatibility
The flexibility of the linear reference/dynamic segmentation function of the GIS software is critical to developing DSS which can takes the full advantage of GIS platforms. Using LRS function provided by GeoMedia Transportation Manager Package, attribute data sets can be rendered geographically through dynamic segmentation. Dynamic segmentation of the data set is based on control section key and milepost information contained in the attribute databases. For different base maps, different sets of control section keys and milepost readings were used. To make one set of keys and mileposts compatible with another base map, careful data linking, including translation and conversion is required. The process can be tedious, time-consuming and error-prone, because often the relationships between two sets of keys and mileposts were not one-toone; they can be one-to-many or many-to-many. Detailed information regarding this process was documented in the form of metadata. A special effort was made during this project to accommodate various data sets and facilitate conducting presentations and analyses on the chosen GIS platform, which means the data structure of attribute databases was often modified to ensure compatibility with the new double centerline base map. However, when using these data sets to perform analyses, one has to be constantly aware of the difference between the data structures and the various compromises made for presentation and calculation purposes, because there is no one perfect data structure that can accommodate all data sets and all analytical needs. Therefore, extra care should be taken to correctly interpret the analysis results.
13
4.0
EVALUATION FRAMEWORK
4.1
Performance Measures
Performance measures to be implemented in the GIS-based DSS are divided into three categories originated in the National Cooperative Highway Research Program (NCHRP) Report 446 “A Guide for Performance-Based Transportation Planning” (Cambridge Systematics, 2000). The performance measure categories are as follows. Mobility and Operational Efficiency Providing mobility is a fundamental function of a highway transportation system. Mobility incorporates the relative ease or difficulty in making an individual trip. While providing mobility, it is also desirable that the transportation system function with a certain level of operational efficiency. Operational efficiency refers to the efficiency with which resources are used to produce a given level of transportation output. Measures of mobility and operational efficiency reflecting current system include functional classification, performance and future costs associated with improving system performance. Measures under consideration are: • • • • •
Functional classification Weight classification Volume/Capacity (V/C) ratio by section Percent of Vehicle Kilometer Traveled (VKT) / Truck Kilometer Traveled (TKT) occurring with V/C greater than "X" TKT by fleet mix
Safety and Quality of Life It is desired that a transportation system function safely. The lack of safety has a definite impact on society in the costs of accidents, injuries, and property damage. Certain aspects for measuring quality of life are closely related to safety. An example of this is people’s general sense of how safe the highway system or particular roadway section is. Other measures for quality of life that can be associated with safety include time lost to delay associated with highway accidents. Measures for safety and quality of life under consideration are: • • •
Number of accidents per section (total, injuries and fatalities) Number of accidents per VKT / TKT Number of accidents per vehicle entering (at specific intersections)
System Preservation System preservation refers to the physical condition of transportation infrastructure. Commonly cited types of system preservation measures are roadway and bridge condition and age. System preservation measures under consideration are:
14
• • • •
Pavement roughness index by section Pavement age Pavement section not meeting desired roughness Bridges and structures rating/index
Cost Parameters Aside from the performance measures mentioned above, cost parameters are important measures for highway projects. Cost parameters can be used, together with benefit measures, to compare the relative return of highway investments. Benefit measures can be brought in through connections with other decision making tools such as TransDec software. Cost measures under consideration are: • •
Cost of construction by type Relative cost (e.g., upgrade cost per vehicle kilometer per year, including cost of bridges)
Considering the above mentioned measures, most of them can be linked to distinct segments in the highway network (e.g., control sections). However, measures describing intersections, bridges, and structures are not naturally associated with certain network segments. Further research needs to be conducted to find an efficient way to handle these node-based measures. Therefore, for the first iteration of DSS development, the author focuses on segment-based measures with plans to incorporate node-based measures in the future. It is important to understand that the measures will be grouped into the various categories and an algorithm for each group will be developed. In this way each measure included in the system will contribute to the process which will culminate in composite performance indices for each of the three above mentioned performance categories. Not all of these performance measures will be included in this DSS development. Preference will be given based on their relative importance. New measures made available in the future will not be excluded from the system. For example, future cost/benefit measures coming out of the economic analysis study currently conducted by MTGS and the Federal government will be fed into the DSS. Based on the literature review of the current practice of various highway agencies and recent research on performance-based measures, the author considers it important to establish a hierarchical structure to provide an evaluation framework. Slightly modified from the widely used three-level (goal-objective-measure) structure, the proposed DSS evaluation framework is shown in Table 2. It will provide guidance to the decision-making process.
15
Table 2: Three-level DSS Evaluation Framework System Goal
Objective Mobility and Operational Efficiency
Maintaining and Developing the Provincial Highway System
Safety and Quality of Life
System Preservation Cost Parameters
4.2
Performance Measure Functional classification Weight classification Volume/Capacity (V/C) ratio by section Percent of Vehicle Kilometer Traveled (VKT) / Truck Kilometer Traveled (TKT) Number of accidents per section (total, injuries and fatalities) Number of accidents per VKT / TKT (rate) Number of accidents per vehicle entering (at specific intersections) Pavement roughness index by section Pavement age Cost of construction by type Relative cost (e.g., upgrade cost per vehicle kilometer per year)
Scales for Individual Measures
It is also necessary to set up scales for individual performance measures employed in the DSS system. The following tables (Tables 3 through 6) detail the proposed scale and scoring scheme for each individual measures. For each measure, considerations are given to the following issues: • • • •
minimum and maximum values system average desired levels score distribution (e.g., even, skewed, or exponential)
Mobility and Operational Efficiency Table 3: Scales for Mobility and Operational Efficiency Measures Performance Measure
Functional classification
Weight classification
V/C ratio by section
Percent of VKT and TKT
Scale Expressway Primary Arterial Secondary Arterial Collector A Collector B Collector C RTAC Loading A1 Loading B1 Loading Exceptionally High Above Average System Average Below Average Extremely Low Exceptionally High Above Average
Score 10 8 6 4 3 2 10 8 5 10 8 5 3 1 10 8
16
System Average Below Average Extremely Low
5 3 1
Safety and Quality of Life Table 4: Scales for Safety and Quality of Life Measures Performance Measure Number of accidents per section (total, injuries and fatalities)
Number of accidents per VKT / TKT (rate)
Number of accidents per vehicle entering (at specific intersections)
Scale Exceptionally High Above Average System Average Below Average Extremely Low Exceptionally High Above Average System Average Below Average Extremely Low Exceptionally High Above Average System Average Below Average Extremely Low
Score 10 8 5 3 1 10 8 5 3 1 10 8 5 3 1
System Preservation Table 5: Scales for System Preservation Measures Performance Measure Pavement roughness index (IRI) by section
Pavement age
Scale Extremely Low 2.4 Exceptionally High Newly Built Above Average System Average Below Average Extremely Old
Score 10 8 5 3 1 10 8 5 3 1
Based on TSPDB’s recommendation, two thresholds of IRI are used to determine the desired roughness: 1.6 and 2.4. However, other thresholds are also under consideration. For example, FHWA uses 1.5 and 2.7 as thresholds to define fair or poor conditions (Falls and Jurgens, 2004). Cost Parameters Table 6: Scales for Cost Parameters Measures Performance Measure Cost of construction by type
Scale Extremely Low Below Average System Average
Score 10 8 5
17
Relative cost (e.g., upgrade cost per vehicle kilometer per year)
4.3
Above Average Exceptionally High Extremely Low Below Average System Average Above Average Exceptionally High
3 1 10 8 5 3 1
Weighting Schemes for Objective Indices and the Composite Index
The individual scores will be normalized and weighted to produce objective (group) indices. Although these indices are calculated in and can be presented with long decimal places, it makes very little realistic sense to differentiate two very close scores. Therefore, the indices output will take the form of a specific range instead of an exact number. An example can be a range of conditions being severe-poor-fair-good-exceptional, which can be presented visually by the pink-red-yellow-green-blue color scheme. As the literature suggested, the best way to determine the exact weighting scheme throughout the DSS evaluation framework is to deploy the AHP method. The result from AHP can serve as a starting point for many iterations of fine tuning. Flexibility can be provided to the end users by giving them the ability to modify the weighting scheme. By altering weighting schemes, DSS users can make sensible judgments on a project-by-project base. For example, the result can be made more safetysensitive by applying skewed weighting scheme favoring safety measures.
5.0
DATA COMPONENTS
5.1
Data Framework and Availabilities
In this project, the author took a bottom-up approach in the DSS development. Figure 3 shows the pyramid shaped DSS data development framework which consists of three levels of data abstractions in the course of forming of performance measures, objectives, and ultimately the system goal. By first developing building blocks at the bottom level, upper level components can be subsequently implemented on top of them. One of the objectives of this undertaking is to research and develop a DSS by taking advantage of existing information accumulated in the GIS platform through previous efforts and integrating new developments in information technologies. During the project, focuses were on the development of data components at performance measure level. The data sets compiled for this purpose are listed in Table 7. Information regarding their sources, GIS platform compatibility, and currency is also presented in this table.
18
Decision Support System Maintaining and Developing the Provincial Highway System
Mobility and Operational Efficiency
Functional classification
Weight classification
Volume / Capacity (V/C) ratio by section
Percent of Vehicle Kilometer Traveled (VKT) / Truck Kilometer Traveled (TKT)
Safety and Quality of Life
Number of collisions per section (total, injuries and fatalities)
Number of collisions per VKT / TKT (rate)
Number of collisions per vehicle entering (at specific intersections)
System Preservation
Pavement roughness index by section
Pavement age
Cost Parameters Cost of construction by type
Relative cost (e.g., upgrade cost per vehicle kilometer per year)
………………………… Rudimentary Measurement Data ………………………… Figure 3: DSS Data Development Framework
19
Table 7: Summary of Information for DSS Development Performance Measure Functional classification Weight classification Volume/Capacity (V/C) ratio by section Percent of Vehicle Kilometer Traveled (VKT) / Truck Kilometer Traveled (TKT) Number of collisions per section (total, injuries and fatalities) Number of collisions per VKT / TKT (rate) Number of collisions per vehicle entering (at specific intersections) Pavement roughness index by section Pavement age Cost of construction by type Relative cost (e.g., upgrade cost per vehicle kilometer per year)
Data Source MTGS Highway Inventory MTGS Compliance Branch UMTIG Traffic Data / MTGS Highway Inventory UMTIG Traffic Data
Basemap Compatibility MTGS Double Centerline MTGS Double Centerline MTGS Double Centerline
Revision 2002 2004 2003 / 2002
MTGS Double Centerline
2003 (2002 Truck Traffic)
MTGS Collision Database
Single Centerline
1995-2000
MTGS Collision Database / UMTIG Traffic Data MTGS Collision Database / UMTIG Traffic Data MTGS IRI Database
Single Centerline
1995-2000 / 2003
N/A
1995-2000 / 2003
2000
MTGS Highway Inventory (2000) MTGS
MTGS Double Centerline (old CS) MTGS Single Centerline N/A
MTGS / UMTIG Traffic MTGS Data
MTGS Double Centerline
2003
2000 2003
The information represented in the table consists of over 300 MB of spatial and attribute data from a variety of sources. Many data sets in their original format often can not be directly linked the GIS-T platforms. Since multiple GIS-T platforms are involved in the development, compatibility with these platforms is also an important characteristic of the data sets which will ensure the proper data linking and data integrity. Data sets containing attribute data need to be rearranged or restructured prior to the integration with spatial data. 5.2
Integration of Multiple Data Sets
Most analyses conducted using DSS will involve multiple data sets. This presents a unique set of problems regarding data integration. Within the scope of the DSS, traffic data serve as the exposure base, which sits in the core of analyses data framework (Figure 3). Many exposure-based calculations rely on traffic data. Linking traffic data with various data sets was proven essential to exposure-based calculation. Therefore,
20
substantial amount of effort was made to clean up traffic databases and link it to GIS platforms. During the project, when data sets are integrated together, the data structure of the combined databases was expended to accommodate fields from multiple data sources, and an extra number of records were added to account for conditions where location information from individual data sets doesn’t match. Meanwhile, the original data sets were kept intact to ensure data integrity, which benefits quality control of the analyses and future linking efforts. 5.4
Limitations of Software
Some of the data quality problems actually relate to the limitations of GIS software. The “LRS precision location” function provided by GeoMedia Transportation Manager has only one decimal place built-in, which gives a +/- 50 meter accuracy for GIS dynamic segmentation reading, because the measuring unit within highway control sections is kilometer. The direct result of this inaccuracy is that the dynamically segmented highway sections don’t meet accurately at intersections, which may create small problems in data presentation, but big problems in analyses involving network routing. 5.5
Data Density
Depending on the original database requirements, information contained in these databases can be very detailed and not suitable for easy use in DSS. A good example is the IRI database, in which over 40 fields of data were stored for each measured travel pass. This was further complicated by directional information recorded for divided highway sections. The sheer amount of data can overwhelm the visual presentation, making maps too busy to be effective. To reduce the unnecessary data density, numerical values indicating where the element sits in the system were used. These values were consequently grouped into ranges to further simplify the color coding process in presentations and scoring in DSS analyses. 5.6
Data Presentation
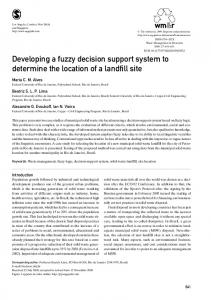
Color Coding Scheme To better communicate the information, color coding was considered in the data presentation. Adopting a multi-color scheme for the color coding helps visually represent current condition across the entire highway network. An example is shown in Figure 4, which was developed by Minnesota Department of Transportation (Mn/DOT) for its Measurements for Planning and Programming project (Mn/DOT, 2004).
21
Figure 4: Color Coding in Mn/DOT's Dashboard System The author developed a simple five-color coding scheme based on the Mn/DOT's Dashboard System. By extending the red-yellow-green-blue color scheme, the system uses pink to represent exceptionally good conditions. The five-color system, shown in Figure 5, gives DSS more flexibility in presenting highway system conditions. It is understood that, in many situations, not all colors are needed and the three middle colors will most likely be used. COLOR
CONDITION
Pink
Very Bad
Red
Bad
Yellow
Fair
Green
Good
Blue
Very Good
Figure 5: Five-color Scheme for DSS Information Presentation By applying the simplified red-yellow-green color scheme, the traffic volume and volume/capacity ratio data sets are presented on Manitoba's National Highway (NH) Network, which consists of Provincial Trunk Highway (PTH) 1, PTH 16, PTH 75, and PTH 100 in Figures 6 and 7.
22
Figure 6: Traffic Volume (AADT) on Manitoba's NH Network
Figure 7: V/C Ratio of Manitoba's NH Network
Highway Network Segmentation In Manitoba, provincial highways are segmented into control sections. The author discussed with TSPDB staff whether more uniform segmentations are needed. For certain measurements, it is advantageous for all highway segments to have uniform length. The DSS design should considered requirements generated by different data representation schemes. However, for representations of the highway systems within the DSS, control section segmentation is sufficient. A balanced segmentation scheme based-on highway control segment was adopted with modifications including breaking up long control sections at major intersection.
6.0
PROTOTYPE IMPLEMENTATION
A prototype of the DSS was developed to calibrate the algorithms, database structures, and software platforms. Technical issues encountered during this process will facilitate future enhancements that will eventually lead to the fully functional DSS implementation. 23
6.1
Dual Software Platforms
The software environment selected for the prototype DSS development consists two software packages—GeoMedia (enhanced by Transportation Manager) and Access (which supports SQL and VB programming). Major advantages of employing dual software platform are: • • • •
independent of GIS software versions interoperability among GIS software easy DSS deployment increase potential user numbers
In response to the dual platform, the DSS data processing flow is modified somewhat to accommodate this software environment. The process can be best described by the following chart (Figure 8).
Existing Data
Performance Measure Rating
User-adjustable Algorithm Inputs
(in Access)
Score Calculation
(in Access)
Visual Presentation of the Resulting Scores
(in GeoMedia)
Readjust and Fine-tuning
Figure 8: DSS Data Processing Flow
6.2
Graphical User Interface
The graphical user interface (GUI) of the DSS facilitates the end-user, providing userfriendly visual presentations of the analysis results and flexibility in adjusting parameters of the scoring algorithms. The following figures (Figure 9 to 11) illustrate the typical GUI employed in the prototype development. 24
Figure 9: Typical DSS Input User Interfaces (in GeoMedia)
Figure 10: Typical DSS Input User Interfaces (in Access)
Figure 11: Typical DSS Ouput User Interfaces (in GeoMedia) 25
7.0
CONCLUSION
This research resulted in the development of a custom-built DSS designed to facilitate transportation system planning process, with GIS-based spatial analytic functionalities and data structure. The prototype system has illustrated the effectiveness of the DSS using real-world data and showed potentials for future enhancement. The accumulated geospatial data sets of the transportation department through previous efforts were capitalized by the DSS development on a GIS platform. In conjunction with the Access database, the GIS platform provides graphical user interface that is both user-friendly and flexible. The DSS development also opens doors for future developments the transportation planning field.
26
BIBLIOGRAPHY: Cambridge Systematics, Inc. (2000). “A Guidebook for Performance-Based Transportation Planning, National Cooperative Highway Research Program Report 446”, Transportation Research Board, National Research Council, Washington, D.C. Decker, S. (2004). “Innovations in Statewide Transportation Planning for Rural Areas: Report on NCHRP Project 8-36 (32) – Rural Transportation Planning Tools, Techniques, and Methods,” presented to TRB 2004 Annual Meeting, January 13, 2004 by Stephen Decker, Cambridge Systematics, Inc. Website: http://www.camsys.com/TRB%202004%20PDFs/ SDD%20Rural%20Planning.pdf, accessed on March 18, 2004. ElBehairy, H. and Hegazy, T. (2004). “Decision Support System for Execution Planning of Bridge MR&R Programs,” TRB 2004 Annual Meeting Proceedings, CD-ROM, Transportation Research Board, National Research Council, Washington, D.C. Eustace, D.; Russell, E. R.; and Landman, E. D. (2002). “Application of Robustness Analysis for Developing a Procedure for Better Urban Transportation Planning Decisions,” TRB 2002 Annual Meeting Proceedings CD-ROM, Transportation Research Board, National Research Council, Washington, D.C. Expert Choice, Inc., (2004). “Expert Choice 2000 2nd Edition for Groups,” Website: http://www.expertchoice.com/productbrief/, accessed on March 18, 2004. Falcocchio, J. C. (2004). “Performance Measures for Evaluating Transportation Systems: A Stakeholder Perspective,” TRB 2004 Annual Meeting Proceedings, CD-ROM, Transportation Research Board, National Research Council, Washington, D.C. Falls, L.C. and Jurgens, R. (2004). “Four R’s of Performance Measurement: the Alberta Case Study,” TRB 2004 Annual Meeting Proceedings, CD-ROM, Transportation Research Board, National Research Council, Washington, D.C. Federal Highway Administration (FHWA), U.S. Department of Transportation, (2003). “Maintenance Decision Support System (MDSS),” website: www.ops.fhwa.dot.gov/weather/MDSSRollOut.htm, accessed on November 26, 2003. Gannon, M.; Morrison, L.; and Stelmach, L. (1998). “Locating A Meat Processing Plant in the Prairies,” Proceedings of the 33rd Canadian Transportation Research Forum (CTRF) Annual Conference, Edmonton, Alberta, May 25-28, 1998, pp.229-242. Geurts, K.; Wets, G.; Brijs, T.; and Vanhoof, K. (2004). “Identification and Ranking of Black Spots: Sensitivity Analysis,” TRB 2004 Annual Meeting Proceedings, CD-ROM, Transportation Research Board, National Research Council, Washington, D.C. Hauer, E.; Allery, B. K.; Kononov, J.; and Griffith, M. S. (2004). “How Best to Rank Sites With Promise?” TRB 2004 Annual Meeting Proceedings, CD-ROM, Transportation Research Board, National Research Council, Washington, D.C. Huang, B.; Cheu, R. L.; and Liew, Y. S. (2004). “Incorporating Security in HAZMAT Route Planning Using GIS and AHP,” TRB 2004 Annual Meeting Proceedings, CD-ROM, Transportation Research Board, National Research Council, Washington, D.C. Karlaftis, M.G.; Kepaptsoglou, K.; Stathopoulos, A.; and Starra, A. (2004). “A Decision Support System for Special Events Public Transport Network Planning: The Case of the Athens 2004 Summer Olympics,” TRB 2004 Annual Meeting Proceedings, CD-ROM, Transportation Research Board, National Research Council, Washington, D.C.
27
Khisty, C. J. and Sriraj, P. S. (2000). “Transportation Project Selection Through Robustness Analysis for Developing Countries,” Transportation Research Record 1695, pp.42-48, Transportation Research Board, National Research Council, Washington, D.C. Li, Q.; Zhao, H.; and, Yan, X. (2004). “Decision Making Modeling for Rural and Small Urban Transit Asset Management,” TRB 2004 Annual Meeting Proceedings, CD-ROM, Transportation Research Board, National Research Council, Washington, D.C. Li, Z. and Sinha, K.C. (2004). “A Methodology for Multicriteria Decision-Making in Highway Asset Management,” TRB 2004 Annual Meeting Proceedings, CD-ROM, Washington, D.C. Manitoba Department of Highways & Transportation (MDHT) (1998). “Transportation Planning Manual,” website: http://www.gov.mb.ca/tgs/tspd/manual/index.html, accessed on January 26, 2004. Manitoba Transportation & Government Services (MTGS) (2004). “Manitoba Highway Classification System”, Manitoba Transportation & Government Services, Compliance and Regulatory Services. Website: http://www.gov.mb.ca/tgs/transreg/compreg/rtacroutes.html, accessed on December 18, 2004. Minnesota Department of Transportation (Mn/DOT) (2003). “Minnesota Statewide Transportation Plan: Moving People and Freight from 2003 to 2023,” Saint Paul, Minnesota. Website: http://www.oim.dot.state.mn.us/index.html, accessed on March 18, 2004. Minnesota Department of Transportation (Mn/DOT) (2004). “Measurements for Planning and Programming at Mn/DOT,” website: http://www.dot.state.mn.us/dashboards/plan-n-prog1.html, accessed on January 25, 2004. Texas Transportation Institute (TTI) (2003). “TransDec2.0 User's Manual, Transportation Decision Analysis Software (Version 2.0) For Multimodal, Multicriteria Transportation Investment Analysis,” Texas Transportation Institute, College Station, Texas. Transportation Research Board (TRB) (1985). “Highway Capacity Manual, Special Report 209”, Transportation Research Board, National Research Council, Washington, D.C. U.S. Department of Transportation (USDOT) (2002). “2002 Status of the Nation’s Highways, Bridges, and Transit: Conditions and Performance,” Report to Congress by the Federal Highway Administration and the Federal Transit Administration, U.S. Department of Transportation. Website: http://www.fhwa.dot.gov/policy/2002cpr/index.htm, accessed on March 18, 2004. University of Manitoba Transport Information Group (UMTIG) (2004). “Traffic on Manitoba Highways 2003”, University of Manitoba Transport Information Group, May 2004. Wang, H.; Jin, M.; and Rana, N. (2004). “A New Performance Measure System for Intermodal Transportation,” TRB 2004 Annual Meeting Proceedings, CD-ROM, Transportation Research Board, National Research Council, Washington, D.C.
28