RP1. Requirements prioritization. A B C D . RP2. Requirements selection. A B C D . RP3. Release definition. A B C . RP4. Release validation. A B C D.
Developing a Maturity Matrix for Software Product Management
Inge van de Weerd Willem Bekkers Sjaak Brinkkemper
Technical Report UU-CS-2009-015 September 2009
Department of Information and Computing Sciences Utrecht University, Utrecht, The Netherlands www.cs.uu.nl
ISSN: 0924-3275
Department of Information and Computing Sciences Utrecht University P.O. Box 80.089 3508 TB Utrecht The Netherlands
Developing a Maturity Matrix for Software Product Management Inge van de Weerd, Willem Bekkers, Sjaak Brinkkemper Utrecht University, The Netherlands {i.vandeweerd,bekkers,s.brinkkemper}@cs.uu.nl
Abstract. The quality of processes in Software Product Management (SPM) has a high impact on the success of a software product, as it improves product quality and prevents release delays. To improve the SPM practice, we propose the maturity matrix for SPM, a focus area oriented maturity model concentrating on the SPM functions Requirements Management, Product Roadmapping, Release Planning and Requirements Management. In this paper, we describe the development of the SPM maturity matrix, consisting of (a) identification and description of capabilities, (b) positioning the capabilities at the right levels in the maturity matrix and (c) validating the maturity matrix with expert validation and a survey among 45 product managers and product management experts. The result is a validated maturity matrix that will guide further development of methodical support in SPM. Keywords: software product management, maturity matrix, requirements management
1. Maturity in SPM Software product management (SPM) is a crucial area within many software companies. Good product management has a high impact on the success of a software product [1]. This requires a combination of technological, managerial and business skills, such as calculating optimal releases, setting out roadmaps, managing risks, and interacting with many internal and external stakeholders. If these activities do not get enough attention, the quality of a product decreases, release dates are not met, and managing customers’ expectations become a large problem. Although the product manager’s function is highly important in the product software industry, little education exists in this area [2]. Almost no education on SPM is being offered, except in the area of marketing and sales. Based on our experience in the market, especially in The Netherlands, Germany and Switzerland, we observe that most software product managers were earlier employed in functions such as development manager, project manager or sales manager. This causes a gap of knowledge that the
product manager has to solve by getting experienced in the area. Hence, lifting the quality of the product by improving the SPM processes is often difficult. Most existing software process improvement (SPI) models aim at a broad spectrum of SPI and the area of SPM is usually not the main area of attention. In this research, we propose a maturity matrix for SPM that can be used to assess an organization’s current SPM capabilities and offer local, incremental improvements to the product manager.
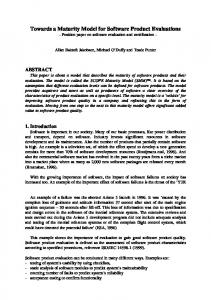
1.1. Background In earlier research, we developed the Reference Framework for Software Product Management [2]. Since its publication, various studies have been done to test the reference framework in product software companies (cf. [3] and [4]). In this research, we use the reference framework as a foundation for our maturity matrix. Therefore, we will provide a brief explanation of the framework. In Figure 1, the reference framework for software product management is depicted. The framework consists of internal stakeholders (product management, company board, sales & marketing, services, support, development and research & innovation) and external stakeholders (the market, partners and customers). The most important internal stakeholder, Product management, consists of four business functions: Portfolio management concerns managing the different products that a company owns. Partnering, product lifecycle management and product line identification are part of this function. Product roadmapping handles with the development of the product roadmap, in which future releases are planned based on themes and core assets. Requirements management contains the activities of requirements gathering, identification and organizing; all ongoing activities within the product management domain. Release planning deals with prioritizing and selecting requirements in order to define the new release. Also the activities release validation, launch preparation and scope change management are part of this function
board requests
Product management
Product lifecycle lifecycle decisions management
trends
Market trend identification
market trends
product development strategy
Portfolio management Partnering & collaborations contracting
Product line identification
trends product lines
Product roadmapping
Market
Theme identification
themes
Core asset identification market trends
Requirements management Requirements gathering requirements
partner requests
roadmap Requirements identification
product requirements
product requirements list
Partner companies
Release planning prioritized requirements Requirements prioritization
technology drivers
release content
Requirements selection
Scope change management
Sales & marketing
customer & prospect requests customer requests
Requirements organizing roadmap
launch information
release definition Release definition
Launch preparation
Release validation
adaptations validated release definition
validation
scope changes
Research & innovation
Roadmap construction
core assets
business case validation validation
contracts
Company board
Customer launch preparation package
launch preparation package
internal stakeholders
internal functions
Development
Support
Services external stakeholders
change requests, bug fixes
Figure 1. Reference framework for Software Product Management
1.2. Paper outline This paper is organized as follows. Section 2 describes our research method. In Section 3, we describe the process of developing the maturity matrix. Then, in Section 4, we describe the empirical validation of the matrix. In Section 5, we describe the implications and outlook. Finally, in Section 6, we provide the conclusions of our research.
3. Development. The development of the artifact, in this case the maturity matrix is described in Section 3. 4. Evaluation. This step comprises the evaluation of the method. We used a survey to validate the method, as is described in Section 4. The results of this survey lead to a higher level of problem awareness and suggestions for solutions. We elaborate on these suggestions in Section 5. 5. Conclusion. Finally, in Section 6, conclusions and areas for further research are covered.
2. Research design 2.1. Artifacts This study follows the design science methodology, in which research is done through the processes of building and evaluating artifacts [5]. The artifact in this research is the maturity matrix for SPM. During our research, we follow the 5 process steps of the design cycle [6]. This design cycle consists of several steps that follow an iterative process; knowledge produced in the process by constructing and evaluating the artifact is used as an input for a better awareness of the problem. The 5 process steps are: 1. Awareness of the problem. In Section 1, we described the problem and its context. 2. Suggestion. The suggestion for a solution to the problem identified in step 1 is developed in this step. In Section 2, we describe our approach in tackling the problem and the research methods that we use.
In Figure 2, we depict the structures of the two artifacts in this research. The REFERENCE FRAMEWORK consists of KEY PROCESSES that are grouped into BUSINESS FUNCTIONS. Secondly, the MATURITY MATRIX consists of KEY PROCESSES and SPM CAPABILITIES. Each SPM CAPABILITY contributes to a KEY PROCESSES and it indicates which MATUIRTY LEVEL this process has. In addition to the artifact structure, the research methods used during the development of both artifacts are provided. At the left, the research methods that were used for developing the Reference framework are listed and at the right the method for developing the Maturity matrix are listed.
REFERENCE FRAMEWORK
Literature review, Emperical study, Expert validation
MATURITY MATRIX
Literature study, Brainstorm SPM session, KEY PROCESS CAPABILITY Expert contributes validation, Survey are grouped in indicates BUSINESS FUNCTION
MATURITY LEVEL
Figure 2. Artifacts and research methods
2.2. Data collection methods This research was conducted with the following data collection methods: Literature study. One of the sources for the capabilities, which are defined for each of the processes in the reference framework for SPM, is a literature study. This literature study was based on a multitude of papers describing specific processes within the field of SPM, e.g. [7], [8]. Brainstorm session. A brainstorm session was conducted with experts from the scientific community to create the model. The session consists of two parts: 1) the capabilities themselves were determined; 2) the positions of the capabilities in the SPM maturity matrix were determined. The literature study was used as a basis for the brainstorm session. Expert validation. An expert from practice validated the results of the brainstorm session: the capabilities themselves and their position within the SPM Maturity Matrix. Survey. A final validation was conducted based on a survey with SPM experts from practice from all over the world. The goal of this survey was to validate the order of the capabilities relative to each other in the SPM Maturity Matrix.
3. Developing a maturity matrix
which each focus area has its own number of specific maturity level. Most well-known maturity models are staged or continuous 5-level models, such as the Capability Maturity Model (CMM) [10], and its follow-up CMMI [11]. Earlier research into the improvement of SPM shows some shortcomings in these methods. CMMI for example, has been found too heavy to use by several organizations [12]. And there are others who say that extensive software process improvement (SPI) frameworks, such as CMMI and ISO/IEC 15504 (SPICE) [13] are too large to implement, or even comprehend [14] [15]. For example, a typical CMM SPI cycle can take between one and a half and two years to complete. It also requires large resources and long term commitment [16], which can be a problem for small and medium companies. Another problem is that small and medium software companies often not only lack the funds required to implement many of the practices from CMM but also have to base their SPI initiatives on practices that do not apply to them [17]. For the reasons above, we choose to develop a focus area oriented model, in order to make local analysis and incremental improvement possible. Similar model have been used for the testing domain [18] and the architecture domain [9].
3.2. Structure of the maturity matrix In Table 1, the SPM maturity matrix is depicted. Table 1. Maturity matrix structure 0 1 2 3 4 5 6 7 8 9 10 11 12 RM1. Requirements gathering RM2. Requirements identification RM3. Requirements organizing RP1. Requirements prioritization RP2. Requirements selection RP3. Release definition RP4. Release validation RP5. Launch preparation RP6. Scope change management
B
A
B
A A A A
3.1 Variance of maturity models
PM1. Market trend identification PM2. Partnering & contracting PM3. Product lifecycle management PM4. Product line identification
A A A
B
D D C
D C
C
C A B
A
B
C C
B B B A
C
B C B C B C B B B
A
PR1. Theme identification PR2. Core asset identification PR3. Roadmap construction
D C
B A A
In this section, we first describe our choice for the type of maturity matrix we use, and then we describe its structure and the development process.
Van Steenbergen et al. [9] recognize three variants of maturity models: 1) staged 5-level models, which distinguish five levels of maturity, which in turn have a number of focus areas that are defined specific to that level; 2) continuous 5-level models, which contain a number of focus areas, in each area the 5 levels are distinguished; and 3) focus area oriented models, in
C
A A
B
C C C C
The matrix consists of columns and rows, which represent the two dimensions of the model. The columns 0 to 12 represent the different maturity levels for the model, where 0 is the lowest level of maturity and 12 the highest. The SPM key processes are
represented by the rows and are divided into four groups (the business functions; ‘Requirements management’, ‘Release planning’, ‘Product roadmapping’, ‘Portfolio management’). When a process is carried out at a certain maturity level it is called a capability. In Table 1, we can for example identify the capability Requirements gathering A, which is located on level 1. This capability is coded as RM1A and described as: “Ad hoc requirements gathering. Requirements are being gathered and registered.” Finally, two more concepts need to be introduced: Intra-process capability dependency – This is the dependency of one capability within a certain key process to another capability in the same key process. In Table 1 this type of dependency is depicted with an arrow between RM1B and RM1C. Inter-process capability dependency – Intraprocess refers to the dependency of a capability in a certain key process to a capability in another key process. In Table 1 this is depicted with an arrow between RM1D and RM3C.
3.3. Developing a maturity matrix for SPM We followed three main steps during the development of the maturity matrix: 1. Identification and description of capabilities A brainstorm session with four SPM experts was held to identify the capabilities. Two of them had extensive professional experience in SPM and the other two were researchers to SPM. During the session, it appeared that the maturity levels in the SPM processes follow two types of sequences. The first sequence follows the natural hierarchy of software products (portfolio > product > release > requirement). The capability naming therefore is: (A) ad hoc, (B) release-based, (C) roadmap-based, and (D) portfolio-based. However, this hierarchy is not for all processes suitable. Therefore, we use a second sequence, which can consist of (A) ad hoc, (B) organized, (C) integrated / externally oriented, (D) optimized. Please note that a sequence may consist of 3 or 4 capabilities. Short descriptions of the capabilities are included in Appendix I, which are based on [3]. 2. Positioning the capabilities in the maturity matrix The next step concerned positioning the capabilities in the matrix. By analyzing the inter- and intra-process capability dependencies, we decided the order of the capabilities in the matrix. For example, for the first capability in the process in Requirements identification (RM2A), it makes sense to have gathered and registered requirements, which is capability RM1A.
Therefore, RM2A must be placed at least 1 level after RM1A. This activity resulted in a matrix of 13 levels (0-12). During the validation, we will find out whether this is the right size. 3. Validating the maturity matrix The third and last step is the empirical validation of the matrix. In Section 4, we describe how we use a survey to validate the positions of the capabilities.
4. Empirical validation 4.1. Survey structure Our survey consists of three parts: Introduction questions, general questions and capability questions. It starts with two introduction questions: • Which SPM areas are you familiar with? • How are you related to SPM? The answers to these two questions determine which questions will be presented in the remainder of the survey. First, the respondent can choose which of the four SPM areas will be included in the survey. Only SPM-areas of which the checkboxes are ticked, will be included in the survey. The second question is used to find out whether the respondent is a software product manager or another SPM professional. After the introduction question, some general questions are posed concerning company size, experience, etc. The main structure of our survey is based on the four business functions that are defined in the reference framework for SPM: requirements management, release planning, product roadmapping, and portfolio management. For each function, we asked how our identified capabilities should be implemented in an organization. If we would ask to fill in a whole matrix per area, we would get very large matrices. For example, the release planning area has 21 capabilities and 12 rows. During the first pilots it appeared this would cause a cognitive workload that was too high. Therefore, we decided to use another approach and divided the matrix in three sub matrices. In the first matrix, ranging from 1 to 6, capabilities A and B are covered. In the second matrix, ranging from 4 to 9, capabilities B and C are covered. Finally, if necessary, a third matrix is used to cover capabilities C and D. In Table 2, part of the matrix is depicted, showing the division in three separate matrices. Table 2. Matrix division 0 1 2 3 4 5 6 7 8 9 10 11 12 Requirements gathering Requirements identification Requirements organizing
In Figure 3, we depict part of the survey in which all capabilities A and B of the Requirements Management process area are listed. The capabilities are listed on the left and the levels (1-6) in the middle. The last columns can be used to indicate whether the respondent has implemented the capability. The N/A option is for non-product managers that execute the survey. Maturity levels
Implemented?
followed a course or study in SPM and three are certified in SPM. In Table 3, some characteristics concerning the respondents’ function, company size (only product managers are included) and experience are provided. Table 3. Respondents' characteristics Function Product manager Researcher Consultant Other
Company size Experience 30 Less than 50 12 0-2 years 5 50 - 250 7 3-5 years 3 More than 250 11 6-10 years 7 More than 10 years
13 12 13 7
4.3. Data analysis
Figure 3. Survey questions Requirements Mgt.
4.2. Data collection In order to find respondents to the survey, we posted a message to several mailing lists. Below, you can find an overview of the members of these mailing lists: Netherlands product software mailing list: 175 Netherlands SPM community: 68 International SPM community: 176 In addition, during a national meeting among 20 Dutch product management professionals, the survey was promoted. Finally, the URL of the survey was posted on the SPM community website [19]. Please note that the members of the different mailing lists, visitors to the meeting, and visitors of the website overlap. The number of respondent to the survey is 84. Of these 84 only 45 were useful, i.e. they did not quit the survey after the first two pages. Not all questions have the same amount of responses. The respondents can make a choice in the beginning of the survey, for which they can indicate on which SPM area they can answer questions. Per SPM area, we have the following amounts of respondents: Requirements management: 42 Release planning: 27 Product roadmapping: 25 Portfolio management: 19 The respondents originate mostly from the Netherlands (36). Other individuals originate from Germany, Canada, USA, India, South Africa, Sweden, Switzerland and Spain. Thirteen of the respondents
In this section, we will analyze the results from the survey. For each business function, we describe the results of the survey and compare this with our initial maturity matrix. In principle, we use the survey results to update our maturity matrix. However, we make one exception. Dependencies between capabilities in the different business functions were not part of the survey. Therefore, in case a capability is placed on a certain maturity level because of a dependency to a capability in another business function, we keep to the original sequence. We use boxplots to give a graphical overview of the distribution of each capability, as is illustrated in Figure 4. These boxplots show the median, smallest and highest observations and the distribution over the quartiles. In addition, the outliers (if present) are shown. We use the medians as an indication of the maturity level of a capability, because we want to know which level was chosen most for a certain capability. smallest observation
25%
median
25%
highest observation
25%
25%
Figure 4. Boxplot We list all capabilities within one business function in a boxplot. At the Y-axis, the different capabilities are listed and at the X-axis, the maturity levels are indicated. Please note that some medians are not integers, but rational numbers. E.g. RM1C has a median of 5,5. The reason for this is that the respondents had to enter these maturity levels twice (cf. Section 4.1). Sometimes this resulted in two different answers, of which we calculated the mean. In such cases, we look at the distribution of the boxplot to identify at which level the capability should be placed (in RM1C that means that the capability is placed on maturity level 6).
activities as the minimum that a product manager should implement.
4.3.1. Requirements management In Figure 5, the results of the Requirements management survey part are depicted in a box plot. In Table 4 the matrix is illustrated with the original results, and the deviations that were found when comparing it with the boxplot. We also indicate the status of a capability. “A” means that the result of the survey was the same as the original position, “A” indicates the result of the survey that was different from the original capability, and “A” shows the old position of the capability. Several issues are noteworthy. Firstly, the intraprocess capability dependencies are the same; all capabilities are positioned in the sequence A, B, C, (D). For the inter-process capability dependencies we see some differences that we will implement in the final matrix.
Figure 6. Boxplot Release planning Table 5. Release planning matrix 0 1 RP1 RP2 RP3 RP4 RP5 RP6
2
A A A A
3
4
5
6
A A A A A A
B B B
B B B B B B
C
B
7
8
9
10
11
12
D C C C
D C
D D
D
C C
4.3.3. Product roadmapping
Figure 5. Boxplot Requirements management Table 4. Requirements management matrix 0 RM1 RM2 RM3
1
2
A
3
4
5
B A A
6
7
8
C B
A
B B
B
9
10 11 12
The results of the Product roadmapping part of the survey are illustrated in Figure 7 and compared with the original matrix in Table 6. Also for Product roadmapping, the intra-process capability dependencies are analogous to the original matrix. In the interprocess capability dependencies we see some deviations that will be included in the matrix.
D C C
C
4.3.2. Release planning In Figure 6 and Table 5, the results of the Release planning part of the survey are illustrated and compared with the original matrix. Again, the intraprocess capability dependencies are the same. However, in the inter-process capability dependencies we see many small deviations. All of which have been incorporated into the matrix. One issue stands out: The prioritizing and selection capabilities (RP1A and RP2A) are implemented earlier than all other capabilities. Apparently, the respondents consider these
Figure 7. Boxplot Product roadmapping
Table 6. Product roadmapping matrix PR1 PR2 PR3
1
2
A
A A A
3
4 B B
B
5
6
7
8
9
10
11
12
C B C
C
C C
RP2D, RP4D, PR2C and PR3C and all the Ccapabilities of the Portfolio Management function. Reason for this is that we do not only want to incorporate the fastest way to implement the capabilities in our matrix, but we also would like to provide a balanced way to improvement. Table 8. Maturity matrix for SPM
4.3.4. Portfolio management
0 1 2 3 4 5 6 7 8 9 10 11 12
Finally, in Figure 8 and Table 7, the results of the Portfolio management part of the survey are illustrated and compared with the original matrix.
Figure 8. Boxplot Portfolio management Again, the intra-process capability dependencies are the same as in the original matrix. In the inter-process capability dependencies we see a few small deviations, which we will include in the matrix. Table 7. Portfolio management matrix 0 1 PM1 PM2 PM3 PM4
2 A A A A
3
4
5
6
B B
C C C C
B B A
7
8
9
RM1. Requirements gathering RM2. Requirements identification RM3. Requirements organizing
A
RP1. Requirements prioritization RP2. Requirements selection RP3. Release definition RP4. Release validation RP5. Launch preparation RP6. Scope change management
A
B A
C
D
B A
C C
B
B C D A B C D A B C A B C D A B C A B C
PR1. Theme identification PR2. Core asset identification PR3. Roadmap construction
A
B
PM1. Market trend identification PM2. Partnering & contracting PM3. Product lifecycle management PM4. Product line identification
A A A A
B B
A A
B B
C C C
B B
C C C C
In Table 8, we also show the score for one of the respondents in the benchmark questions. This respondent works for a company with less than 50 employees from the Netherlands. He did not have any education or certification in SPM. The overall SPM maturity level is determined by checking for which maturity level all capabilities (and the preceding capabilities) are implemented. As can be seen in the table, the maturity level in this case is 3. To advance to a higher maturity level, say level 4, work needs to be done in RM2, RP3, PM1 and PM2.
10 11 12
4.5 Threats to validity
C C C C
4.4 Results In Table 8, the final maturity matrix for SPM is presented. As can be seen in the table, the number of levels decreased to 10.We made some adaptations compared to the survey results. First, all capabilities of the Product roadmapping business function have all been shifted one level to the right. The dependencies between business functions were subject to the survey and we believe that the product roadmapping capabilities should be on a higher level. Finally, several capabilities that are placed on the highest maturity level of a certain area have been shifted to the right, namely
Validity refers to the degree to which a response measures what we intend for it to measure [20]. We identified three types of validity threats that are important to discuss, namely threats to conclusion validity, construct validity, and external validity. Internal validity is less important since this study is not about establishing a causal relationship. It is a descriptive study, in which we describe the mostly used implementation sequence of SPM capabilities. Firstly, conclusion validity is the degree to which conclusions we reach about relationships in the data are reasonable. Important is the composition of participants and the statistical analysis. At the beginning of the survey, respondents were asked to indicate with which of the SPM they were familiar. The respondents only got to answer questions about these familiar areas.
Therefore, we believe that the respondents were experienced enough to answer the questions they selected. Most of the respondents are not anonymously, since an email address is needed to send them the benchmark report. However, there is no reason to believe that they have not answered according to their best knowledge, since there is no social pressure to answer in a particular way. Therefore, we consider the conclusion validity not to be critical. Construct validity concerns whether we measure the construct that we believe we measure. On the introduction page of the survey, we have provided all definitions on all important concepts used in the questionnaire. Hence, we minimized the threat that participants interpret concepts differently. However, it is not possible to completely eliminate this threat. External validity concerns generalization of the results to other groups and contexts than the one studied. The survey was sent to different groups of SPM professionals, as is described in Section 4.2. The respondents are mainly product managers with varying experience, working for companies of varying sizes. Most of the respondents are from the Netherlands. Given the diverse background of the respondents concerning company size and experience, we believe that the validity is high within the product manager population in the Netherlands. Since we believe SPM is not particularly influenced by culture, we believe that we can also generalize the results to other countries. However, to be sure, more research is needed.
5. Implications and outlook The SPM Maturity Model can be used to determine the maturity level, but also be as a means to achieve process improvement by using it in the Product Software Knowledge Infrastructure (PSKI) [21]. The process improvement method consists of four steps followed by a feedback loop. Firstly, the current maturity level of an organization needs to be determined by filling in the SPM maturity matrix. Secondly, the optimal maturity level for the organization is determined; this is achieved by studying the situational factors [22] for the organization and its environment. Thirdly, the differences between the current and the optimal situation are analyzed and better suiting method fragments, selected from a knowledge base containing SPM method fragments, are suggested for the suboptimal processes. An incremental order to improve the processes is then suggested as an improvement guide for the organization. Finally, a feedback loop incorporates the knowledge gained in
this process into the knowledge base of method fragments.
6. Conclusion and future research In this paper, we described the development of a maturity framework for SPM that can be used to assess an organization’s current SPM capabilities and offer local, incremental improvements to the product manager. After developing the matrix, we used a survey in which 45 SPM professionals reported by indicating the right order in which SPM capabilities should be implemented in an organization. The results of this survey supported our initial positioning of the SPM capabilities, at least, when looking at the interprocess capability dependencies. Concerning the intraprocess capability dependencies, several deviations were found, of which most of them have been used to improve the matrix. Currently, we are carrying out multiple case studies to refine the capabilities. We believe that the maturity matrix for SPM is a valuable tool for process assessment and improvement in SPM. In future research, we will carry out case studies at different product software companies to further validate and refine the matrix in SPM capability improvement.
References [1] C. Ebert, “The Impacts of Software Product Management”, Journal of Systems and Software 80(6), 2007, pp. 850-861. [2] I. van de Weerd, S. Brinkkemper, R. Nieuwenhuis, J. Versendaal, L. Bijlsma, “Towards a Reference Framework for Software Product Management”, Proc. of the 14th Int. Requirements Engineering Conference, Minneapolis/St. Paul, Minnesota, USA, 2006, 312-315. [3] W. Bekkers, I. van de Weerd, S, Brinkkemper, A. Mahieu, “The Relevance of Situational Factors in Software Product Management”, Technical report UU-CS-2008-016, Utrecht, The Netherlands: Universiteit Utrecht, 2008. [4] I. van de Weerd, S. Brinkkemper, J. Versendaal,. “Concepts for Incremental Method Evolution: Empirical Exploration and Validation in Requirements Management”, LNCS 4495, 2007, 469–484. [5] A.R. Hevner, S.T. March, J. Park, S. Ram, “Design Science in Information Systems Research”, MIS Quarterly 28, 2004, pp. 75–105. [6] V. Vaishnavi, B. Kuechler, B. Design Research in Information Systems. Retrieved December 7, 2007, from AISWorld Net: http://www.isworld.org/Researchdesign/drisISworld.htm [7] M. Abramovici and O.C. Soeg, Status and Development Trends of Product Lifecycle Management Systems, RuhrUniversity Bochum, Chair of IT in Mechanical Engineering (ITM), Germany, 2002.
[8] P. Clements and L. Northrop, Software Product Lines: Patterns and Practice. Reading, MA: Addison Wesley, Boston, MA, 2001. [9] M. van Steenbergen, S. Brinkkemper, M. van den Berg, “An Instrument for the Development of the Enterprise Architecture Practice”, Proc. of the 9th Int. Conference on Enterprise Information Systems, 2007, pp. 14–22. [10] M.C. Paulk, B. Curtis, M.B. Chrissis, C.V. Weber, "Capability Maturity Model, Version 1.1," IEEE Software 10(4), 1993, pp. 18-27. [11] CMMI Product Team, Capability Maturity Model Integration (CMMI) Version 1.1 Staged Representation, Tech. Report CMU/SEI-2002-TR-029, Carnegie Mellon University, 2002. [12] M.A. Cusumano, The Business of Software, New York: Free Press, 2004. [13] ISO/IEC 15504, Information Technology – Software Process Assessmen,t ISO/IEC, 1996. [14] J.P. Kuilboer, N. Ashrafi, “Software Process and Product Improvement: An Empirical Assessment”, Information and Software Technology 42(1), 2000, pp. 27-34. [15] D.J. Reifer, “The CMMi: It’s Formidable”, Journal of Systems and Software 50(2), 2000, pp. 97-98. [16] S. Zahran, Software Process Improvement: Practical Guidelines for Business Success, Addison-Wesley, Reading MA, 1997. [17] J.G. Brodman, D.L. Johnson, “What Small Businesses and Small Organization Say About the CMM”, Proceedings of the 16th International Conference on Software Engineering, IEEE Computer Society Press, Los Alamitos, CA, 1994, pp. 247-262. [18] T. Koomen, R. Baarda, TMap Test Topics, Tutein Nolthenius, Den Bosch, The Netherlands [19] I. van de Weerd, IT and Software Product Management, retrieved Februari 1, 2009, from IT- and Software Product Management: http://www.softwareproductmanagement.org/. [20] C. Wohlin, P. Runeson, M. Höst, M.C. Ohlsson, B. Regnell, A. Wesslén, Experimentation in Software Engineering: An Introduction, Kluwer Academic Publishers, 1999. [21] I. van de Weerd, J. Versendaal, S. Brinkkemper, “A Product Software Knowledge Infrastructure for Situational Capability Maturation: Vision and Case Studies in Product Management”, Proc. of the 12th Working Conference on Requirements Engineering: Foundation for Software Quality (REFSQ'06), Luxembourg, 2006, pp. 97-112. [22] W. Bekkers, I. van de Weerd, S. Brinkkemper, A. Mahieu, “The Influence of Situational Factors in Software Product Management: An Empirical Study”, Proc. of the 21st Int. Workshop on Product Management, Barcelona, 2008.
Appendix I – SPM Capabilities [3] Requirements gathering A Ad hoc requirements gathering. Requirements are being gathered and registered. B Organized requirements gathering. All incoming requirements are stored in a central place (for example in a spreadsheet).
C Integrated requirements gathering. Internal and external stakeholders use various channels (e.g. website, helpdesk) to submit requirements, which are automatically stored in a central database. D Optimized requirements gathering. Requirements are being gathered and stored automatically, for example by data mining in emails, setting out competitor spiders, etc. Requirements identification A Ad hoc requirements identification. For incoming requirements, immediately a consideration is made whether they can be implemented in the product. B Organized requirements identification. Incoming requirements are being identified as market or product requirement. Product requirements are written in a predefined template. C Optimized requirements identification. Market and product requirements in the entire product portfolio are automatically linked, for example by using advanced techniques, such as linguistic engineering. Requirements organizing A Release-based requirements organization. For each release, requirements are organized by, for example, theme, function or core asset. B Roadmap-based requirements organization. Organizing requirements is based on the product roadmap. Dependencies between different requirements are also identified. C Portfolio-based requirements organization. The organization of product requirements is automated. The various products, core assets, themes and the product roadmap are linked to each other. Requirements prioritization A Ad hoc requirements prioritization. Requirements are prioritized. B Release-based requirements prioritization. Before defining the release content, requirements are prioritized by multiple internal stakeholders. A light-weight prioritization technique such as MOSCOW is used. C Roadmap-based requirements prioritization. During requirements prioritization, the roadmap is used as a guide and the dependencies between the different requirements are taken into account. D Portfolio-based requirements prioritization. During requirements prioritization, the products and core assets are taken into account, as well as information about the costs and revenues of each requirement. Sophisticated techniques such as integer linear programming are used. Requirements selection A Ad hoc requirements selection. Requirements that have the highest priority are selected for the next release. B Release-based requirements selection. During requirements selection for the next release, constraints concerning engineering capacity are taken into account. C Roadmap-based requirements selection. Multiple releases are included in the requirements selection process and dependencies between requirements are handled. D Portfolio-based requirements selection. During the requirements selection process, multiple releases, products and core assets are taken into account. Release definition A Ad hoc release definition. A release definition of approximately one page is being written, which contains an overview of the requirements that will be implemented, a time path and the needed capacity. B Organized release definition. A standard release definition template is used to write the release definition.
The release definition is communicated to the internal stakeholders. C Optimized release definition. The release definition is generated from the list of selected requirements and the roadmap. It is communicated to internal and external stakeholders. Release validation A Ad hoc release validation. De release definition is checked internal stakeholders, before the software is realized. B Organized release validation. The release definition must be formally approved, before the software is realized. C Integrated release validation. A business case (including the ROI) is being written before the software is realized. D Optimized release validation. Business intelligence is used to create a business case. Information concerning requirements’ costs and revenues and experiences with earlier releases is used. Launch preparation A Ad hoc launch preparation. Before the new release is launched, an informative email is being sent to internal stakeholders. B Organized launch preparation. Internal and external stakeholders are informed about the upcoming release and trainings are organized. A formal ‘go’ decision must be obtained from the board. C Optimized launch preparation. Internal and external stakeholders are notified automatically about the progress of the upcoming release, in order to prepare things like promotion material and trainings. Scope change management A Ad hoc scope change management. In case of a scope change, project managers and/or developers are being informed. B Organized scope change management. A formal scope change management is in place, in which all involved stakeholders are informed. C Optimized scope change management. The scope change management process is automated, which makes is possible to: automatically notify the involved stakeholders; run an impact analysis and propose alternative plans. Theme identification A Ad hoc theme identification. A list of themes is created, which is used to decide on the contents of the release. B Organized theme identification. Release themes are identified and maintained. Themes are decided on together with the internal stakeholders. C Optimized theme identification. Identification themes results in a list of release themes that are stored centrally, so that requirements, core assets, market trends etc. can be linked to it. Core asset coordination A Organized core asset coordination. All core assets are registered in standardized manner and are stored in a central location. B Externally oriented core asset coordination. External sources are investigated based on ROI in the search for core asset acquisition: partners, outsourcing or subcontracting of development. C Optimized core asset coordination. An automated procedure of acquiring core assets created by external parties, such as SOA, is in place to buy and sell core assets.
Roadmap construction A Ad hoc roadmap construction. A product roadmap exists in which the releases of the upcoming period are described. B Organized roadmap construction. Product roadmap(s) are created in consultation with internal stakeholders. The roadmap spans over multiple releases describing a period of at least one year and is actively maintained. C Optimized roadmap construction. Roadmaps are created in consultation with both internal and external stakeholders. (Part of) the roadmap is communicated to the market. Market trend identification A Ad hoc market trend identification. A document with market trends is being maintained. B Organized market trend identification. There is an active search for market trends. All search findings are recorded in standardized forms. C Optimized market trend identification. Large research projects are set up to investigate trends among every type of external party (customers, competitors, partners). Partnering & contracting A Organized partnering & contracting. A process is in place to actively investigate make-or-buy decisions. Standard SLA’s are used. B Externally oriented partnering & contracting. A partner network and/or partner portals are used to regulate partnering. C Optimized partnering & contracting. KPI’s are set up to monitor the performance of partners on a regular basis. Product lifecycle management A Organized product lifecycle management. All internal stakeholders are involved in product lifecycle management, and know in which phase of the lifecycle a product is. B Externally oriented product lifecycle management. External stakeholders are involved in the monitoring of deciding about product lifecycles. C Optimized product lifecycle management. Product lifecycles are tuned to each other across the entire portfolio, ensuring smooth transition between products, and maximizing the products lifecycle. Product line identification A Ad hoc product line identification. Product lines are used, but not actively managed or monitored. B Organized product line identification. Product lines are actively managed and monitored, with several internal stakeholders are involved. C Externally oriented product line identification. Product lines are in line with those of external parties such as partners and suppliers.