AN
Y
FO RM AT
Developing and Implementing a Stochastic Decision-Support Model Within an Organizational Context: Part II—The Organization
STEIN W. WALLACE
IT
IS
IL
LE
GA L
TO
is a professor of quantitative logistics at Molde University College, Norway.
[email protected]
58
TI
describe how the model is used, how data are collected, responsibilities distributed, and decisions made. Further, we discuss our experiences in using the methodology. We explain how the methodology has been successful in integrating new employees into the investment philosophy of the group, and we address what we see as the challenges in using such a methodology. In particular, we discuss the process of group decision making on which the fund is based. We consider the issues that complicate this process, in particular differences in personal risk attitudes. The fund has a good track record, as will be presented.
TH
IS
AR
E
CE
is senior vice president in charge of the Department of Asset and Risk Allocation at Gjensidige NOR Asset Management, Norway.
[email protected]
nterprise risk management has been defined as the strategy that aligns the firm’s business with the risk factors of its environment in the pursuit of strategic objectives. Mathematical models will always be part of enterprise risk management. By means of a case study, we discuss why it is necessary to align a model with the organization in order to achieve the desired results. The structure of a model’s input must fit with the structure of data collection in the firm, and the output must be consistent with the decision structure. Otherwise, data collection will not be properly taken care of and the results of a model will not find their way to where decisions are made. Since July 1999, Gjensidige NOR Asset Management has used a stochastic programming-based decision-support model for its internal macro hedge fund. The model was developed over a period of five to six years in cooperation with the Norwegian University of Science and Technology and, later, Molde University College. This time was needed to develop the ideas as well as the necessary tools and procedures. This is the second of three articles detailing how it has been necessary to take into account the organization while developing the model and also to adapt the organization consistently to the structure of the model. We
DU
ERIK RANBERG
Part 1 of this article appeared in the Summer 2003 issue of The Journal of Risk Finance.
RO
is first vice president in the Department of Asset and Risk Allocation at Gjensidige NOR Asset Management, Norway.
[email protected]
RE P
KJETIL HØYLAND
CL E
IN
KJETIL HØYLAND, ERIK RANBERG, AND STEIN W. WALLACE
THE USE OF THE MODEL AND ITS IMPACT ON THE ORGANIZATION
This section describes how the model is used by the TAA team and also discusses how the organization has adapted to the structure of the model. We describe the asset class universe from which the TAA team presently can choose, illustrate how responsibilities are distributed within the TAA team, and discuss modeling implications of such a setup. Finally, we show how the model fits into the TAA investment process and how the hedge fund is run on a day-to-day basis. Asset Class Universe
The fund is run as a pure overlay fund; that is, only derivatives are used. Until recently,
DEVELOPING AND IMPLEMENTING A STOCHASTIC DECISION-SUPPORT MODEL WITHIN AN ORGANIZATIONAL CONTEXT Copyright © 2004 Institutional Investor, Inc. All Rights Reserved
WINTER/SPRING 2004
futures were the only derivatives in TAA model, but lately options have been included as well. The asset classes defined within the investment universe are money market, bonds, equities, currencies, and commodities. The U.S., Japan, U.K., EMU area, Norway, and Sweden are potential regions to invest in. For the money market, we use futures on the LIBOR interest rates at different expiry dates. Potential asset classes for bonds are two-, five-, and ten-year bonds. For equities we use the most liquid futures in each region. For currencies, the number of potential asset classes equals the number of regions less one, since we define all currencies relative to the U.S. dollar. Altogether, the investment universe consists of more than 40 assets. The number of assets included in each run will, however, be smaller, typically 20-25. One part of the investment process is to select the asset classes on which we have the strongest views. Some of the asset classes are highly correlated, like the two-year bond future and the LIBOR rate one year forward, and these would not be included in the same run. As a rule of thumb, we do not include two asset classes with an expected correlation larger than 0.7-0.8 (in the normal state of the world). This is to avoid taking large positions based on possibly false large positive or negative correlations. With respect to equities, research has shown that sector allocation has had a growing impact on equity performance relative to country allocations; see for example Meric and Meric [1998]. Returns in different sectors have in recent years become, on average, less correlated than returns in different regions. Until recently our focus has mainly been on country allocation. At the moment, we are in the process of complementing the country allocation focus with sector allocations. See more on this in the next section. For commodities, the Goldman Sachs Commodity index, a broad commodity index, and oil (Brent crude) are the investment vehicles used today. Distribution of Responsibilities
The investment universe is large for a small team of people. To be able to cover the investment universe and obtain market expectations of high quality, we need to delegate responsibilities, make use of other internal and external resources, and use information technology and modeling systems in an efficient way. It is beyond the scope of this article to explain the expectation processes in detail. We will focus on how the TAA team is organized relative to the required model input and show how WINTER/SPRING 2004
the organization of the team influences modeling choices in the TAA process. The fund is run on a team consensus basis. In other words, the team as a whole discusses and agrees on the expectations about the markets. The model requires extensive inputs, and it is seen as crucial that all input data have an “owner.” This ensures that no model input is overlooked and, hopefully, leads to high-quality inputs. The team consists of seven analysts. We split the world into five regions. Japan, U.S., U.K. and Sweden, EMU-Europe, and Norway, and assign one analyst to each of these regions. Further, one global analyst focuses mainly on the global expectations for cash, bonds, equities, commodities, and currencies. The last member of the team is responsible for global sector analysis within equities. Expectations need to be quantified both for the marginal distributions and for correlations. The distribution of responsibilities is clear-cut for the marginals. For correlations, however, the process is naturally a bit more complex. As regards marginal distributions, the regional analyst is responsible for selecting the appropriate asset classes within the regional asset universe and for quantifying the expectations. Typically this involves specifying the four central moments for a broad equity index, ten-year bonds, and one or two money market futures. The global analyst’s main responsibility is input to the expectations for the “global returns” in cash, bonds, equities, and commodities. Further, he is responsible for currency estimates. Clearly, the global analyst plays an important role, and he is typically the most experienced analyst. The sector analyst on equities is responsible for quantifying his views on the main global sectors. Naturally, expectations within different regions, expectations for global cash, bonds, commodities, and equities, and expectations for sectors all interrelate. For instance, since both the global analyst’s asset class expectations and the sector analysts’ sector expectations are dependent on where we are in the economic cycle, there is a tight link between the global analyst’s views and the sector analysts’ views. Further, input from the different regions influences the views of the global analyst and vice versa. The TAA team clearly faces a challenge when all expectations are to be calibrated; see the next subsection for more on this. Specifying the marginal distributions is a comprehensive task, but specifying the correlation matrix can be even more of a challenge. With, say, 20 assets there are 190 correlations to estimate. It is well known that correlations THE JOURNAL OF RISK FINANCE
It is illegal to reproduce this article in any format. Email
[email protected] for Reprints or Permissions.
59
can change dramatically over time, not only in size but also in sign. Just as the expectations for the marginal return distributions are judgmental, so are the expectations on the correlations. The TAA team is not comfortable with uncritically using empirical correlation matrices as input to the model and seeks to have an active view also on correlations. Empirical analyses are run, but the results are not mechanically used as input to the model. In addition to the marginal distributions, the analyst responsible for a region must also specify his expectations for the correlations within the region. The hardest correlations to understand and estimate are often the cross-asset class–cross-region correlations, such as the correlation between U.S. stocks and U.K. bonds. To specify these correlations simple heuristics are applied. For instance, given the correlation between U.S. stocks and U.S. bonds, and U.S. bonds and U.K. bonds, it is possible to make an intelligent estimate of the correlation between U.S. stocks and U.K. bonds. In addition to splitting responsibilities between regions, responsibilities are also split between asset classes and model development. To improve the quality of the input data, each member of the team has a special responsibility to develop decision support models for an asset class, which should be used across regions. Of the seven analysts, two to four spend some time each day closely following the information flow and market developments. There is always one portfolio man-
ager who is sitting close to the market, and whose responsibility is to inform the team if there are significant changes in market conditions and to execute the trading strategies. See more on this in the next section. The Model and the Investment Process
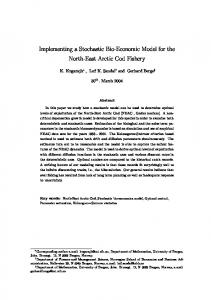
This section describes the investment process and explains the role of the TAA model. We will particularly emphasize the parts of the process that are influenced by the modeling framework. We have split the investment process into six steps as shown in Exhibit 1. 1. The previous section explained the required model input. At least once a month each analyst must quantify his market expectations. To secure the quality of these inputs, a structured information collection process and a systematic market analysis approach is needed. 2. Distributional properties implied by the markets can be found via option prices; see for example Jackwerth and Rubinstein [1996]. For the asset classes on which there are liquid options, our estimates for volatility, skewness, and kurtosis are compared with the implied volatility, skewness, and kurtosis derived from option prices. 3. The portfolio construction is an iterative process as illustrated in Exhibit 2. The starting point is our
EXHIBIT 1 The Investment Process 1. Establish market expectations
6. Evaluation
2. Compare expectations to expectations in market
5. Surveillance and portfolio tuning
3. Construct portfolio
4. Analyze and stress-test portfolio
60
DEVELOPING AND IMPLEMENTING A STOCHASTIC DECISION-SUPPORT MODEL WITHIN AN ORGANIZATIONAL CONTEXT Copyright © 2004 Institutional Investor, Inc. All Rights Reserved
WINTER/SPRING 2004
market expectations. A large number of scenarios consistent with these expectations, typically a few thousand, are generated and visualized by histograms for each marginal distribution. The team discusses the visualization, and more often than not, some expectations are changed when the team is confronted with the graphical representation of the expectations. When the generated scenarios are accepted, they are input to the TAA optimization model. The TAA model is run, and the optimal asset allocation mix is analyzed. Experience has shown that there are many asset allocation mixes that are almost equally good in the sense that they provide approximately the same risk/reward trade-off. If we are not comfortable with the allocation mix, this is usually due to the market expectation input. We would therefore make a second opinion and change some of the market expectations. However, if we think market expectations are appropriate and we dislike certain minor aspects of the optimal asset allocation, we will constrain the portfolio construction problem based on experience, even though this means that the constrained optimization problem will find a portfolio with slightly worse risk/reward trade-off. An example can be to constrain the position in an asset class for which we lack conviction in our estimate for the expected return distribution (but where the estimate is still our best guess). It is important to note, however, that the model decides the main structure of the portfolio, and that the subjective constraints only to a small extent influence that structure. From a modeling perspective, it is our belief that the error introduced by the subjective constraints is well within the error bound of the model itself. 4. Return and risk attribution analyses, in addition to stress testing, are done on the optimal portfolio. The risk and return attribution allocates the expected return and expected risk to the individual positions in the portfolio. For stress testing the portfolio is tested by historical simulation and on subjective stress scenarios (which of course are different from the ones used in the optimization). The historical simulations show the performance and volatility of the return of the portfolio during different economic regimes. Such information is useful for estimating the risk and analyzing the characteristics of the portfolio. The historical simulation WINTER/SPRING 2004
EXHIBIT 2 The Portfolio Construction Process
Generate market expectations Run scenario generation and visualize market expectations No
Scenarios OK? Yes Run TAA optimization
Add constraints
No
Portfolio OK? Yes Implement portfolio
will for instance provide information on whether the portfolio is a market trend follower or, to the contrary, is seeking for a turning point in the financial markets. 5. New information arrives and prices change continuously. In such an environment, the TAA team finds it important to respond quickly to new information or changes in market conditions. The TAA optimization creates a core portfolio. As a response to new information or price changes, this portfolio can be tuned without a new run of the TAA optimization model. But the main structure of the portfolio will not change without a rerun. Adjustment of the size of the positions, however, and even putting on or taking off positions which are fairly independent, i.e., have a low correlation with the rest of the portfolio, is done on a continuous basis. As each team member is responsible for a subset of the market expectations, an initiative to make changes in the portfolio can come from anyone on the team. Often it will come from one of the portfolio managers who closely monitor the markets THE JOURNAL OF RISK FINANCE
It is illegal to reproduce this article in any format. Email
[email protected] for Reprints or Permissions.
61
and the news flow. To do a reallocation, the portfolio manager in charge and another member of the team, either a regional analyst or the global analyst, must agree. If new information or large price moves trigger the need for major revisions, a complete review of market expectations and a new TAA run will be done. 6. At the monthly (or more frequent) TAA meetings, the previous portfolio is evaluated. There are several challenges in the evaluation process. First, simply looking at the profit and loss of each position is not adequate. Some positions will be so-called profit generators, while others will be hedges. Often, hedge positions have an expected loss. So we need to compare expectations with realizations. Evaluating the estimates for the mean is straightforward, as the realized return can be compared with the estimate directly. Evaluating the estimates for correlations, standard deviations, skewness, and kurtosis is, however, more difficult. For the period over which the expectations are given, there is of course only a single observation. Therefore, we need to split the period into shorter time units, typically days, and use these intra-period observations to estimate the statistical properties. Since the statistical properties are not time-scale invariant, this approach is not correct, but it is the best one can do. Clearly, it is possible to look at the profit or loss for the fund as a whole in order to measure its success. Evaluating the contribution from each member of the team is more difficult. But since the market expectations are quantified and documented, and since they can, to some extent, be compared to what actually happened, we believe the evaluation process is of high quality and adds value. We are very careful not to base our evaluation on hindsight. Diversification in Time
Financial markets have trends and tend to be mean reverting with different time horizons. Some market participants seek to explore such trends on an intra-day basis; others explore long-term trends related to the business cycle. The TAA team seeks to exploit the price movements within the different time horizons, and splits the investments into three strategies that have different investment style characteristics: 62
• Long-term: 3 to 12 months • Medium-term: 1 to 3 months • Short-term: less than 1 month. The medium-term process is described in this article and is at the heart of the activities in the TAA team. The optimal portfolio, which is a result of market expectation with a time horizon of three months, is meant to capture medium-term market moves. The described modeling framework is most actively used in this medium-term TAA. The model is used on the other levels as well, but not as actively. The long-term TAA positioning seeks to exploit what we see as major long-term trends during an investment year. The team seeks to identify the beginning or the end of longer-term trends within and between asset classes. Typically, the longer-term positioning is done via options. With investment vehicles with linear return functions like futures, we need to be right on whether markets are going up or down in order to generate excess return. Options are non-linear in their payoff structure and allow for bets that are more tailor-made to the market expectations. The modeling framework allows for a description of asymmetric distributions and fat tails. A key source of excess return, in our view, is tailor-made positions relative to market expectations and risk appetite. When options are included this is exactly what the model helps us do. The long-term positions will be evaluated on a continuous basis as well as in each TAA meeting. However, as the horizon is longer for these positions, larger price moves or more significant new information are needed to change them. The short-term TAA style includes the activities discussed earlier in this section regarding tuning of the medium-term portfolio as prices change and new information arrives. This tuning activity seeks to exploit shorter-term market fluctuations. The TAA team also includes discretionary traders who are active in the market on a daily basis. The time horizon for the positions taken varies from intra-day to intra-month. The traders sit close to the market in terms of news flow and price action. The traders are not only there to generate excess return, but also to function as an information provider and “noisefilter” for the rest of the group. The primary goal for all activities is to generate excess return. If each investment style generates positive expected excess return, and is not perfectly correlated
DEVELOPING AND IMPLEMENTING A STOCHASTIC DECISION-SUPPORT MODEL WITHIN AN ORGANIZATIONAL CONTEXT Copyright © 2004 Institutional Investor, Inc. All Rights Reserved
WINTER/SPRING 2004
with the others, then adding them together clearly improves the risk/reward trade-off compared to a single strategy fund. We are aiming to create excess return from all three investment styles and to have low correlation between the return of each style, and believe we achieve what we call diversification in time. We also believe that the different styles provide synergies. For instance, the medium- and long-term styles take advantage of the input from the traders for improving the shorter-term timing and the traders depend on the input from the investment processes done in the mediumterm style. Risk is allocated between the three styles so that there is a balance between risk and the competence, expected excess return, and resources at each level. CONCLUSIONS—PART 2
In this second article in a series of three, we have discussed the alignment of the model and the organization. In our view, this is crucial, and many operations research models have failed over the years due to their lack of alignment. In part 3 we will discuss our experience with the use of the model.
WINTER/SPRING 2004
ENDNOTES The methodologies presented in this article are largely based on the doctoral dissertation of Kjetil Høyland, who holds a Ph.D. in stochastic programming from the Norwegian University of Science and Technology. The work was performed under the supervision of Stein W. Wallace, formerly a professor of business administration at that school. Much of the work presented in this article was done while Stein W. Wallace visited the Centre for Advanced Study at the Norwegian Academy of Science and Letters, as group leader during the academic year 2000/01.
REFERENCES Jackwerth, J.C., and M. Rubinstein. “Recovering Probability Distributions from Option Prices.” Journal of Finance, 51 (1996), pp. 1611-1631. Meric, G., and I. Meric. “Correlation Between the World’s Stock Markets Before and After the 1987 Crash.” The Journal of Investing, 7 (1998), pp. 67-70.
To order reprints of this article, please contact Ajani Malik at
[email protected] or 212-224-3205.
THE JOURNAL OF RISK FINANCE
It is illegal to reproduce this article in any format. Email
[email protected] for Reprints or Permissions.
63