DEVELOPING “PRR Processing” SOFTWARE TO PROCESS PRR2600 DATA Dinh Ngoc Dat1, Jitraporn Phaksopa2, Siriporn Pangsorn2, Tu Tuyet Hong2 1
Department of Remote Sensing Technology, GIS, GPS Space Technology Institute, 18A Hoang Quoc Viet, Hanoi, Vietnam Email:
[email protected] 2 Department of Marine Science, Faculty of Fisheries Kansetsart University, Thailand Email:
[email protected] 2 Training Department Southest Asian Fisheries Development Center, Thailand Email:
[email protected] 2 University of Information Technology Ho Chi Minh, Vietnam Email:
[email protected]
ABSTRACT Nowadays, Remote Sensing as a useful technology for monitor a large area. Actually, accuracy on satellite image is still a problem so we have to test it with ground-based data. PRR2600 model is a ground instrument with 8 visible reflectance wavebands. Some wavebands is same as wavebands contained on SeaWiFS data. The wavebands value (calibrated data) which is received after put down PRR2600 to sea water is a based factor to calculate Chlorophyll index by OC4 algorithm. This study is a method to fast calculate Chlorophyll index based on waveband value which is received by PRR2600 model. We use Visual Basic 6 as main programming language and select some linear functions to smooth data and display waveband graph so we can easily to interpret. Keyword: PRR (Profiling Reflectance Radiometer System), OC4 (Ocean Color 4)
1.
INTRODUCTION
Satellite image is a source to initial Chl-a concentration and some Inherent Optical Properties. The accuracy of result which is received after calculate image data, however, is not high because wavelengths which are received by satellite have to process atmosphere impact (atmosphere correction). At the moment, we have other method to calculate some sea water coefficients with high accuracy, it is PRR instrument. Using filter and linear algorithm, we can reduce our processing time to process calibrated data from this instrument. To solve this problem, we need to recognize structure of database which is exported from PRR instrument and to concretize some processing steps in a individual software (PRR Processing). The most important of this database is a data table so it contains wavelengths measured value that called Calibrated Data table. This software is developed by a popular programming language (Visual Basic 6). It is a simple programming language and quickly for developing a small software. “PRR Processing” will read the content of CalibratedData table so we chose and processed this table in some steps below: - Open Database and Star processing. International Symposium on Geoinformatics for Spatial Infrastructure Development in Earth and Allied Sciences 2008
- Choose Calibrated Data table and display the content of this table. Software have to recognize errors cell which appear in this table. - Process errors data. (we can see depth graph if we want). - Choose one line with start row and end row in grid data (up or down) so Ed0 value between the period rows is not change so much. - Choose “Graphs of EdZ values” to draw graph for each wavelength EdZ values and get out data between the all rows which is selected in last step. - Choose method, depth value or list of rows and unit of value to process. And then we start process data is selected. - Calculate Chl-a and some coefficient Inherent Optical Properties. - We can export all graphs to bitmap and Properties file (excel format) – if we want. 2.
METHOD
2.1. Object Orient Programming Before to design the interface, we design some modules to process raw data draw graphic data so it can stay independent. It is mean that, we can use it to develop another software which has similar structure. 2.2. Database programming Software is developed base on some rules which conform to database management rule. 2.3. Survey, compare and statistic Currently, we have some ocean color formula to calculate chlorophyll index as OC2V4, OC4V4, OC4-GLIV3, OC3M but the accuracy for each formula is very different with each area. OC4V4 is validated and relative suitable for Vietnam water. With 12 stations working with PRR2600, almost plots is gotten from this “PRR Processing” software which is compared with all of plot is processed by excel. 3.
RESULT
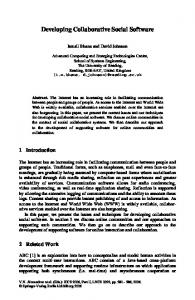
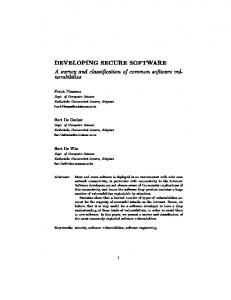
Output data of PRR2600 is a file access database so that our software import and read structure of this database (figure 1). We have to process the data which is contained inside CalibratedData table (figure 2). In this table includes information of 8 bands correlative with SeaWiFS data. In this table, it has many empty cell (error cell). If it has many empty cell follow a row or column we can delete this row or column or keep it to calculate by a mean value.
Developing “PRR processing” software to process PRR2600 data
Fifure 1. Open a access database which is exported by PRR2600
Fifure 2. Open CalibratedData table
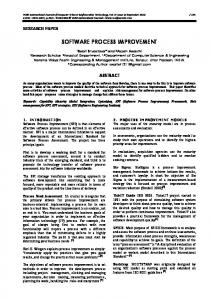
Fifure 3. Process error cell We can delete or keep empty cell by hand or automatic. With automatic method, we keep all empty cell and fill a value to it with a mean value follow this formula: Cell(i,j) = sqrt(cell(i-1,j)*cell(i+1,j)) i: row number j: column number
International Symposium on Geoinformatics for Spatial Infrastructure Development in Earth and Allied Sciences 2008
When we finish putting data to empty cell (figure 3), we can see a graph under the data table. Green line describes the status when we drop down and pull up PRR2600. If the green line is not change too much, it mean that instrument moving near with vertical direction and we can get a good data. On this case we choose data from row 1080 to row 1339 (figure 3).
Fifure 4. Choose series of row for processing Also we choose the best time drop down instrument but data still very noisy. It is very simple to understand for this case, because, sea wave effects to the instrument so that it can not moving follow absolute vertical direction and instrument moving follow wave. We should smooth data by linear function because we can not see clear the final result at sea surface. We have three methods (Geomean, Log, Growth) for smooth data. All of them extrapolated the future data. We have to choose number of rows will be group for extrapolate. Table 1. Extrapolated functions for smooth data Function
Formula
Geomean
y = (y1i*y2i*y3i…*yni)1/n
Log
y=10^(log(y1i)+log(y2i)+…+log(yni))/n
Growth
y = bm^x
Now, we have smooth data and it is very clear and we can check it with traditional method (processing by excel). For 12 stations, we process CalibrateData follow two tools (PRR Processing and Excel). With “PRR Processing” we can process it around 3minutes but with excel we have to process it around 20-25 minutes because we have to find and remove empty cell. 3.1. EdZ value
Developing “PRR processing” software to process PRR2600 data
Vertical Profile of EdZ EdZ 0
20
40
60
80
100
120
140
0 2 4
Depth(m)
6 8 10 12 14 16
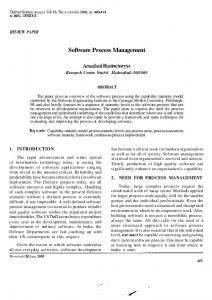
Fifure 5. EdZ plot is gotten from “PRR Processing” and Excel 3.2. K values
Vertical Profile of Kd Kd (1/m ) 0.00
0.05
0.10
0.15
0.20
0.25
0.30
0 2 4
Depth(m)
6 8 10 12 14 16
Fifure 6. K plot is gotten from “PRR Processing” and Excel 3.3. Rrs values
Vertical Profile of Rrs 0.000
0.005
0.010
0.015
0.020
0.025
0 2
Depth(m)
4 6 8 10 12 14 16
Fifure 7. Rrs plot is gotten from “PRR Processing” and Excel International Symposium on Geoinformatics for Spatial Infrastructure Development in Earth and Allied Sciences 2008
3.4. Rrs surface Rrs at Surface of Station 5 0.006 0.005 0.004 0.003 0.002 0.001 0 Rrs380
Rrs412
Rrs443
Rrs490
Rrs555
Rrs625
Rrs665
Wavelength(nm)
Fifure 8. Rrs plot is gotten from “PRR Processing” and Excel 3.5. Coefficient IOP values The final purpose of this software is getting all Coefficient Inherent Optical Properties (IOPs) values and Chl-a index. Chl-a: Chl-a = 10^(a0 + a1*R + a2*R^2 + a3*R3 + a4*R4) a0 = 0.336; a1 = -3.067; a2 = 1.930; a3 = 0.649; a4 = -1.532 R=log10(Rrs(443)>Rrs(490)/Rrs(555)) IOPs:
Fifure 9. Coefficient Inherent Properties 4.
CONCLUSIONS
This software is compatible with access database which is exported from PRR instrument (model 2600); It can to get result data as well as to get data from excel, however, it needs small time to get result data; It is a vivacious software because user can export final data after processing to other format data as bitmap and excel file. 5.
REFERENCES
Francesco Balena, 1999, Programming Microsoft Visual Basic 6.0, Microsoft Press. IOCCG report number 1-6, Report of International Ocean-Color Coordinating Group. Kosei Sasaoka, 2004, Bio-Optical properties and in-water algorithm validation for ocean color remote sensing in the sub-arctic North Pacific, Honolulu, Hawaii. Tran Van Dien, 2005, Monitoring Algal Bloom in Vietnam Waters from Ocean Color Satellite Data, ACRS, Hanoi, Vietnam. Satsuki Matsumura, 2004, Satellite regional ocean color algorithms for detecting Chlorophyll-a, Suspended Sediments and Colored Dissolved Organic Material on the Gulf of Thailand, ACRS, Chiang Mai, Thailand. Developing “PRR processing” software to process PRR2600 data