Figure 5: Polychrome stucco relief, Virgin and Child, Italy 15C, by Vittorio Ghiberti. (a) A screenshot of detailing the plaster crack in various dimensions in our ...
The 13th International Symposium on Virtual Reality, Archaeology and Cultural Heritage VAST (2012) D. Arnold, J. Kaminski, F. Niccolucci, and A. Stork (Editors)
Developing Open-Source Software for Art Conservators Min H. Kim1 1 KAIST,
Holly Rushmeier2 South Korea
John ffrench2 2 Yale
Irma Passeri2
University, USA
Abstract Art conservators now have access to a wide variety of digital imaging techniques to assist in examining and documenting physical works of art. Commonly used techniques include hyperspectral imaging, 3D scanning and medical CT imaging. However, most of the digital image data requires specialized software to view. The software is often associated with a particular type of acquisition device, and professional knowledge and experience is needed for each type of data. In addition, these software packages are often focused on particular applications (such as medicine or remote sensing) and are not designed to allow the free exploitation of these expensively acquired digital data. In this paper, we address two practical barriers in using the high-tech digital data in art conservation. First, there is the barrier of dealing with a wide variety of interfaces specialized for applications outside of art conservation. We provide an open-source software tool with a single intuitive user interface that can handle various types of 2/3D image data consistent with the needs of art conservation. Second, there is the barrier that previous software has been focused on a single data type. The software presented here is designed and structured to integrate various types of digital imaging data, including as yet unspecified data types, in an integrated environment. This provides conservators the free navigation of various imaging information and allows them to integrate the different types of imaging observations. Categories and Subject Descriptors (according to ACM CCS): I.3.4 [Computer Graphics]: Graphics Utilities— Software support
1. Introduction Many digital imaging technologies have become valuable tools in physical art conservation. The nondestructive nature of imaging, and the rapid acquisition of data over large areas offers great advantages over other techniques such as taking small physical samples or taking measurements at individual points. However, the full potential of digital imaging has not been realized because of the difficulty of assembling the various types in a common framework to develop an integrated view of an artifact. In this paper we present a new open-source tool to facilitate the viewing and navigation of multiple image data types in a form that is convenient for an art conservator. Various types of imaging techniques, generally targeted at other applications, have been developed and are becoming ever more popular among art conservators. Clearly, digital camera images and 2D scans of historic photographs are useful in documenting works. Beyond these basic tools however advanced imaging technology such as X-rays, hyper-/multic The Eurographics Association 2012. �
spectral imaging, 3D scanning, and computed tomography (CT) imaging are being used with increasing frequency. Current software environments for advanced imaging techniques are however generally bound to specific imaging hardware and/or applications. Companies developing the hardware provide system-specific software applications often at extra cost. Sometimes software is provided by other sources, but for a single end application – i.e. medical applications for CT scans, or mechanical manufacturing applications for 3D scanners. Such systems do not facilitate importing other data types, and include many modules and interface options that are not relevant to the needs of art conservation. Worse yet, various software systems use different interface conventions for tasks that should be similar across data types – e.g. navigation, zooming and lighting. The cost, complexity, and inconsistency of interfaces in software for using different types of imagery have become an obstacle for the art conservators when they try to adopt new imaging technology for their tasks. Even if they could
M. H. Kim, H. Rushmeier, J. ffrench, & I. Passeri / Developing Open-Source Software for Art Conservators
afford multiple workstations to support running multiple software systems simultaneously to examine, for example, a CT scan, a 3D scan and a stack of hyperspectral images of an artifact, their work is hindered by needing to constantly adjust to different interface conventions. A tool is needed that can be used to import data without unneeded functionality from other applications, and with an intuitive common interface. Beyond importing various known imaging formats, an extensible framework is needed for future image data types. The framework needs to be flexible enough to allow existing interface options to be used with new data. For instance, if a conservator receives data from hyperspectral 3D scanning, it should be possible to adapt the software to investigate the data with the same navigation and lighting controls as used with previous 3D models, and with the same spectral displays that are used with 2D spectral images. Computer graphics has developed many open-source software frameworks for processing 3D geometric models, such as [CCR08,Gra08,MK10]. These open-source projects have been successful computer graphics and have had broad impact to other fields. These efforts have been extensible to additional operations, but have stayed focused on 3D geometric processing. In this paper, we address the lack of equivalent software packages that allow art conservators to easily use digital data for art restoration. We provide an open-source imaging software tool that reduces the complexity in using digital data from high-end imaging technology. In contrast to the open source geometric frameworks, we allow multiple data types rather than just 3D models. We avoid replicating previous work by focusing on navigation and viewing of data, rather than offering processing capability. In this paper, we describe the development of this opensource software designed to give art conservators easy assess to high-end imaging. We provide this software as open source following geometric computing software projects to enable future development. Our contributions are: • Integrated visualization of various types of imaging data for art restoration in a single software package. • A publicly accessible open-source framework for extended future modifications. 2. Building on Previous Work In this section we review the data types in use by art conservators and the background for the selection of a base framework for our software. 2.1. Data Types in Art Conservation In the field of art conservation, various imaging technologies have been used for many decades [FK06]. Infrared reflectography (IRR) with narrow-bandpass filters has been
used in the study of paintings [DMWF93]. Mansfield et al. [MAM⇤ 02] and Attas et al. [ACC⇤ 03] applied multispectral imaging in order to examine drawing and oil painting. Spectral imaging can, for example, detect variations in material indicating repairs that have been made to the original works. Full volumetric scanning, in particular CT scans, are used to examine the structure of artifacts, particularly artifacts made of wood and bone [Ghy05]. For an example, CT scanning was used to obtain a full volumetric map of a Fang requilary head from Gabon to answer questions such as the internal structure, and the degree of permeation of oils in the wooden object [KPG07]. Conservators can now make simultaneous use of multiple types of digital information in understanding, documenting and conserving works of art. Billing and Pezzati et al. [RSBW07] in studying the work of Raphael demonstrated the use of IR, UV imaging and 3D profilimetry. The work of Arbarce et al. [ASC⇤ 12] shows how scanned historic photographs, 3D shape scans and color data can be brought to bear in the reconstruction of a work. Mohen et al. [MMM⇤ 06] describe a remarkable set of imaging technologies as well as other physical measurements all used in a definitive study of the state of DaVinci’s Mona Lisa. In general, projects dealing with multiple imaging modalities in art conservation have been focused around the study of a particular object, rather than focusing on a tool that can be used to study many objects. In most cases technical experts in different disciplines, as well as the different imaging modalities, were needed to acquire and interpret the data. In this project we seek to give art conservators access to different types of digital imaging data in an integrated environment. Experts might still be needed to acquire the data (as with CT scans) or to process data into a useful form (as with the conversion of range images into 3D models). However, given the processed data, our tool should allow the conservator to inspect the results in their day-to-day work, without the assistance of a technical expert. Working in collaboration with a museum conservator and a museum director of visual resources, we compiled this list of digital imaging types found useful in practice: conventional 2D (RGB) digital photography, 2D high-dynamic-range (HDR) imaging [DM97], reflectance transformation imaging (RTI) [PCC⇤ 10], 2D Xray imaging [Tsu94], 2D hyperspectral imaging (including UV and IR channels), 3D scanning with texture [BMR01], 3D imaging spectroscopy (with hyperspectral texture of ultra-violet and infra-red) [KHK⇤ 12], and 3D volumetric computed tomography [NFMD90]. Our framework is flexible enough to handle all of these, and with the exception of RTI, all have been implemented in our viewer. The structure and interface we have developed are designed to accommodate the future addition of RTI. c The Eurographics Association 2012. �
M. H. Kim, H. Rushmeier, J. ffrench, & I. Passeri / Developing Open-Source Software for Art Conservators
2.2. Previous Software Frameworks The need for inspection tools for cultural heritage professionals has been a subject for some years. Previous work on cultural heritage specific software has focused though on flexible and intuitive manipulation of single data types. An example is the Virtual Inspector [CPCS08]. This software focuses on easy setup of annotated 3D models for viewing by museum visitors, rather than on using 3D models as part of a technical examination by a conservator. Widely used open source image processing programs include ImageJ [AMR04] and Gimp [KK99]. ImageJ, developed originally and still skewed to medical imaging applications, allows the importing of multiple types of 2D images, and provides many image processing operations such as edge detection, cropping and cut-and-paste. ImageJ does not deal with 3D data, in particular with 3D mesh objects. Gimp also provides multiple image processing applications. It is more focused on artistic editing of images rather than the analysis of images provided by ImageJ. Like ImageJ, Gimp does not deal with 3D data. The scope of our work includes the visualization of 3D geometry with texture, and there are several useful opensource frameworks in the field of geometry processing. Meshlab [CCR08] is a mesh processing software framework that can handle various types of 3D mesh data and enables the use of various geometric operations. This framework also provides an independent library (the VCG library). Meshlab has proved extremely successful in cultural heritage in producing 3D models from scan data. Graphite [Gra08] is also a complete software package that can handle various types of 3D geometry data. This software package includes many implementations of various geometry processing algorithms. Graphite is designed for research in geometric processing. OpenFlipper [MK10] is a more commercial oriented opensource project. Like other software, this open-source project is designed as a geometric processing toolkit. This software is commercially available because the core engine, so-called OpenMesh, was published under LGPL license, as opposed to other frameworks which use GPL. These open-source frameworks are very well written and well maintained. They are not configured however to be expanded to viewing data types including hyperspectral images and volumetric rendering CT data. There are also numerous efforts to provide viewers for 3D volumetric scan data, typically provided in the DICOM format. A prominent example is the OsiriX [RSR04] software. OsiriX has grown to a widely used Open Source project, and to a commercial FDA version. While OsiriX imports data from multiple modalities (e.g. magnetic resonance and computer tomography). It focuses on volumetric scan data, and provides functionality specific to medical applications. We seek to integrate the viewing capabilities of these various projects for 2D and 3D images and 3D geometric objects. However, we do not seek to unify all of the processing c The Eurographics Association 2012. �
capabilities of these programs. In our system, we assume that the image or geometric processing needed for each type of data is performed in specialized software for that type. 2.3. Basic Building Blocks We are interested in building a complete software framework that can handle various types of 2/3D and volumetric data types. We carefully consider that we do not rewrite or reinvent processing software that is already used to prepare the various elements that exist in Photoshop and Meshlab. All of the frameworks cited in the previous section for image, geometry and volumetric data are themselves built on standard libraries. We follow the lead of these successful projects by building on libraries used in those projects as our basic building blocks. To build a complete software package, we include three main application programming interfaces (APIs): graphics, user interface, and linear algebra (see Fig. 1). First, our graphic visualization part has been implemented by adopting two graphics libraries, VTK (the object-oriented wrapper of OpenGL pipeline [SKL06]) and Insight Segmentation and Registration Toolkit (ITK) [TS11]. Therefore, we implement OpenGL operations via the VTK API. The reason why we chose these two libraries as graphics engine is that ITK provides basic image processing modules necessary for processing CT image data (including the DICOM file IO) and VTK supports volumetric rendering. The common medical imaging application OsiriX is also based on these two graphics libraries. By using these two graphics APIs, we save time and effort for implementing other functionality such as integrating multispectral imaging into 3D scanned data. Second, we employ the Qt API [Dal02] for user interface. We are interested in enabling easy access to the software by the users with an intuitive user interface (see Fig. 7 for screenshots of the final product). Qt API provides not only cross-platform API but also the signal-slot structure to handle user-interface objects. The Qt API has been commonly used in the previous geometric processing software [CCR08, Gra08, MK10]. However, the VTK libraries does not fully support multi-document framework of Qt API. Some engineering was required to accommodate these VTK graphics API and Qt API together (please refer to our codes, Hyper3D Software VTK graphics API
QT interface API/QWT
OpenGL Graphics Library Graphics Hardware
Operating System API
Armadillo API LAPACK
Open EXR
C++ with STL
System Hardware
Figure 1: This diagram describes how we configure and build software blocks (described in Sec. 2.3) to complete our software architecture.
M. H. Kim, H. Rushmeier, J. ffrench, & I. Passeri / Developing Open-Source Software for Art Conservators
Hyper3D via SourceForge.net [Hyp12]). Currently, our software application supports 32-/64-bit Windows and 64-bit Mac OS X. These two target operating systems were chosen by the preference of the art conservators. Finally, our software includes a linear algebra API (that wraps BLAS and LAPACK operations) for highperformance linear algebra [San10] and OpenEXR [Luc09] for handling HDR image data and multispectral channels by using the multi-layer feature (available from ver. 1.7) in the OpenEXR library. This allows us to read and visualized multispectral images and textures in a hyperspectral 3D model [KHK⇤ 12]. Fig. 1 visualizes the API architecture that we built in our software. 2.4. Basic Functions and Interfaces In addition to benefiting from the experience of previous projects by using the same libraries, we want to follow the successful user interface conventions that people have become used to in standard tools. As shown in Fig. 7, we structure our software in the multi-document framework. This allows users to open multiple image datas in different types. See Fig. 7 for the interface with multiple documents opened. Following conventions, our software has a menubar as well as toolbar. Most of the functions are accessible through either menubar or toolbar. See Fig. 3(a). The software can read the 2/3D images and CT directory because DICOM medical image data is served in a directory rather than individual files. The software also provides four different types of common rendering modes (points, wireframe, surface, and w/-w/o texture). We also include a switching option of illuminating objects with w/-w/o directional light. Our software delivers conventional information about the model loaded such as polygon number, polygon index number, surface normal of the selected polygon, world coordinates, texture file information, etc. Also the software includes zoom in/out and orthogonal view options as like other 3D geometric software. In addition, we implemented a measuring tool for 3D models (both scanned surfaces and CT volumes). It displays the length between two points that users select, represented in the image panel as a straight orange line. 3. Software – Implementation and Current Functionality As evidenced in [RSBW07], recent art conservation research has been extended to the hyperspectral 2/3D and volumetric imaging applications. Our system design insight is that the needs of art conservation are different than the needs addressed by existing geometry processing and medical imaging software. Our current software tries to fill in the gap between the geometry processing and medical imaging application in terms of software implementation and functionality. Most geometry processing applications focus on the algorithms and systems to deal with geometric operation and
just RGB texture rendering. These applications lack the capability to include hyperspectral texture visualization and functionality for volumetric data. Medical imaging applications have been interested in the volumetric rendering to understand the inner structure of the human body rather than hyper-spectral texture visualization. 3.1. System Design As described in Section 2.3, Source [Data] ITK we chose software building blocks for our new system based on the success of these Mapper VTK libraries in various geometry processing and medical Actor imaging applications. Critical elements for our software Renderer development are the ITK, VTK and Qt libraries. Fig. 2 QT summarizes our basic renWindow dering and user interaction pipeline with these libraries. Interactor VTK ITK is mainly used for taking care of various types of imFigure 2: Rendering and age compression in DICOM user interaction pipeline by using ITK/VTK/Qt API. medical data and converting the 2D image stack coordinates to world coordinates in the OpenGL environment. In the VTK pipeline, the mapper and actor modules (in Fig. 2) convert and render the input data in the OpenGL context. The window objects are rendered by the Qt API. The mouse interaction and events are controlled by both Qt and VTK. This structure is not much different from typical medical imaging applications. However, we implement hyperspectral texture visualization across the pipeline, which is missing in medical imaging applications. Following the needs for art conservation, this software includes customized widgets for various types of data. A light widget tool is provided to users to aid qualitative visual inspection of 3D geometry (see Fig. 3(b)). Conservators are familiar with visual inspection by varying the illumination
(a) Basic toolbar interface
(b) Rendering control widget
(c) CT navigator widget
Figure 3: (a) shows the basic toolbar interface for convenient access to functions. (b) widgets for controlling the intensity of key/fill virtual lights. (c) CT medical imaging data navigation options of stack and volume rendering. c The Eurographics Association 2012. �
M. H. Kim, H. Rushmeier, J. ffrench, & I. Passeri / Developing Open-Source Software for Art Conservators
direction. Many are also familiar with RTI imaging for the visual inspection of artifacts. Our current software therefore includes a light control widget for controlling the direction vector of the virtual light source over 3D objects. A subtle point is the coordinate system of the light source specification. Various objects may have different local coordinate systems based on how they were acquired. The conservator positions the objects in the system windows, and the only coordinate system that is clear to them is the camera system. We therefore locate and control the light based on the camera’s point of view. Following the control point of the track ball widget, the virtual light orbits the object in context. To do so, we obtain the orientation vector from the trackball interface, and then the light position in control is determined by applying the trackball transformation to the current viewing vector of the GL camera. A consequence of this is that the conservator can load and position multiple objects into side by side windows, as if they were on a virtual table. Adjusting the lighting control changes the light simultaneously in all windows, just as a physical light would affect all items on the same table. Our current software includes a CT data visualization widget. A CT data is a stack of 2D X-ray images forming a 3D cube of rasterized images. Our current software provides two different types of visualization. One is to navigate the image stack in three different orientations with or without interpolation. The other is to render it as a volume in order to help users to understand the 3D structure inside objects (see Fig. 6(b)(1) and 7 for examples). We visualize the CT data with volumetric rendering with ray casting techniques enabled using the VTK libraries [SKL06]. Users are offered options for CPU or GPU rendering, reduced resolution, and blend type (e.g. maximum intensity projection (MIP), isosurface, etc.). See Fig. 3(c) for the CT widget.
3.2. Hyperspectral Imaging Software Major functionalities for art conservation software that not addressed in the existing software libraries are color conversion and visualization techniques to deal with hyperspectral/multispectral data. Hyperspectral imaging allows conservators to inspect high dimensional spectra qualitatively and quantitatively. Such visual inspection of high dimensional data is powerful and successful for museum and gallery professionals. However, the problem in hyperspectral imaging data is that spectral data is very dense and beyond human visual capabilities. A naive approach to inspect such data is to visualize the data in each individual spectral band as a gray-scale image. This allows radiometric inspection, but it does not present true color information needed by the conservator to relate the data to their direct visual impression of the artifact. We therefore include two different types of visualization of hyperspectral 2/3D data. We first convert the highdimensional spectral information to the visible range by projecting the original data to the trichromatic human vision. However, the spectral range of the human vision is a subset of the electro-magnetic radiation which is sensible to recent hyperspectral imagers [FK06]. Therefore we provide another widget for visualizing hyperspectral spectrum information simultaneously with color visualization. The user can probe the color representation of a hyperspectral image or textured object, and see the detailed spectral measurement on a point-by-point basis. Our current software reads hyperspectral information in multi-layers in the OpenEXR data type. The spectral data in a 2D image or 3D texture map is read by using the OpenEXR API. The spectral channels s first are projected to the tristimulus values by CIE 2-degree color matching functions MXYZ [CIE86]. The tristimulus values in XYZ are then transformed by MsRGB into sRGB color primary values c by [NS98], where the rendered image is white-balanced by gray-world algorithm [Buc80]: c = MsRGB · MXYZ · s.
(1)
The linear sRGB color c is then rendered via gamma correction [Poy08] to display signal depths. We then compute the histogram of the converted image and stretch the pixel levels between 1% and 99% to the range of display signals by effectively clamping values.
Figure 4: The left image shows an example of color visualization of a hyperspectral image. The right spectral plot is a screen shot of our spectral plot widget on the blue patch. The background of the plot widget is color indexed. The left black region indicates invisible ultraviolet spectral wavelength (under 380nm). The right black region shows invisible infrared spectral reading. The colors in the middle correspond to their spectra. Data courtesy of [KHK⇤ 12]. c The Eurographics Association 2012. �
When the software loads the hyperspectral 3D data, the data is also provided to the plot widget (see Fig. 4). For a 3D object, the screen coordinates of the mouse pointer are converted to the world coordinates. After the uv coordinates in the texture map are determined from the world coordinates on the 3D object, the software visualizes the corresponding spectral information on the plot widget. This allows users to inspect not only the color at the point of interest but also corresponding spectrum quantitatively.
M. H. Kim, H. Rushmeier, J. ffrench, & I. Passeri / Developing Open-Source Software for Art Conservators
(a)
(b)
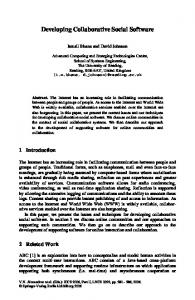
Figure 5: Polychrome stucco relief, Virgin and Child, Italy 15C, by Vittorio Ghiberti. (a) A screenshot of detailing the plaster crack in various dimensions in our software. (b) Reflectance spectra of pigments on the left hyperspectral images are illustrated on the spectral plot widget. The two plots on the plot widget are screen captures from two different points of interest (green and yellow squires).
(2) 2D X-ray imaging
(a)
(b)
(1) CT volume rendering
(4) RGB color imaging
(3) UV fluorescent imaging
(5) IR imaging
Figure 6: Tempera on panel with gilding, The Coronation of the Virgin, Italy ca. 1325, by Jacopo del Casentino. (a) An archival photograph of the panel painting, taken in the 1930s. (b) shows a screenshot of current software. It visualizes various types of imaging data together, allowing users to compare hyperspectral 2D imaging and 3D CT volume rendering data simultaneously. Image (b) shows (1) CT volume rendering with geometric inspection (measuring the size of a pin inside the wooden panel), (2) 2D X-ray imaging, (3) UV fluorescent imaging, (4) high-resolution RGB color imaging, and (5) IR imaging.
4. Applications 4.1. Existing Functionality The first object studied is a sculptural polychrome stucco relief entitled Virgin and Child which was created in the 15th century by Italian artist Vittorio Ghiberti. The dimensions of the object are 89cm (height) and 61cm (width), made of stucco plaster. It is believed that several copies of the sculpture were made from an original mold and now are in collections in the US and Europe. The structural support of the Virgin and Child is in a weakened state due to its age and the nature of the medium. The painted pigment surface layer has deteriorated over the years due to wear and age as well; in addition over the years the object has undergone several treatments of restoration or alteration which have altered the
original appearance of the relief. In these given conditions, a museum conservator, starting with various types of nondestructive visual inspection techniques, has undertaken a new conservation treatment. The imaging data types available for this object were hyperspectral imaging data of ultraviolet/visible/infrared spectra and 3D scanning data as well as more traditional digital image file types. 3D scanning was performed in order to help examine the dimensions and patterns of cracks on the plaster surface for future comparison to know copies. See Fig. 5(a) for a screenshot of using the geometry inspection tool. Hyperspectral imaging was conducted for non-destructive investigation of pigment deterioration over the 3D polychrome surface. Fig. 5(b) shows the spectral comparison of two different areas in our software. c The Eurographics Association 2012. �
M. H. Kim, H. Rushmeier, J. ffrench, & I. Passeri / Developing Open-Source Software for Art Conservators
Figure 7: Screenshot of the software with the two different example objects. Four different types of image data are loaded: (from the top left) a 3D scan model, CT 2D stack visualization, the color visualization of a multispectral image with eight spectral channels (the spectral plot widget on the right bottom illustrates the spectral reading of the red region), and volume rendering of the polychrome panel. The right-hand-side column shows the light controls for the 3D model/volume rendering visualization (key/fill light), CT stack data navigator and volume rendering options. At the bottom of the column, multispectral spectrum is scientifically visualized on the surface point followed by the mouse pointer.
A second object studied is entitled The Coronation of the Virgin; a panel painting gilt and painted with egg tempera, by Jacopo del Casentino, ca. 1325. The dimensions of this panel are 31cm (height), 24cm (width) and 2.5cm (thickness). The panel support is of poplar and contains sculptured gesso sections that are gilded and painted with tempera. Like the relief, this panel painting has been restored many times over the years. As shown in Fig. 6(a), the decorations on the top section of the panel and the crack at the top-middle part were restored in the 1930a. These decorations are visually different from the current panel state which underwent a restoration campaign in the 1970s. In preparation for new treatment, a museum conservator has performed various types of digital imaging analysis such as 2D X-ray imaging, UV fluorescent imaging, infrared imaging, CT scanning as well as more traditional digital imaging file types. The initial primary focus of work has been in trying to better understand the support layers and construction of the panel. In particular there are two circular voids in the upper corners of the panel whose original intention are lost, this coupled with interest in the nails which were used to construct the panel led to a desire for an inspection tool to be built so that they can pin-point the location such items and study them further. The museum staff has found that the various modes of volume rendering and isosurface rendering are beneficial in the study of a work of art. The conservator is interested in geometric inspection with CT scan data along with various highc The Eurographics Association 2012. �
end imaging data to better understand the support layers of the panel and carved relief as well as comparing those data results with reflective surface data. With this software interface, staff can better compare the different types of imaging results from the same image coordinates by placing images side-by-side allowing them to better compare data in one interface. The program also helps with hyperspectral visual inspection. 4.2. User Experience and Feedback In the initial application of the demonstrated art objects, we received useful feedback on the current system from the art conservator and museum staff. First, the current software is able to only read and visualize the imaging data presented, there is no support for the addition of data to the system or file itself. The conservator needs the ability to save views of data of interesting viewpoints (like a bookmark) and to save notes such as the geometric measurement of the cracks. Currently this is only possible through ad hoc screenshots. In addition, staff suggested a functionality to save annotations across different types of imaging data so that they can quickly reference areas in multiple file types, or share them with other staff viewing the files. Future system development will work to include this feedback and suggestions will be considered as future features of the program. Staff are excited to have an interface which allows them to view a multitude of file types, but of course the want is always for more.
M. H. Kim, H. Rushmeier, J. ffrench, & I. Passeri / Developing Open-Source Software for Art Conservators
Building in the ability to read more file types, such as RTI data sets is another feature request voiced, as well as the ability to print out files for sharing and archiving of treatments. 5. Conclusions We provide an open-source software tool with intuitive user interface that can handle various types of 2/3D imaging data consistent with the needs of art conservator such as hyperspectral imaging data and CT scans. This software code, Hyper3D is publicly available via SourceForge (http://sourceforge.net/projects/hyper3d/) [Hyp12]. We would like to invite to others to get involved for further development for various applications.
[Ghy05] G HYSELS M.: Ct scans in art work appraisal. Online journal asianart.com, 2005. 2 [Gra08] G RAPHITE: http://alice.loria.fr/index.php/software.html. http://alice.loria.fr/index.php/software.html, 2008. 2, 3 [Hyp12] H YPER 3D: An open-source project in SourceForge.net. http://sourceforge.net/projects/hyper3d/, 2012. 4, 8 [KHK⇤ 12] K IM M. H., H ARVEY T. A., K ITTLE D. S., RUSH MEIER H., D ORSEY J., P RUM R. O., B RADY D. J.: 3d imaging spectroscopy for measuring hyperspectral patterns on solid objects. ACM Transactions on Graphics (Proc. SIGGRAPH 2012) 31, 4 (2012), 38:1–11. 2, 4, 5 [KK99] K YLANDER K., K YLANDER O.: Gimp. Coriolis Group, 1999. 3
Acknowledgements
[KPG07] K AEHR R., P ERROIS L., G HYSELS M.: A masterwork that sheds tearsÉ and light: A complementary study of a fang ancestral head. African Arts 40, 4 (2007), 44–57. 2
This project was funded by a Seaver Institute grant.
D IGITAL LTD .: [Luc09] L UCAS http://www.openexr.com/, 2009. 4
References [ACC⇤ 03] ATTAS M., C LOUTIS E., C OLLINS C., G OLTZ D., M AJZELS C., M ANSFIELD J. R., M ANTSCH H. H.: Nearinfrared spectroscopic imaging in art conservation: investigation of drawing constituents. Journal of Cultural Heritage 4, 2 (2003), 127 – 136. 2
OpenEXR.
[MAM⇤ 02] M ANSFIELD J. R., ATTAS M., M AJZELS C., C LOUTIS E., C OLLINS C., M ANTSCH H. H.: Near infrared spectroscopic reflectance imaging: a new tool in art conservation. Vibrational Spectroscopy 28, 1 (2002), 59 – 66. 2 [MK10] M ÖBIUS J., KOBBELT L.: Openflipper: An open source geometry processing and rendering framework. In Curves and Surfaces (2010), vol. 6920 of Lecture Notes in Computer Science, Springer, pp. 488–500. 2, 3
[AMR04] A BRÀMOFF M., M AGALHÃES P., R AM S.: Image processing with imagej. Biophotonics international 11, 7 (2004), 36–42. 3
[MMM⇤ 06] M OHEN J., M ENU M., M OTTIN B., NASH L., E D WARDS G.: Mona Lisa: inside the painting. Abrams, 2006. 2
[ASC⇤ 12] A RBACE L., S ONNINO E., C ALLIERI M., D ELLEPI ANE M., FABBRI M., I ACCARINO I DELSON A., S COPIGNO R.: Innovative uses of 3D digital technologies to assist the restoration of a fragmented terracotta statue. J. Cultural Heritage (2012). 2
[NFMD90] N EY D. R., F ISHMAN E. K., M AGID D., D REBIN R. A.: Volumetric rendering of computed tomography data: Principles and techniques. IEEE Computer Graphics and Applications 10, 2 (Mar. 1990), 24–32. 2
[BMR01] B ERNARDINI F., M ARTIN I. M., RUSHMEIER H. E.: High-quality texture reconstruction from multiple scans. IEEE Trans. Vis. Comput. Graph 7, 4 (2001), 318–332. 2
[NS98] N IELSEN M., S TOKES M.: The creation of the sRGB ICC Profile. In Proc. Color Imaging Conf. (1998), IS&T, pp. 253–257. 5
[Buc80] B UCHSBAUM G.: A Spatial Processor Model for Object Colour Perception. J. the Franklin Institute 310, 1 (1980), 1–26. 5
[PCC⇤ 10] PALMA G., C ORSINI M., C IGNONI P., S COPIGNO R., M UDGE M.: Dynamic shading enhancement for reflectance transformation imaging. JOCCH 3, 2 (2010), 6. 2
[CCR08] C IGNONI P., C ORSINI M., R ANZUGLIA G.: Meshlab: an open-source 3D mesh processing system. ERCIM News 2008, 73 (2008). 2, 3
[Poy08] P OYNTON C.: Frequently asked questions about gamma. http://www.poynton.com/PDFs/TIDV/Gamma.pdf, 2008. 5
[CIE86] CIE: Colorimetry. CIE Pub. 15.2, Commission Internationale de l’Eclairage (CIE), Vienna, 1986. 5 [CPCS08] C ALLIERI M., P ONCHIO F., C IGNONI P., S COPIGNO R.: Virtual inspector: a flexible visualizer for dense 3d scanned models. Computer Graphics and Applications, IEEE 28, 1 (2008), 44–54. 3
[RSBW07] ROY A., S PRING M., B ERRIE B., WALMSLEY E.: Raphael’s painting technique: working practices before Rome: proceedings of the Eu-ARTECH workshop. Nardini, 2007. 2, 4 [RSR04] ROSSET A., S PADOLA L., R ATIB O.: Osirix: an opensource software for navigating in multidimensional dicom images. Journal of Digital Imaging 17, 3 (2004), 205–216. 3
[Dal02] DALHEIMER M. K.: Programming with Qt: Writing Portable GUI applications on Unix and Win32, second ed. O’Reilly & Associates, Inc., pub-ORA:adr, 2002. 3
[San10] S ANDERSON C.: Armadillo: An Open Source C++ Linear Algebra Library for Fast Prototyping and Computationally Intensive Experiments. Tech. rep., NICTA, Australia, October 2010. 4
[DM97] D EBEVEC P. E., M ALIK J.: Recovering high dynamic range radiance maps from photographs. In Proc. the ACM SIGGRAPH Conference (1997), pp. 369–378. 2
[SKL06] S CHROEDER W. J., K ENNETH M., L ORENSEN W. E.: The Visualization Toolkit, 4th ed. Prentice Hall, 2006. 3, 5
[DMWF93] D ELANEY J., M ETZGER C., WALMSLEY E., F LETCHER C.: "examination of the visibility of underdrawing lines as a function of wavelength". In Proceedings of the 10th Triennal ICOM–CC Meeting (1993), vol. 1, pp. 15–19. 2 [FK06] F ISCHER C., K AKOULLI I.: Multispectral and hyperspectral imaging technologies in conservation: current research and potential applications. Reviews in conservation (2006). 2, 5
[TS11] TAKA S. J., S RINIVASAN S.: NIRViz: 3D visualization software for multimodality optical imaging using visualization toolkit (VTK) and insight segmentation toolkit (ITK). J. Digital Imaging 24, 6 (2011), 1103–1111. 3 [Tsu94] T SUI B. M. W.: Single-photon emission computed tomography (spect) imaging. In ICIP (3) (1994), pp. 1031–1035. 2
c The Eurographics Association 2012. �


![Using MicroServices and OpenSource Software to ... - Archivematica [PDF]](https://m.moam.info/img/260x300/using-microservices-and-opensource-software-to-arc_6479d2ed098a9ebf758b45dd.jpg)