APPLIED AND ENVIRONMENTAL MICROBIOLOGY, Dec. 2011, p. 8487–8493 0099-2240/11/$12.00 doi:10.1128/AEM.05549-11 Copyright © 2011, American Society for Microbiology. All Rights Reserved.
Vol. 77, No. 24
Development and Application of an Enzymatic and Cell Flotation Treatment for the Recovery of Viable Microbial Cells from Environmental Matrices Such as Anaerobic Sludge䌤 Florence Braun, Je´ro ˆme Hamelin, Gae¨lle Ge´vaudan, and Dominique Patureau* INRA, UR50, Laboratoire de Biotechnologie de l’Environnement, Avenue des Etangs, F-11100 Narbonne, France Received 20 May 2011/Accepted 10 October 2011
Efficient dissociation of microorganisms from their aggregate matrix is required to study the microorganisms without interaction with their native environment (e.g., biofilms, flocs, granules, etc.) and to assess their community composition through the application of molecular or microscopy techniques. To this end, we combined enzymatic treatments and a cell extraction by density gradient to efficiently recover anaerobic microorganisms from urban wastewater treatment plant sludge. The enzymes employed (amylase, cellulase, DNase, and pectinase) as a pretreatment softly disintegrated the extrapolymeric substances (EPS) interlocked with the microorganisms. The potential damaging effects of the applied procedure on bacterial and archaeal communities were assessed by studying the variations in density (using quantitative PCR), diversity (using capillary electrophoresis single-strand conformation polymorphism fingerprinting [CE-SSCP]), and activity (using a standard anaerobic activity test) of the extracted microorganisms. The protocol preserved the general capacity of the microbial community to produce methane under anaerobic conditions and its diversity; particularly the archaeal community was not affected in terms of either density or structure. This cell extraction procedure from the matrix materials offers interesting perspectives for metabolic, microscopic, and molecular assays of microbial communities present in complex matrices constituted by bioaggregates or biofilms. coming from the raw wastewater that are adsorbed on microbial cells. EPS are polysaccharides, proteins, lipids, DNAs, and humic substances. Under methanogenic conditions, a huge diversity of microorganisms, including Bacteria and Archaea (10), are working in syntrophy to degrade organic matter into methane and carbon dioxide. The bacterial community is responsible for the initial hydrolysis of the organic matter into mainly volatile fatty acids. Then, these molecules are transformed into methane and carbon dioxide by the archaeal community (4). Several studies have dealt with the enzymatic hydrolysis of sludge to characterize the EPS without checking cell viability (10, 33). Cocktails of protease, lipase, cellulase, ␣-amylase, dextrase, endoxylanase, and polygalacturonase were tested (10, 33). None of these studies focused the recovery of viable cells. However, such cocktails, in particular those containing protease and lipase, may damage the cells and may impact the viability of microorganisms by disrupting the membrane, which is mainly constituted of proteins and lipids. Another enzymatic cocktail was thus tested in this study. This study presents a new protocol, coupling (i) a soft disintegrating of the sludge by enzymatic pretreatments and (ii) a recovery of microorganisms by cell flotation, which aimed at inoculating viable and active cells in anaerobic digesters. The conservation of the structure and the diversity of bacterial and archaeal communities as well as their functional capabilities were then checked carefully.
The quantification of bacterial abundance and the study of bacterial physiology are essential to understand the role of microorganisms in wastewater treatments. Anaerobic sludge is an aggregation of several heterogeneous compounds (24), like extracellular polymeric substances, extracellular DNA, and dead microorganisms, that can induce misinterpretation of results from PCR or fluorescence-based techniques. The separation of the microorganisms from their original matrices may reduce this problem of interference. Techniques based on the density gradient centrifugation to remove microorganisms from their ecosystem were first optimized on soil samples (3, 7, 9, 17, 20) and were thereafter extended to other matrices, like sediments (2). Such protocols rely on a significant difference in density between microbial cells and their surrounding environment (e.g., mineral particles of the soil). These techniques combine actions of mechanical dispersal and chelating agents like polyvinylpolypyrrolidone (PVPP) (14), Na2EDTA (5), and Tween 20 (5) to separate soil bacteria from the matrix. Once in suspension, the microorganisms are then separated from some organic and mineral matter by a Nycodenz density gradient (7). In aerobic and anaerobic sludges, microorganisms are organized in flocs or granules and are embedded with extrapolymeric substances (EPS), which constitute the majority of the organic matter (15, 24). EPS may have a biological origin, such as bacterial secretions or bacterial lysis, or they are molecules
* Corresponding author. Mailing address: INRA, UR50, Laboratoire de Biotechnologie de l’Environnement, Avenue des Etangs, F-11100 Narbonne, France. Phone: 33 4 68 42 51 69. Fax: 33 4 68 42 51 60. E-mail:
[email protected]. 䌤 Published ahead of print on 14 October 2011.
MATERIALS AND METHODS Sludge source. All experiments were performed using an anaerobic sludge from an urban wastewater treatment plant. The sludge was stored at room
8487
8488
APPL. ENVIRON. MICROBIOL.
BRAUN ET AL.
Initial step Matrixwith Matrix withbioaggregates bioaggregates (Anaerobic sludge) (Anaerobic sludge)
Centrifugation:15000 Centrifugation: 15000××g,g,20min, 20min, 4°C 4°C resuspended pellet resuspended pelletinin mM+ STPP STPP 5050 mM mM phosphate buffer phosphate buffer80 80mM mM++MgCl MgCl2 20 mM+ Amylase digestion Amylase digestion
α-amylase, 60 α-amylase, 60min, min,37°C, 37°C, pH5 pH5
Pectinase digestion Pectinase digestion
Pectinase, 6060min, Pectinase, min, 37°C 37°C , pH5 , pH5
Cellulase digestion Cellulase digestion
Cellulase, 6060min, Cellulase, min, 37°C, 37°C, pH7pH7
DNase digestion DNase digestion Cellflotation Cell flotation (Gento step) (Gento step)
DNase, 60 DNase, 60min, min,37°C, 37°C, pH7 pH7 Centrifugation 15,000 Centrifugation 15,000××g,g,20min, 20min, 4°C 4°C resuspendedpellet resuspended pelletininphysiological physiological water water Centrifugation 15,000 Centrifugation 15,000××g,g,20min, 20min, 4°C 4°C 10 gg washed washedpellet pelletininPBS1X PBS1X buffer buffer + PVPP + PVPP + + EDTA+ tween tween20, 20, over over nigth nigth incubation, incubation, 37°C 37°C Na2EDTA+ Na Gentodenz gradient Gentodenz gradient Centrifugation 10,000 Centrifugation 10,000××g,g,40min, 40min, 4°C 4°C
Cell suspension Cell suspension
Studyofofthe Study theconservation conservation and and representativeness representativeness of microbial of microbial community : bacterial community: bacterialand andarchaeal archaeal density density (qPCR), (qPCR), diversity diversity (CE-SSCP (CE-SSCP fingerprint), activity fingerprint), activity /viability /viability(standard (standardactivity activitytest test inin anaerobic anaerobic conditions) conditions)
FIG. 1. Extraction methodology based on three main steps: initial step, enzyme pretreatment step, and final step. The initial step corresponds to a resuspension of the sludge organic matter in buffer, the pretreatment step to successive application of 4 enzymes (amylase, pectinase, cellulose, and DNase), and the final step to cell flotation with density gradient extraction. The density and diversity of microbial communities were also studied in each protocol step.
temperature to preserve the activity of microorganisms. The anaerobic sludge contained 41.6 ⫾ 0.5 g 䡠 liter⫺1 of dry matter. Enzymatic treatments. Two hundred fifty milliliters of anaerobic sludge (corresponding to about 10 g of dry matter) was centrifuged at 15,000 ⫻ g for 20 min at 4°C. The resulting pellet was resuspended in 250 ml of 80 mM phosphate buffer with MgCl2 at a final concentration of 20 mM. To optimize the hydrolysis of sludge EPS, sodium triphosphate pentabasic (STPP; Sigma) was added to the buffer at a final concentration of 50 mM (10, 33). The STPP interacted with humic compounds to reduce the enzyme adsorption in sludge. Previous studies showed that 50 mM STPP increased the activity of enzymes such as ␣-amylase (34). Figure 1 summarizes the succession of enzymatic steps. The quantity of enzymes was based on an estimation of the sludge composition with respect to polysaccharides, complex carbohydrates, cellulose, and DNA (30). Each enzyme was added in large excess to prevent inhibition of enzyme activity by sorption. Twenty units of ␣-amylase (from Bacillus sp.; Duramyl; 300 U 䡠 g⫺1; Sigma), 330 U of pectinase (from Aspergillus niger; 1,000 U 䡠 g⫺1; Sigma), 5,600 U of cellulase (from Aspergillus sp.; Carezyme; 1,000 U 䡠 g⫺1; Sigma), and 250 U of DNase (RQ1 RNase-free DNase; Promega) were added successively, and the suspension was incubated 60 min at 37°C. To optimize enzyme activity, the buffer was first adjusted to pH 5 for the ␣-amylase and pectinase additions, and then adjusted to pH 7 for the cellulase and DNase additions. The cell suspension was finally centrifuged at 15,000 ⫻ g for 20 min at 4°C, and the resultant pellet was resuspended in 250 ml of physiological water. Cell flotation with Gentodenz gradient. After the enzymatic treatments, a method based on the Nycodenz gradient, routinely used to extract cells from soil, was employed. The suspension was centrifuged at 15,000 ⫻ g for 20 min at 4°C, and the whole pellet was resuspended in 50 ml of PVPP buffer (130 mM NaCl, 7 mM Na2HPO4, 3 mM NaH2PO4, 5 mM Na2EDTA, pH 7.3; PVPP [3.5 mg 䡠 ml⫺1]; and 1% Tween 20) (5). The Tween 20 and Na2EDTA in this buffer
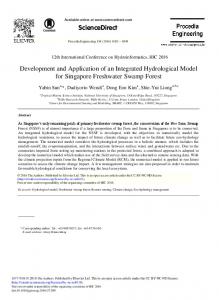
FIG. 2. Density gradient centrifugation tube with the layer of cells extracted from the enzymatically pretreated sludge.
allowed particle dispersion. Like STPP, PVPP reduces interactions of cell material with phenolic groups of humic acids via hydrogen binding (8). The suspension was mixed on ice in a blender (T15 basic; Ultra Turrax) at maximum speed for 90 s and agitated at 37°C overnight (20). To separate the cells from other sludge compounds, a high-speed centrifugation procedure with a density gradient was used (3). The gradient was elaborated with Gentodenz (Gentaur; France). Gentodenz is similar to Nycodenz, as it is a water-soluble, nonionic, and nontoxic derivate of benzoic acid and has the same density. A Gentodenz solution with a density of 1.3 g 䡠 ml⫺1 was obtained by dissolving 40 g of Gentodenz in 50 ml of sterile water, as recommended by Lindahl et al. (19). The cell suspension in the buffer was divided into two 20-ml subsamples. Sixteen milliliters of Gentodenz solution was carefully added below the 20 ml of cell suspension in a centrifuge tube. The cell suspension and the Gentodenz solution formed two distinct phases, with the latter on the bottom. The tubes were then centrifuged at 10,000 ⫻ g for 40 min at 4°C. At the end of the centrifugation, four distint phases were observed (Fig. 2). At the bottom, a pellet with the sludge particles was consistently observed. In the middle of the centrifuge tube, a large layer of cells floating over the dense Gentodenz solution and below the water-based buffer was observed. The layer of cells was recovered with a pipette as described previously (18). The total volume of the cell layer was then divided into six 10-ml subsamples. Cells were washed twice by adding 20 ml of sterile water with 0.8% NaCl to remove residual Gentodenz, followed by centrifugation at 16,000 ⫻ g for 60 min at 4°C. Cells accumulated at the bottom of the centrifuge tubes. At the end, the cell pellet corresponding to 250 ml of initial sludge was resuspended in 20 ml of sterile saline water. Extraction of DNA. An aliquot of 1 ml of sludge at each protocol step (Fig. 1) was first centrifuged for 10 min, and then the pellet was resuspended by vortexing in 115 l of 10% (wt/vol) N-lauroyl-sarcosine (N-LS) and 385 l of 4 M guanidine thiocyanate–0.1 M Tris-HCl (pH 7.5). The homogeneous sample (500 l) was stored at ⫺20°C prior to DNA extraction. Extraction and purification of total DNA were carried out using the procedure described by Godon et al. (11). PCR amplifications. To analyze the structure of the bacterial and archaeal communities, the V3 region of the 16S rRNA gene was amplified. The primers W49F and W104R were used for Bacteria (29), and W274R and W275F were used for Archaea (Table 1). PCR amplifications were carried out using Mastercycler thermocycler (Eppendorf, Hamburg, Germany). The PCR mixture used for the amplification of bacterial sequences contained 5 l of 10⫻ Pfu Turbo buffer, 0.2 mM deoxynucleoside triphosphates (dNTPs), 8 nM each primer, 1.25 U of Pfu Turbo DNA polymerase (Stratagene, La Jolla, CA), 1 l of genomic DNA, and water added to obtain a final volume of 50 l. The PCR conditions were an initial denaturing step of 2 min at 94°C; 25 cycles of a three-stage program of 30 s at 94°C, 30 s at 61°C, and 30 s at 72°C; and a final elongation for 10 min at 72°C. PCR mixtures used for the amplification of archaeal sequences contained 2.5 l of 10⫻ Pfu Turbo buffer, 0.2 mM dNTPs, 10 nM each primer, 0.625 U of Pfu Turbo DNA polymerase (Stratagene, La Jolla, CA), 0.5 l of genomic DNA, and water added to obtain a final volume of 25 l. The PCR conditions were an initial denaturing step of 2 min at 94°C; 30 cycles of a three-stage program of 30 s at 94°C, 30 s at 65°C, and 30 s at 72°C; and a final elongation for 10 min at 72°C. All reactions were stopped by cooling the mixture to 4°C. CE-SSCP. The resulting PCR products were then separated by capillary electrophoresis single-strand conformation polymorphism (CE-SSCP). A CE-SSCP
VOL. 77, 2011
RECOVERY OF VIABLE MICROBIAL CELLS FROM SLUDGE
8489
TABLE 1. Primers used during CE-SSCP PCR and qPCR Primer
PCR/qPCR
Sequence (5⬘–3⬘)
W49F W104R W274F W275R BAC338F BAC805R BAC16F ARC787F ARC1059R ARC915F
PCR PCR PCR PCR qPCR qPCR qPCR qPCR qPCR qPCR
AGG TCC AGA CTC CTA CGG G TTA CCG CGG CTG CTG GCA C CCC TAC GGG GCG CAG CAG TTA CCG CGG CGG CTG ACTCC TACGG GAGGC AG GACTA CCAGG GTATC TAATC C TGCCA GCAGC CGCGG TAATA C ATTAG ATACC CSBGT AGTCC GCCAT GCACC WCCTC T AGGAA TTGGC GGGGG AGCAC
a
Dyea
Targeted group
Reference
Bacteria Universal Archaea Archaea Bacteria Bacteria Bacteria Archaea Archaea Archaea
36 36 This study This study 35 35 35 35 35 35
3⬘-6-FAM 3⬘-6-FAM 5⬘-Yakima yellow 3⬘-TAMRA 5⬘-6-FAM 3⬘-TAMRA
FAM, 6-carboxyfluorescein; TAMRA, 6-carboxytetramethylrhodamine.
analysis permits the separation of DNA fragments of the same size but with different compositions (28). Briefly, 1 l of diluted PCR product was added to 18 l of formamide and 1 l of internal size standard ROX 400 HD (Applied Biosystems, CA) diluted 10-fold. Each sample was then denatured for 5 min at 94°C and placed directly on ice for 5 min. CE-SSCP was performed using an ABI 3130 genetic analyzer (Applied Biosystems) equipped with four 50-cm capillary tubes filled with 5.6% conformation analysis polymer (Applied Biosystems) in the corresponding buffer and 10% glycerol. The injection of DNA in capillaries required 5 kV for 3 s. Electrophoresis was carried out at 15 kV and 32°C for about 30 min per sample. Quantitative PCR (qPCR). PCRs were prepared using 96-well real-time PCR plates (Eppendorf, Hamburg, Germany) and Mastercycler ep gradient S (Eppendorf, Hamburg, Germany). Then, 12.5 l of Express qPCR Supermix with premixed ROX (Invitrogen, France), 5 l of DNA extract with three appropriate dilutions, 10 nM forward and reverse primers, 8 nM TaqMan probe, and water were added to obtain a final volume of 25 l for all analyses (Table 1). An initial incubation of 20 s at 95°C and 40 cycles of denaturation (95°C, 15 s; 60°C, 1 min) were performed. One standard curve was generated from each assay by using 10-fold dilutions in sterilized water (Aguettant Laboratory, Lyon, France) of the PCR products from known environmental clones (31). Clones DF10 and LC103 were used as standards for Archaea and Bacteria, respectively. The initial DNA concentrations were quantified using the Infinite 200 PRO NanoQuant (Tecan, France). Two measurements were obtained per sample for each primer set. The ratio of Archaea to Bacteria was estimated by calculating the average numbers of archaeal and bacterial cells. The average numbers of archaeal and bacterial cells were estimated by dividing the average number of 16S rRNA gene copies per cell by factors of 1.76 and 4.1, respectively, following the work of Klappenbach et al. (16) and the rrnBD (http://ribosome.mmg.msu.edu/rrndb/). Microbial activity measurement. In anaerobic conditions, microorganisms transform simple substrates such as glucose and acetate, into biogas (a mixture of CO2, H2, and CH4). To check the viability of the recovered cells, standard batch incubations (12, 25) under anaerobic mesophilic conditions (35°C) were performed in 50-ml glass bottles. Portions (3.6 ml) of the final cell suspension were inoculated in 40 ml of phosphate buffer (8.74 mM Na2HPO4 䡠 12H2O, 61.37 mM KH2PO4) at pH 7. Two substrates were tested: glucose (1 g chemical oxygen demand [gCOD] 䡠 liter⫺1) and a mixture of glucose and acetate with 0.5 gCOD 䡠 liter⫺1 of each compound. Each bottle was flushed with nitrogen for 5 min, ensuring anaerobic conditions. The bottles were then capped with a rubber stopper and incubated at 35°C for 26 days. Each experiment was carried out in triplicate. Chemical analysis. Biogas production was measured using differences in pressure. Biogas composition (CH4, CO2, H2, and N2) was analyzed by gas chromatography (GC-14A; Shimadzu) (1). The biogas production performances were evaluated by calculating the total accumulated biogas produced per initial substrate COD (ml 䡠 gCOD⫺1). Statistical analyses. All statistical analyses were carried out using R 2.10.1 (27). In order to investigate whether bacterial and archaeal communities differed in the course of the protocol, the bacterial and archaeal quantity, the Archaea/ Bacteria ratio, and the structure of communities were studied. Differences in bacterial and archaeal quantity among protocol steps were determined with an analysis of variance (ANOVA) and a Student-NewmanKeuls (SNK) test. The ANOVA test was used to determine if there were significant differences between groups. The SNK test was used to determine which
groups were significantly different. The same statistical tests were applied to study the differences in the Archaea/Bacteria ratios after each treatment. To study the variation of structure of both communities in the course of the protocol, the samples were gathered in three groups large enough to allow statistical testing. Groups 1, 2, and 3 were made up of samples of the initial step, samples of the different enzyme steps, and samples of the Gentodenz step, respectively. The CE-SSCP profiles were aligned with the internal standard, ROX, to correct any change in the electrophoretic motility between runs. The sums of the peak areas were normalized to unit before statistical analysis. The peak areas were determined using a rolling-ball algorithm. The Simpson diversity index (D) was computed for each fingerprinting profile by using the formula D ⫽ ⫺ln ⌺(peak areas)2, using the implementation of the R StatFingerprints library (21). The differences of diversity between the profiles were estimated with ANOVA or SNK tests. The matrices of similarity were calculated on the basis of Euclidean distances between each pair of CE-SSCP profiles. An analysis of similarity (ANOSIM) was used to investigate the effects of the protocol steps, considered as a qualitative variable, on the variation of similarity data (6). Comparisons of mean distances were used to calculate the ANOSIM R-statistic (R) with Monte Carlo permutations. The group tested was considered to be significantly different when P was ⬍0.05 and R was ⬎0.25. The value of R indicates the degree of similarity between the groups (R ⬎ 0.75, well-separated groups; 0.50 ⬍ R ⬍ 0.75, separated but overlapping groups; 0.25 ⬍ R ⬍ 0.50, separated but strongly overlapping groups). The communities of tested groups were considered to be not significantly different from each other or from other groups if P was ⬎0.05, regardless of the value of R (26).
RESULTS To separate the microbial cells of the sludge, the protocol of cell flotation with Gentodenz was initially used without pretreatment, as for a soil sample. It resulted in the formation of a viscous phase between Gentodenz and supernatant constituting of a mixture of cells and EPS impossible to collect (data not shown). To separate cells from EPS before the cell flotation, the sludge was pretreated with a cocktail of enzymes and chelating agents (Fig. 1). The main chelating agents were STPP and PVPP because they reduce the interaction of cell materials with humic compounds. The successively employed enzymes were an ␣-amylase, a pectinase, a cellulase mix, and a DNase. These enzymes dissolve polysaccharides, complex carbohydrates, cellulose, and DNA, respectively, which are part of the EPS of the sludge. Proteases and lipases were avoided in order to avoid damaging the cell membrane of microorganisms and to preserve their viability. The combination of the enzymechelating agent pretreatment and the cell flotation allowed the recovery of a clear band containing the cells separated from EPS (Fig. 2).
8490
APPL. ENVIRON. MICROBIOL.
BRAUN ET AL.
b
number of 16S gene copies.g organic matter -1
1,E+13 1,E+12
a
a
a
a
a
1,E+11
c
1,E+10
c
c
c
c
c
DNase
Gento
1,E+09 1,E+08 1,E+07 1,E+06 1,E+05 α-amylase
Initial
Pectinase
Cellulase
FIG. 3. Enumeration of Bacteria (in gray) and Archaea (in white) by qPCR using primer sets BAC338F/BAC805R (for Bacteria) and ARC787F/ARC1059R (for Archaea). The x axis represents the protocol steps performed prior to enumeration. Standard deviations are displayed. Statistical differences between groups are indicated by different letters above the bars.
Effect of the extraction protocol on the abundance of microorganisms. The influence of the combination of pretreatment and density gradient on the number of Bacteria and Archaea was determined by qPCR. For each step of the protocol, we estimated the concentration of bacterial and archaeal V3 gene copies per gram of organic matter (Fig. 3). The mean numbers of 16S rRNA gene copies were 8.16 ⫻ 1011 ⫾ 1.57 ⫻ 1011 and 4.87 ⫻ 109 ⫾ 6.07 ⫻ 108 for Bacteria and Archaea, respectively. While the methodology did not influence the total number of Archaea (ANOVA, P ⫽ 0.1005), significant differences in abundances were found for bacterial communities (ANOVA, P ⫽ 0.0004). Only the Gentodenz step significantly increased the abundance of recovered Bacteria (SNK test, P ⬍ 0.05). The influence of the protocol steps on the Archaea/Bacteria ratio was also studied using qPCR data (Fig. 4). The ANOVA test revealed a significant difference between the Archaea/Bacteria ratios (P ⫽ 0.0067, F ⫽ 3.72). Indeed, 3 steps differed: DNase/Gentodenz, pectinase/Gentodenz, and DNase/amylase. However, the SNK test showed that the initial step and the final step were not statistically different. Effect of the extraction protocol on the structure and diversity of microbial communities. The structure and diversity of the bacterial and archaeal communities were examined for
Archaea Bacteria ratio (%)
25
b
b 20
b
a
a a
15
10
5
0 Initial
α-amylase
Pectinase
Cellulase
DNase
Gento
FIG. 4. Archaea/Bacteria ratios with respect to enzyme and Gentodenz steps, based on enumeration by qPCR using primer sets BAC338F/BAC805R (for Bacteria) and ARC787F/ARC1059R (for Archaea). Standard deviations are displayed. Statistical differences between groups are indicated by the letters above the bars.
each step of the protocol by using CE-SSCP fingerprints. The Euclidean distances between CE-SSCP fingerprints were computed and displayed in dendrograms (Fig. 5A). The greatest genetic distance between a pair of CE-SSCP profiles was as low as 0.1, indicating that no clear shift occurred during the protocol. The microbial communities coming from one group of samples could not be statistically distinguished, in particular among the three groups defined, i.e., the initial step, the different enzyme steps, and the cell flotation step (nonsignificant ANOSIM values). The structure of the microbial communities thus did not vary. The mean Simpson diversity index for the Archaea remained stable at around 2.8 all along the protocol. The mean Simpson diversity index for Bacteria decreased slightly, from 3.3 to 2.2, but only during the final flotation step (ANOVA, P ⫽ 0.001, F ⫽ 10.9). Whatever the bacterial CESSCP profile, all overlapping peaks were present (Fig. 5B). The relative intensity of overlapping peaks corresponding to the relative abundance of bacterial species was influenced by the final flotation step (Fig. 5B). This variation of the relative abundance of the bacterial species could induce a disruption in the methanogenic activity. Therefore, we examined whether the activity of microbial communities was not affected by variation in relative abundance. Effect of the extraction protocol on the activity of recovered cells. Monitoring of the dynamics of biogas production in standardized anaerobic incubation experiments revealed a rapid recovery of the fermentative activity of the recovered cells and a preservation of the ability to degrade both substrates (glucose and acetate) (Fig. 6). The reactions were completed in 12 days. On the one hand, the main gas produced with 1 gCOD glucose 䡠 liter⫺1 was hydrogen, and we did not detect any methane, in accordance with the incubation conditions used. The presence of hydrogen underscored the presence of active fermentative Bacteria. On the other hand, when looking at the incubation experiments with the mixture of glucose and acetate, the main gases produced were CO2 and CH4. The methanogenesis took much more time, but the experiment indicated that the recovered cells also contained active archaeal methanogen populations.
VOL. 77, 2011
RECOVERY OF VIABLE MICROBIAL CELLS FROM SLUDGE
8491
FIG. 5. (A) Dendrograms displaying genetic differences between bacterial and archaeal communities. The dendrograms were obtained using Euclidean distances and an average grouping algorithm applied to mean CE-SSCP profiles of DNA fragments amplified using primer sets W49/W104 (Bacteria) and W274/W275 (Archaea). The principal steps of the protocol were highlighted differently: group 1, initial communities (light gray), group 2, enzymatic steps (gray), and group 3, final Gentodenz step (black). (B) Mean CE-SSCP profiles of DNA fragments amplified using the following primer sets: W49/W104 (Bact) and W274/W275 (Arch). The mean CE-SSCP profiles represent a mean of profiles for each principal step of the protocol. The couples Bact1/Arch1, Bact2/Arch2, and Bact3/Arch3 represent the mean profiles for the initial, enzymatic, and Gentodenz steps, respectively. The different CE-SSCP profiles were aligned on the basis of the common ROX internal standard, and areas were normalized. The x and y axes of each CE-SSCP profile represent the relative peak migration distance and the relative peak intensity, respectively.
Cumulated volume of biogas (ml.g-1 introduced COD)
8492
BRAUN ET AL.
APPL. ENVIRON. MICROBIOL.
500
A 400
B B 300
C C 200
100
0 0
5
10
15
20
25
30
time (day)
FIG. 6. Biogas production by recovered microbial cells under standard anaerobic conditions. The recovered cells were incubated with 1 gCOD 䡠 liter⫺1 glucose (solid line) or 0.5 gCOD 䡠 liter⫺1 glucose and 0.5 gCOD 䡠 liter⫺1 acetate (broken line). The range of expected hydrogen production from a substrate at a glucose concentration of 1 gCOD 䡠 liter⫺1 is represented in gray. Literature values for maximum hydrogen production are represented by three horizontal bars on the dotted and dashed lines: A (25), B (25), and C (12).
DISCUSSION It is challenging to extract microorganisms from an environment, like sludge, where the difference in density between microbial cells and EPS compounds is tenuous. Here, we started with a protocol that had been developed for soils (3, 5, 20) and was also adapted for sediments (2). However, cell flotation of sludge samples was impossible whatever the concentration of Gentodenz tested. Some enzymatic pretreatments were thus applied. The pH, the temperature, and the reaction time were optimized for each enzyme based on an estimation of the sludge composition with respect to polysaccharides, complex carbohydrates, cellulose, and DNA (30). The required amount of enzyme was doubled to take into account the partial adsorption of the added enzymes in the sludge (10). The workflow that met our requirements (Fig. 1) could be processed in one working day. Enzymatic pretreatments followed by a gradient extraction allowed the recovery of all microorganisms from the sludge (Fig. 3). The mean concentrations of bacterial and archaeal 16S gene copies per gram of organic matter converted per millimeter of sludge (1.6 ⫻ 1010 and 1.2 ⫻ 107, respectively) were on the same order as values reported in the literature (between 109 and 1011 for Bacteria and between 107 and 2 ⫻ 109 for Archaea) (23, 29). The proposed protocol can be further applied to other complex matrices constituted by bioaggregate or biofilm. The preservation of the density, quality, and activity of the anaerobic Archaea, which had been checked carefully, was a crucial point to preserve the methanogenic capacity of the sludge. Distinguishing 3 groups, we checked whether microbial community structures were affected by the successive enzymatic/physical treatments. According to the tenuous distances between the archaeal SSCP fingerprints (Fig. 5), there were no differences between the communities. The molecular studies underscore that the association of enzymatic pretreatment and density gradient
did not affect either the number or the diversity of archaeal communities (Fig. 3). In contrast, Bacteria were slightly affected in terms of abundance (Fig. 5B), diversity, and community structure, but only by the final cell flotation step. Previous studies already reported some preferential extraction of specific species of bacteria, like Gammaproteobacteria, during cell flotation, while other species, like Actinomycetes spp., were less abundant (7). However, the enzymatic pretreament did not change the representativeness of Bacteria compared to the original sludge sample. The differences in abundance and structure of the bacterial community in the Gentodenz step could be explained by a difference in allocation of bacterial species by the Gentodenz protocol. Even though we observed slight differences in bacterial communities between the final step and the other steps, the Archaea/Bacteria ratios at the initial and final steps were not significantly different. Under methanogenic conditions, the Archaea/Bacteria ratio may vary between 1% (22) and 20% (13). The quite high values observed in this study (between 14 and 19%) resulted in a good biogas production potential. The archaeal communities were thus conserved, as were their proportions in the total microorganism community. One aim of this study was to find a protocol to recover viable microbial communities of sludge to use them as an inoculum in anaerobic methanogenic conditions. The protocol preserved the overall capability of the microbial community to produce methane under anaerobic conditions (Fig. 6). The differences in biogas production with respect to the type and amount of substrate added may be related to the difference in growth rates of fermentative and methanogenic microorganisms. Adding too much substrate per amount of microorganisms present can favor fermentative pathways that further inhibit the methanogenic activity. Indeed, acidogenic Bacteria have much shorter generation times (a few hours) than methanogens (several hours to several days). Under organic overload conditions, the faster metabolism of acidogenic Bacteria induced an accumulation of metabolic intermediates, especially hydrogen and volatile fatty acids. These metabolites are known to be inhibitors of acetogenic and methanogenic microorganisms, which can stop methane production (32). When 1 gCOD 䡠 liter⫺1 was added to extracted cells, methane production was inhibited and hydrogen was produced instead. However, the maximum hydrogen production observed was in line with values reported in the literature for untreated inoculum (12, 25). This indicates that recovered cells were sufficiently active to serve as an inoculum source for anaerobic bioreactors. The combination of enzymatic pretreatment and density gradient preserved the viability of the cells and did not affect the archaeal communities. On the one hand, the conservation of cell viability ensured their overall metabolic and functional potential; on the other hand, the integrity of the archaeal methanogenic potential was preserved. This new extraction method allowed us to recover viable microorganisms from sludge without affecting the methanogenic activity. Once the cells recovered, they could be reinoculated in a given and characterized environment, and their behavior (diversity, quantity, and activity) could be studied in methanogenic conditions.
VOL. 77, 2011
RECOVERY OF VIABLE MICROBIAL CELLS FROM SLUDGE
Furthermore, the association of enzymatic pretreatment and density gradient allowed recovery of the sludge microbial communities devoid of compounds of their original environment. It is now possible to study microorganism communities of sludge or other complex environmental samples rich in EPS, like inoculum in a “controlled” environment (i.e., an environment with controlled physicochemical characteristics), without disturbing interactions between the cells and their original matrices. The EPS of sludge or other organic and/or inorganic compounds from complex environmental samples could also interfere with molecular tools (3, 5). By decreasing the presence of EPS and other compounds, the presented protocol offers interesting perspectives for optimizing the use of molecular tools for studying of microbial communities of sludge or other complex matrices.
14.
15. 16.
17.
18.
19. 20.
21.
ACKNOWLEDGMENTS We gratefully acknowledge the reviewers for their interesting and constructive comments that greatly improved the quality of the manuscript. We gratefully acknowledge the financial support given for this research by the Agence de l’Environnement et de la Maîtrise de l’Energie (ADEME) and the Institut National de la Recherche Agronomique (INRA). This work has been funded by ADEME (convention number: 0906C0008) from the Programme National de Recherche sur les Perturbateurs Endocriniens (PNRPE).
22.
23.
24.
25.
REFERENCES 1. Aceves-Lara, C. A., E. Latrille, P. Buffiere, N. Bernet, and J. Steyer. 2008. Experimental determination by principal component analysis of a reaction pathway of biohydrogen production by anaerobic fermentation. Chem. Eng. Process. Process Intensif. 47:1968–1975. 2. Amalfitano, S., and S. Fazi. 2008. Recovery and quantification of bacterial cells associated with streambed sediments. J. Microbiol. Methods 75:237– 243. 3. Barra Caracciolo, A., P. Grenni, C. Cupo, and S. Rossetti. 2005. In situ analysis of native microbial communities in complex samples with high particulate loads. FEMS Microbiol. Lett. 253:55–58. 4. Batstone, D., et al. 2002. The IWA anaerobic digestion model no 1 (ADM1). Water Sci. Technol. 45:65–73. 5. Bertaux, J., U. Gloger, M. Schmid, A. Hartmann, and S. Scheu. 2007. Routine fluorescence in situ hybridization in soil. J. Microbiol. Methods 69:451–460. 6. Clarke, K. R. 1993. Non-parametric multivariate analyses of changes in community structure. Aust. Ecol. 18:117–143. 7. Courtois S., et al. 2001. Quantification of bacterial subgroups in soil: comparison of DNA extracted directly from soil or from cells previously released by density gradient centrifugation. Environ. Microbiol. 3:431–439. 8. Cullen, D. W., and P. R. Hirsch. 1998. Simple and rapid method for direct extraction of microbial DNA from soil for PCR. Soil Biol. Biochem. 30:983– 993. 9. Delmont, T. O., et al. 2011. Accessing the soil metagenome for studies of microbial diversity. Appl. Environ. Microbiol. 77:1315–1324. 10. Dey, E., E. Szewczyk, J. Wawrzynczyk, and O. Norrlow. 2006. A novel approach for characterization of exopolymeric material in sewage sludge. J. Residuals Sci. Technol. 3:97–103. 11. Godon, J. J., E. Zumstein, P. Dabert, F. Habouzit, and R. Moletta. 1997. Molecular microbial diversity of an anaerobic digestor as determined by small-subunit rDNA sequence analysis. Appl. Environ. Microbiol. 63:2802– 2813. 12. Guo, X. M., E. Trably, E. Latrille, H. Carre`re, and J.-P. Steyer. 2010. Hydrogen production from agricultural waste by dark fermentation: a review. International Journal of Hydrogen Energy 35:10660–10673. 13. Habouzit, F., G. Ge´vaudan, J. Hamelin, J.-P. Steyer, and N. Bernet. 2011. Influence of support material properties on the potential selection of Ar-
26. 27. 28.
29.
30.
31.
32.
33.
34.
35.
36.
8493
chaea during initial adhesion of a methanogenic consortium. Bioresource Technol. 102:4054–4060. Holben, W. E., J. K. Jansson, B. K. Chelm, and J. M. Tiedje. 1988. DNA probe method for the detection of specific microorganisms in the soil bacterial community. Appl. Environ. Microbiol. 54:703–711. Jorand, F., et al. 1995. Chemical and strurural (2D) linkage between bacteria within activated-sludge flocs. Water Res. 29:1639–1647. Klappenbach, J. A., P. R. Saxman, J. R. Cole, and T. M. Schmidt. 2001. rrndb: the ribosomal RNA operon copy number database. Nucleic Acids Res. 29:181–184. Lindahl, V., K. Aa, and R. Olsen. 1996. Effects on microbial activity by extraction of indigenous cells from soil slurries. FEMS Microbiol. Ecol. 21:221–230. Lindahl, V. 1996. Improved soil dispersion procedures for total bacterial counts, extraction of indigenous bacteria and cell survival. J. Microbiol. Methods 25:279–286. Lindahl, V., and L. R. Bakken. 1995. Evaluation of methods for extraction of bacteria from soil. FEMS Microbiol. Ecol. 16:135–142. Maron, P. A., et al. 2006. Evaluation of quantitative and qualitative recovery of bacterial communities from different soil types by density gradient centrifugation. Eur. J. Soil Biol. 42:65–73. Michelland, R., S. Dejean, S. Combes, L. Fortun-Lamothe, and L. Cauquil. 2009. StatFingerprints: a friendly graphical interface program for processing and analysis of microbial fingerprint profiles. Mol. Ecol. Resour. 9:1359– 1363. Moletta-Denat, M., V. Bru-Adan, J.-P. Delgenes, J. Hamelin, N. We´ry, and J.-J. Godon. 2010. Selective microbial aerosolization in biogas demonstrated by quantitative PCR. Bioresource Technol. 101:7252–7257. Nettmann, E., et al. 2010. Polyphasic analyses of methanogenic archaeal communities in agricultural biogas plants. Appl. Environ. Microbiol. 76: 2540–2548. Nielsen, P., T. Thomsen, and J. Nielsen. 2004. Bacterial composition of activated sludge - importance for floc and sludge properties. Water Sci. Technol. 49:51–58. Que´me´neur, M., J. Hamelin, S. Benomar, M.-T. Guidici-Orticoni, E. Latrille, J.-P. Steyer, and E. Trably. Changes in hydrogenase genetic diversity and proteomic patterns in mixed-culture dark fermentation of mono-, diand tri-saccharides. Int. J. Hydrogen Energy, in press. Ramette, A. 2007. Multivariate analyses in microbial ecology. FEMS Microbiol. Ecol. 62:142–160. R Development Core Team. 2010. R: a language and environment for statistical computing. R Foundation for Statistical Computing, Vienna, Austria. Sen, B., J. Hamelin, V. Bru-Adan, J. Godon, and T. Chandra. 2008. Structural divergence of bacterial communities from functionally similar laboratory-scale vermicomposts assessed by PCR-CE-SSCP. J. Appl. Microbiol. 105:2123–2132. Shin, S. G., S. Lee, C. Lee, K. Hwang, and S. Hwang. 2010. Qualitative and quantitative assessment of microbial community in batch anaerobic digestion of secondary sludge. Bioresour. Technol. 101:9461–9470. Simon, S., et al. 2009. Evaluation of size exclusion chromatography (SEC) for the characterization of extracellular polymeric substances (EPS) in anaerobic granular sludges. Bioresour. Technol. 100:6258–6268. Snell-Castro, R., J. Godon, J. Delgenes, and P. Dabert. 2005. Characterisation of the microbial diversity in a pig manure storage pit using small subunit rDNA sequence analysis. FEMS Microbiol. Ecol. 52:229–242. Thiele, J. H. 1991. Mixed-culture interactions in methanogenesis, p. 260–292. In J. G. Zeikus and E. A. Johnson (ed.), Mixed cultures in biotechnology. The McGraw-Hill Environmental Biotechnology Series. McGraw-Hill, New York, NY. Wawrzynczyk, J., E. Szewczyk, O. Norrlow, and E. Dey. 2007. Application of enzymes, sodium tripolyphosphate and cation exchange resin for the release of extracellular polymeric substances from sewage sludge. Characterization of the extracted polysaccharides/glycoconjugates by a panel of lectins. J. Biotechnol. 130:274–281. Wawrzynczyk, J., M. Recktenwald, O. Norrlo ¨w, and E. S. Dey. 2008. The function of cation-binding agents in the enzymatic treatment of municipal sludge. Water Res. 42:1555–1562. Yu, Y., C. Lee, J. Kim, and S. Hwang. 2005. Group-specific primer and probe sets to detect methanogenic communities using quantitative real-time polymerase chain reaction. Biotechnol. Bioeng. 89:670–679. Zumstein, E., R. Moletta, and J. Godon. 2000. Examination of two years of community dynamics in an anaerobic bioreactor using fluorescence polymerase chain reaction (PCR) single-strand conformation polymorphism analysis. Environ. Microbiol. 2:69–78.