Development and application of the monetary rule for the base ... demonstrating the expediency of their development on the basis of the spread-adjusted Tay-.
Banks and Bank Systems, Volume 9, Issue 3, 2014
Serhiy Kozmenko (Ukraine), Taras Savchenko (Ukraine), Yanina Piontkovska (Ukraine)
Development and application of the monetary rule for the base interest rate of the National Bank of Ukraine Abstract The paper studies methodological approaches to the formation of monetary policy rules for the base interest rate of the National Bank of Ukraine demonstrating the expediency of their development on the basis of the spread-adjusted Taylor rule. It carries out the assessment of equilibrium values for the rule’s parameters by using a modified HodrickPrescott filter as well as the identification of the possible parameters of the monetary rule and the estimation of their coefficients through the development of multivariate regression models. Keywords: monetary policy rule, spread-adjusted Taylor rule, central bank, monetary market, inflation targeting. JEL Classification: E52, E58.
Introduction¤ In the previous studies we indicated that during the introduction by the National Bank of Ukraine of the real reforms aimed at inflation targeting it is expedient to consider the possibility of developing a monetary rule for the base interest rate of the central bank. The Memorandum of Economic and Financial Policy (here in after referred to as the Memorandum) that was signed between Ukraine and the IMF in April 2014 defines the commitments of Ukraine to introduce the regime of inflation targeting within 12 months since the date of the document’s signing [1]. The Memorandum also stipulates that the National Bank is obliged to take measures, which are necessary to improve the efficiency of its interest rate policy. Thus, the problem of developing a monetary rule for the interest rate grows in importance receiving an immediate practical value. It should be noted that in our previous work we offered scientific approaches to the formation of the monetary rule for the Ukrainian economy; however, this rule was developed for the monetary aggregates [2]. Inexpediency of developments in the previous years of the monetary rule for the interest rate was explained by the lack of comprehensive reforms aimed at introducing inflation targeting in Ukraine, which should include: liberalization of the exchange rate formation on the foreign exchange market; increase of transparency, independence and scientific validity of the monetary policy; availability of the political will to reform the monetary policy instruments and the strategies for their application. During the first half of 2014 essential practical steps were made to optimize the monetary policy of the National Bank of Ukraine, in particular, liberalization of approaches to the formation of the exchange rate and commitments to the IMF made at the highest political level regarding the implementation of the inflation targeting regime.
¤ Serhiy Kozmenko, Taras Savchenko, Yanina Piontkovska, 2014.
1. Research of parameters of the monetary policy’s interest rate rule for the economy of Ukraine For the first time the monetary rule for the interest rate was substantiated by John Taylor over 20 years ago [3]. In his study, on the basis of empirical data of the U.S. economy, he justified the expediency of transition from discretionary monetary regulation to the use of monetary policy instruments based on the defined stable relationships between the parameters of the money market and macroeconomic indicators. These relationships, formalized as an equation or a system of equations, have become to be known as the monetary rule. It should be noted that over the two decades the monetary rule for the interest rate has become widely accepted among researchers and practitioners. In particular, in the explicit and/or implicit form the monetary rule is used by most central banks, the policy of which is based on the inflation targeting regime. The key elements of the monetary rule remain practically unchanged, but the order of their mathematical consideration and additional elements may vary significantly. Researchers have proposed a number of monetary rules for the interest rate [4-7], but most of them are modifications of the Taylor rule. Thus, the relationships that form the basis of this rule have been confirmed empirically in many countries over a lengthy period of time. Therefore, we consider it necessary to develop methodological approaches to the formation of the monetary rule for the Ukrainian economy based on the monetary Taylor rule. As noted above, the effectiveness of monetary rules is confirmed by the significant experience of their practical application. However, the results of the last global financial crisis of 2008-2009 caused certain debates in the scientific community about the usefulness of the rules during financial crises. For example, British researchers say that the monetary policy of their country within the period 19922007 was described quite efficiently by the use of the Taylor rule, but this rule did not work during the
50 Electronic copy available at: http://ssrn.com/abstract=2542701
Banks and Bank Systems, Volume 9, Issue 3, 2014
financial crisis of 2008-2009 [8]. In response to such criticism John Taylor published a number of works [9-12], in which he proved the expediency of the rule’s use offering to adjust classical indicators to the interest rate spread. In his opinion, this indicator should be a reflection of the level of the money market imbalances making it possible to consider the impact of financial crisis on the parameters of the monetary rule. The idea of adjusting the classic Taylor rule to the interest rate spread was supported by a number of scholars. The obtained modified rules have become to be known as the Spread-Adjusted Taylor rules [8; 13; 14]. A publication of the representative of the Federal Reserve Bank of New York Vasco Curdia and the professor of the Columbia University Michael Woodford [13] contains the formula of the spread-adjusted Taylor rule (equation 1):
it = rt n + ij ʌ ʌ t + ij y ( Y t � Y t n ) � ij Ȧ Ȧ t .
(1)
Where it is the main short-term interest rate of the central bank; rtn is the equilibrium real interest rate; St is the level of inflation; Yt is the actual real GDP; Ytn is the equilibrium real GDP; Zt is the interest rate spread; IS, Iy, IZ are the coefficients. Taking this formula as a basis we develop methodological approaches to the formation of the monetary policy interest rate rule for the Ukrainian economy based on the quarterly data for the last ten years. To calculate the real interest rate we propose to use an average (for each quarter) discount rate of the National Bank of Ukraine as a key reference point of the interest rate policy of the National Bank adjusting it for inflation. The choice of the discount rate as a reference point for the interest rate policy is caused by several factors. First of all, according to Article 1 of the Law of Ukraine “On the National Bank of Ukraine” from 20.05.1999, the discount rate is one of the monetary instruments which help the National Bank of Ukraine to establish a benchmark for banks and other participants of the money and credit market regarding the cost of the borrowed and allocated funds. In addition, the resolution of the National Bank of Ukraine Number 389 from 18.08.2004 [15] states that the discount rate is the main interest rate, which depends on the processes taking place in the macroeconomic sphere and on the money market. Thus, formally the dis-
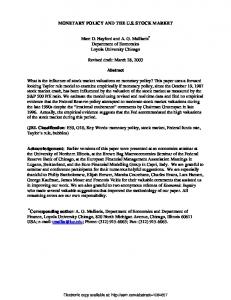
count rate is a key reference point for the cost of funds on the money market of Ukraine. Secondly, there are no alternative relevant indicators, which could be considered as the equilibrium price targets for the domestic money market. Possible alternative indicators (interbank market rates, interest rates on credits and deposits of commercial banks’ customers, rates on government bonds) characterize only certain segments of the money market, not the general trends in the value of financial resources in the economy. In addition, these alternative rates are not under the control of the National Bank of Ukraine. On the other hand, according to Article 27 of the Law of Ukraine “On the National Bank of Ukraine” the National Bank establishes the procedure for determining the discount rate and other interest rates on its operations. The procedure for determining the discount rate of the National Bank is specified by Section 3 of the provision “On the interest rate policy of the National Bank of Ukraine” [15]. This document states that the discount rate is used by the National Bank both as a means of monetary policy implementation and the reference point for the price of money. It is also indicated that the dynamics of the rate depends primarily on the general economic trends, macroeconomic and budgetary processes and the state of the monetary market. According to the model of the equilibrium interest rate is used. In most studies, the definition of equilibrium indicators used in the monetary rules is conducted by smoothing the actual dynamics of these indicators with the use of Hodrick-Prescott filter. For smoothing the discount rate dynamics (and the dynamics of real GDP) we use the modification of the filter proposed by Hyeongwoo Kim [16], which involves the use of the matrix analysis elements. This modification is also used in the research of the World Bank [17]. It should be noted that the separation of the equilibrium discount rate trajectory partially eliminates the actual inertia of its application by the National Bank (sometimes during the study period a situation was observed when this rate remained unchanged for several quarters). Figure 1 shows the actual and the smoothed quarterly dynamics of the National Bank’s discount rate. In addition, the figure shows the dynamics of the average weighted rate for all refinancing instruments that were used by the National Bank during each study period.
51 Electronic copy available at: http://ssrn.com/abstract=2542701
Banks and Bank Systems, Volume 9, Issue 3, 2014
Fig. 1. Dynamics of rates of the National Bank of Ukraine for the period of 2003-2014
As we can see from this figure, the discount rate in each study period was lower than the average refinancing rates. Moreover, it remained stable for a long period of time. The trajectory of the smoothed discount rate reflects the general logic of the application of interest rate levers in the monetary policy over the past decade. The analysis of the trajectories leads us to the conclusion that the indicative rate of the interest rate policy mainly had a pro-cyclical impact on the money market while interest rate levers were not the key instruments regulating the dynamics of the money supply. This function was performed mainly by the National Bank’s operations on the foreign exchange market (currency interventions) and administrative influence on the situation on the money market. It should be noted that we support the opinion of many domestic researchers about the insufficient effectiveness of the interest rate channel in the Ukrainian monetary policy and the consequent inefficiency of the discount rate use as a benchmark for the interest rate policy. However, given the lack of other relevant indicators of the National Bank’s interest rate policy and considering the commitments of Ukraine to improve the effectiveness of the interest rate policy determined by the memorandum with the IMF, we believe it appropriate to use this rate in developing monetary policy rules. Another indicator used in formula 1 is the level of inflation (St). As the law “On the National Bank of Ukraine” determines that the main objective of the National Bank’s activity is to maintain a stable rate of consumer inflation in the medium term perspective, the consumer price index is used as an indicator of inflation rate. It should be emphasized that the monetary policy rule is formed for quarterly data.
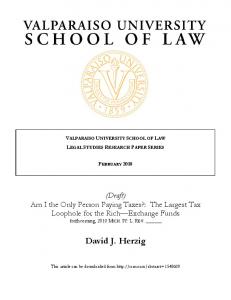
Therefore, for calculations quarterly consumer price indices were taken, which were calculated according to the corresponding quarter of the previous year. The next component of the monetary rule is the output gap, which is calculated as a difference between the actual real GDP (Yt) and the equilibrium dynamics of this indicator (Ytn), which characterizes the equilibrium level of GDP (Figure 2). This figure presents the quarterly dynamics of the real GDP in Ukraine over the past decade as well as a linear trend defined by the Hodrick-Prescott filter for this indicator. The figure also shows the formula and significance of the linear trend, which indicates its unreliability. Other ways to determine the real GDP trend of Ukraine by means of simple functions considering the obtained value of the approximation reliability, also show the statistical insignificance of the obtained results: for logarithmic function R2 = 0.247; for polynomial trend of the third degree R2 = 0.273; for power function R2 = 0.218; for exponential trend R2 = 0.161. Therefore, it is reasonable to use more sophisticated methods of determining the trend and cyclical component of GDP, including Hodrick-Prescott filter. The majority of foreign researchers [8; 18; 19; 20] use this particular filter for the estimation of equilibrium GDP as a component of the monetary rule. In addition, the possibilities for assessing the equilibrium dynamics of macroeconomic indicators of Ukraine with the help of the Hodrick-Prescott filter were positively evaluated by domestic researchers [21]. In particular, they point to the expediency of applying this filter to the data series starting from the 1st quarter of 2001, when the systemic economic crisis of the 90-ies was overcome, which was accompanied by significant imbalances in macroeconomic parameters.
52 Electronic copy available at: http://ssrn.com/abstract=2542701
Banks and Bank Systems, Volume 9, Issue 3, 2014
Fig. 2. Dynamics of real GDP in Ukraine for the period of 2003-2014
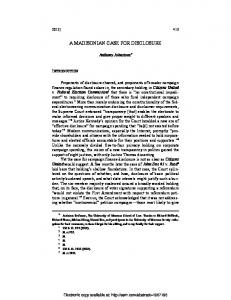
The last element of equation 1 is the interest rate spread. Economic studies use various spread indicators. Considering the focus of our research and availability of the necessary data for the studied period we use two indicators of the interest rate spread. The first indicator is based on the analysis of the situation on the wholesale segment of the world financial market, which is calculated as a difference between the rate on government bonds of Ukraine and the rate on U.S. Treasury bonds (herein after referred to as the government bond spread). For the formation of a data series for this indicator we use the World Bank database [22]. To calculate all other indicators for this work we use the official electronic databases of the National Bank of Ukraine [23] and the State Statistics Service [24]. The second indicator characterizes the price dynamics in the retail segment of the money market. It is calculated as a difference between the average weighted lending and deposit rates of Ukrainian banks in the national currency on the transactions with customers (herein after referred to as the credit spread). The dynamics of these indicators is shown on Figure 3.
As we can see from this figure, there is no correlation between these indicators, although the economic logic of their changes is similar: their increase indicates the growth in risks and significant impact of external shocks on the money market. In our opinion, the difference in the dynamics of interest rate spreads shown on Figure 3 is caused by various factors. The size of the spread on government bonds is mainly determined by the assessment of external investors of the riskiness of financing Ukrainian residents as well as the level of liquidity on the international financial markets. In this context a sharp increase in the value of the spread from the fourth quarter of 2008 to the third quarter of 2009 is revealing. During this period, which was characterized by an aggravation of the global financial crisis, the value of the spread on government bonds was 2-3 times higher than the value of the credit spread. On the other hand, the credit spread is determined by the level of liquidity of the banking system of Ukraine and the current political and economic factors that influence the balance between the efficiency and riskiness of using various financial instruments inside the country.
Fig. 3. Dynamics of interest rate spreads during the period of 2003-2014
53
Banks and Bank Systems, Volume 9, Issue 3, 2014
To estimate the parameters of the monetary rule we form a multivariable regression model. Previously we have described some factor signs used in this model: x1 � the equilibrium real interest rate, x2 � the level of inflation, x3 � the interest rate spread, x4 � the output gap. We propose to use a smoothed dynamics of the average weighted interest rate for all refinancing instruments that were used by the National Bank of Ukraine during the corresponding quarter of the studied period.
Table 1 contains the parameters of the multivariable regression equation, which was built by using the credit spread indicator. As shown in Table 1, on the whole, the obtained multivariable model is statistically significant. All coefficients with an exception of the output gap coefficient are also significant. The analysis of the values of the obtained coefficients leads to the conclusion that the biggest impact on the interest rates was caused by the equilibrium real discount rate and inflation dynamics.
Table 1. Static characteristic of the multivariable regression equation with the use of credit spread indicator Indicators
Values of indicators
Regression statistic Multiple R
0.971
R-squared
0.942
Adjusted R-square
0.936
Standard error
0.422
Observations
42
Analysis of variance df
SS
MS
F
F-statistic
Regression
4
107.493
26.873
150.849
2.28038E-22
Residual
37
6.591
0.178
Total
41
114.084
Characteristics of indicators Coefficients
Standard error
t-statistic
P-value
Lower 95%
Upper 95%
Y-intercept
-3.320
1.153
-2.878
0.007
-5.657
-3.320
Variable X1
1.539
0.127
12.133
1.83831E-14
1.282
1.539
Variable X2
1.560
0.112
13.879
3.04318E-16
1.332
1.560
Variable X3
0.140
0.049
2.840
0.007
0.040
0.140
Variable X4
0.012
0.011
1.106
0.276
-0.010
0.012
Table 2 shows the parameters of the obtained multivariable regression equation that was built by using the indicator of the government bond spread. As follows from this table, the obtained multivariable model is characterized by even greater static significance than the previous one. All coefficients with an exception of the output gap coefficient are also significant. The peculiarity of this model is the reverse influence of the
spread indicator (x3) on the dynamics of the resulting indicator, which corresponds to the theoretical model (equation 1) and demonstrates a certain countercyclical component in the interest rate policy of the central bank of Ukraine. Based on the analysis of values of the obtained coefficients conclusions can be made, which are similar to those formulated for the previous model.
Table 2. Static characteristic of the multivariable regression equation with the use of an indicator of the government bond spread Indicators
Values of indicators
Regression statistic Multiple R
0.977
R-squared
0.954
Adjusted R-square
0.949
Standard error
0.377
Observations
42
Analysis of variance df
SS
MS
F
F-statistic
Regression
4
107.493
26.873
191.363
3.55283E-24
Residual
37
6.591
0.178
Total
41
114.084
Coefficients
Standard error
P-value
Lower 95%
Characteristics of indicators
54
t-statistic
Upper 95%
Banks and Bank Systems, Volume 9, Issue 3, 2014
Table 2 (cont.). Static characteristic of the multivariable regression equation with the use of an indicator of the government bond spread Indicators
Values of indicators
Characteristics of indicators Coefficients
Standard error
t-statistic
P-value
Lower 95%
Upper 95%
Y-intercept
-0.619
0.815
-0.759
0.453
-2.270
1.033
Variable X1
1.382
0.107
12.968
2.47121E-15
1.166
1.598
Variable X2
1.421
0.094
15.070
2.26118E-17
1.230
1.612
Variable X3
-0.066
0.015
-4.413
8.50698E-05
-0.097
-0.036
Variable X4
-0.024
0.013
-1.839
0.074
-0.051
0.002
The use of leads (reflecting the expectations of economic agents) and lags (reflecting the inertial influence of factor signs on the final results) at economically reasonable intervals does not lead to a significant improvement of the static relevance of the described multivariate regression models (Table 1 and Table 2). To obtain a model with significant coefficients we have to exclude the output gap indicator from the multivariable regression, which is built by using the indicator of government bond spread (Table 2). As a result of these transformations we obtain the regression equation given in formula 2:
it = 1 .3 7 rt n + 1 .4 2 ʌ t � 0 .0 5 Ȧ t ,
(2)
where it is the smoothed real refinancing rate (average weighted rate for all instruments); rtn is the equilibrium real discount rate of the National Bank of Ukraine; St is the consumer price index; Zt is the interest rate spread on government bonds. In general, the regression dependence expressed by formula 2 is statistically significant (Į = 0.05; R2 = 0. 95). The value of F-test is 239, and its significance is 1.0542 E-24. This model is also characterized by the significance of all coefficients for all factor signs. Absolute values of these coefficients and their influence on the resultant practically coincide with the coefficients of the model, which is described in Table 2. Thus, we can conclude that during the period of 2004-2013 the most significant impact on the refinancing rate of the National Bank of Ukraine was made by the dynamics of the equilibrium discount rate and the consumer price index.
2. The use of the spread-adjusted Taylor rule for assessing the effectiveness of the interest rate policy of the National Bank of Ukraine. During the next stage of our research we solve the task of forming the assessment trajectory for the base interest rate of monetary policy based on the coefficients substantiated by researchers for monetary rules. The classic work of John Taylor [3], which first proposed the use of monetary rule for the main interest rate of the central bank (formula 3), empirically determined the values of coefficients of the inflation rate and the output gap: r = p + 0,5y + 0,5 u (p – 2) + 2,
where r is the base rate of the Federal Reserve System, p is the annual inflation rate; y is the deviation of real GDP from its equilibrium level. In his subsequent publications [18] John Taylor points out that the above formula determines the expediency of increasing the base rate of the monetary policy of the Federal Reserve System 1.5 times of any excessive inflation and the necessity to increase 0.5 times the base rate of the Federal Reserve System as a result of the positive output gap. The acquired coefficients are a reference point for further studies of the monetary policy rules. However, empirical studies indicate the probability of deviation of the actual coefficients from the values, which are relevant for the U.S. economy. For example, article [25] describes a model of small open economies in the developing countries (South Africa, Mexico, Indonesia and Thailand). One of the equations of this model is the modified Taylor rule (formula 4):
Log ( R t / R ) = ȡ y log ( y t / y ) + ȡ ʌ log ( ʌ t / ʌ ) + ȡ µ log ( µ t / µ ) + ȡ s log ( s t / s ) + log ( Ȟ t ),
where Rt is the basic short-term rate of the central bank; yt is the real GDP; ʌt is the consumer inflation; µt is the dynamics of the money supply growth; st is the real exchange rate. In this formula indicators R, y, ʌ, µ, s are equilibrium values of the variables yt, ʌt, µt, st respectively. Table 3 provides an assessment of the coefficients of the above equation according to the method of maximum-likelihood estimation.
(3)
(4)
As formula 1 does not use indicators for the dynamics of the money supply and the real exchange rate, we are interested only in the coefficients of real GDP and inflation. The analysis of data coefficients makes it possible to conclude that the coefficients of the inflation rate range from 1.1 to 0.3 and for each of the studied economies exceed the coefficients of the real GDP (ranging from 0 to 0.2). Therefore, despite the fact that the values of 55
Banks and Bank Systems, Volume 9, Issue 3, 2014
actual coefficients depend on the specification of the monetary rule formula and the structure of the studied economy, they do not significantly deviate from the ones substantiated by Taylor. Also un-
changed remains the ratio between these coefficients: central banks should react more strongly to inflation processes than to real GDP deviation from the equilibrium value.
Table 3. Results of the assessment of coefficients in the equation 3 Indicator
Mexico
South Africa
Indonesia
Thailand
value
standard error
value
standard error
value
standard error
value
Uy
0.2128
0.0694
0.0098
0.0039
0.000
0.0001
0.0143
standard error 0.0531
US
1.0779
0.3685
0.8406
0.1497
0.8098
0.0204
0.3375
0.2535
UP
0.6545
0.1039
0.1803
0.1434
0.1901
0.0237
0.4777
0.1044
Us
0.0000
0.0013
8 u 10-7
0.0000
0.0862
0.0490
0.0952
0.0548
Source: Peters Amos [25].
This conclusion is confirmed by the results of research done by the employees of the Central Bank of Canada [26], who in their quarterly predictive models use monetary policy rules for their interest rate (equation 5):
i t = i t* + 3 .0 ( ¹ t � ¹*t ) + 0 .5 ( y t � y *t ) ,
(5)
where it is the basic interest rate of the central bank; i*t is the equilibrium value of the interest rate; zt is the actual base inflation; z*t is the target base inflation; yt is the dynamics of real GDP; y*t is the dynamics of equilibrium real GDP. As follows from formula 5, the coefficient that reflects the reaction of the Central Bank of Canada to inflation shocks is 3.0 while the coefficient of reaction to general shocks in production is 0.5. The paper also indicates that in some cases more adequate results were obtained in models in which the coefficient of output gap was 2.0. Finally, in our multivariate regression models (Tables 1 and 2), the coefficients of the inflation indicator (x2) and output gap (x4) approach the theoretical values discussed earlier. In particular, the coefficient of the inflation indicator was 1.56 and 1.42, respectively (with the mean value of 1.49, which is fully consistent with the classical Taylor rule). Thus, during the modeling of the optimal trajectory of the base interest rate we use coefficients substantiated in the classical works of Taylor: 1.5 for inflation indicator and 0.5 for output gap indicator. The coefficient of the equilibrium real interest rate (rtn) according to the majority of explicit monetary rules for interest rate (formulas 1, 3 and 5) equals 1. In this way the only undetermined coefficient remains the coefficient of the indicator of the interest rate spread. A significant part of research of the American scientists such as Vasco Curdia and Michael Woodford [13] is devoted to the study of this coefficient’s value. They come to the conclusion that the value of this coefficient depends on two key factors: the duration (impact strength) of crisis phe-nomena during the 56
study period; and the key factor that causes shocks that destabilize the situation on the financial market and lead to the spread increase. In this paper we offer a set of coefficients’ values with the spread indicator (Zt), which can be chosen according to the abovementioned parameters. At the time of our study the global financial crisis occurred, the consequences of which significantly influenced the financial market of Ukraine for about 6 quarters. It is well known that the key factors of this crisis lie in the area of financial relations. Given these factors, for the indicator of the interest rate spread we have chosen the value 0.75 among the indicators investigated by American scientists [13]. Considering the above mentioned coefficients’ values and parameters of formula 1, to calculate the optimal trajectory of the base interest rate of the National Bank of Ukraine we use formula 6:
it = rt n + 1.5 ʌ t + 0.5 (Yt � Yt n ) � 0.75 Ȧt ,
(6)
where it is the optimal base rate of the National Bank of Ukraine; rtn is the equilibrium real discount rate of the National Bank of Ukraine; ʌt is the consumer price index; Yt is the actual dynamics of real GDP; Ytn is the equilibrium dynamics of real GDP; Zt is the interest rate spread. The results of calculations with the help of formula 6 are shown in Figure 4. This figure demonstrates the optimal trajectories of the base rate of the monetary policy of the National Bank of Ukraine, which are calculated for the credit spread and government bond spread. As we see, these trajectories are quite similar: the correlation coefficient is 0.8. It also shows the trajectory of the smoothed discount rate and refinancing rate, which also have a similar dynamics: the correlation coefficient is 0.96. In addition, we offer the graph of the actual refinancing rate the values of which during most periods vary within the corridor formed by the smoothed refinancing rate (close to upper limit) and discount rate (lower limit). According to paragraph 3.1 of the provision “On interest rate policy of the National Bank of Ukraine” [15], the discount rate is the lowest among the interest
Banks and Bank Systems, Volume 9, Issue 3, 2014
rates used by the National Bank to support banks’ liquidity. The appearance of the optimal base rates of the monetary policy in the corridor of actual smoothed rates of the National Bank of Ukraine can be regarded
as a correspondence of the actual interest rate policy of the National Bank of Ukraine to theoretically substantiated macroeconomic relationships that are formalized by the spread-adjusted Taylor rule.
Fig. 4. Dynamics of calculated and actual rates of the monetary policy of the National Bank of Ukraine
The analysis of Figure 4 leads to the following conclusions. First, during 2004 and the first half of 2007 the use of the interest rate levers of the monetary policy was economically justified. However, since the second half of 2007 the conditions were formed to raise refinancing rates in order to introduce elements of preventive restrictive policy to produce a countercyclical effect and prevent the economic system’s overheating. This policy should be used till the third quarter of 2008. Starting from the forth quarter of 2008, which is characterized by a significant influence of the global financial crisis on the Ukrainian economy, the trajectory of optimal rates is significantly lower than the actual rates of the National Bank of Ukraine indicating insufficient expansionary focus of the central bank’s monetary policy during the crisis development. A significant decrease in refinancing interest rates directed at filling the economy with cheap financial resources should have been conducted since the forth quarter of 2008 to the forth quarter of 2009 inclusively. During the period of 2010-2011 interest rates of the National Bank of Ukraine were economically justified. Since the I quarter of 2012 and till the end of the study period (I quarter of 2014) economically justified rates of the National Bank should be much lower than their actual levels. This conclusion is caused by the need to fill the economy with cheap monetary re-
sources to support the economic activity during the crisis period. Conclusions This work studies scientific and methodological approaches to the formation of the interest rate monetary rule for the Ukrainian economy. Based on the quarterly historical data for the period of 2004-2013 the relationships between the parameters of the spreadadjusted Taylor rule are analyzed. It is determined that during this period the output gap did not significantly affect interest rates of the National Bank of Ukraine. The authors offer methodological approaches to the formation of the monetary policy rule that can be used for modeling the optimal trajectory of the base rate of the National Bank of Ukraine. The obtained model makes it possible to conduct a retrospective evaluation of the efficiency of the central bank’s interest rate instruments. A detailed analysis of the obtained optimal trajectory suggests the possibility of using the proposed spread-adjusted Taylor rule for the Ukrainian economy in order to prevent the negative effects of various shocks on macroeconomic stability and equilibrium of the money market. However, this rule can be fully applied only under conditions of the real implementation of the inflation targeting regime. In addition, in order to use interest rate levers of the monetary policy to adjust macroeconomic imbalances this rule should be formed on the basis of predictive values of its indicators.
References 1. 2.
Ukraine: letter of intent and memorandum of economic and financial policies, Kyiv, April 22, 2014, Available at: // http://www.imf.org/External/NP/LOI/2014/UKR/042214. pdf . Kozmenko S., Savchenko T. Development of an explicit rule of monetary policy for the economy of Ukraine / S. Kozmenko, T. Savchenko // Investment Management and Financial Innovations International Research Journal. – 2013. – ʋ 1. – pp. 8–19.
57
Banks and Bank Systems, Volume 9, Issue 3, 2014
3. 4. 5. 6. 7. 8. 9. 10. 11. 12.
13. 14. 15.
16. 17. 18. 19. 20. 21. 22. 23. 24. 25. 26. 27.
58
Taylor, John B. (1993). Discretion versus policy rules in practice. Carnegie-Rochester Conference Series on Public Policy, 39, pp. 195-214. McCallum, Bennett. T. (1988). “Robustness Properties of a Rule for Monetary Policy”, Carnegie Rochester Conference on Public Policy, 29, pp. 173-203. McCallum, B.T., Nelson, E. Performance of Operational Policy Rules in an Estimated Semiclassical Structural Model// University of Chicago Press, January 1999// Available at: http://www.nber.org/chapters/c7413. Moiseyev, S.R. (2002). Pravila denezhno-kreditnoy politiki /S.R. Moiseyev//Finansy i kredit [Monetary. //Finance and Credit] pp. 37-47. Orphanides A. Taylor Rules // Finance and Economics Discussion Series Divisions of Research & Statistics and Monetary Affairs Federal Reserve Board, Washington, D.C., January 2007. Martin, C. and Milas, C. Financial Stability and Monetary Policy. // Working Paper. Department of Economics, University of Bath, Bath, U. K. – 2010: Available at: http://www.bath.ac.uk/economics/research/working-papers Taylor, John B. The Financial Crisis and the Policy Responses: An Empirical Analysis of What Went Wrong// Stanford University, November 2008. Taylor, John B. (2009). “Getting Off Track: How Government Actions and Interventions Caused, Prolonged and Worsened the Financial Crisis”, Hoover Institution Press. ISBN 0817949712. Taylor, John B. Monetary Policy and the State of the Economy // Testimony before the Committee on Financial Services U.S. House of Representatives, February 26, 2008. Taylor, John B. The Costs and Benefits of Deviating from the Systematic Component of Monetary Policy // Keynote Address at the Federal Reserve Bank of San Francisco Conference on “Monetary Policy and Asset Markets”, February 22, 2008. Vasco Curdia and Michael Woodford. Credit Spreads and Monetary Policy //NBER Working Paper No. 15289, August 2009. Nicholas Apergis, Efrosini Alevizopoulou. Credit Frictions and the Bank Lending Channel: Evidence from a Group of European Banks // Journal of Finance & Economics. – 2013 – Volume 1, Issue 2. – pp. 1 – 13. Pro prosentnu polityku Natsionalnogo banku Ukrainy, polozhennya, zatverdzhene postanovoyu Pravlinnya NBU vid /18.08.2004 r. # 389 [about the interest–rate policy of National Bank of Ukraine : statement approvad by the Board of NBU resolution from August 18, 2004 # 389]// http://zakon1.rada.gov.ua Hyeongwoo Kim. Hodrick-Prescott Filter. March 12, 2004. Eduardo Ley. The Hodrick-Prescott Filter. Knowledge Brief for Bank Staff. / The World Bank. December 17, 2006. Taylor, John B. Using Monetary Policy Rules in Emerging Market Economies // Conference, “Stabilization and Monetary Policy: The International Experience,” November 14-15, 2000, at the Bank of Mexico, December 2000. Clarida, R., J. Gali and M. Gertler. 1998. Monetary policy rules and macroeconomic stability: Evidence and some theory. NBER Working Paper no. 6442. Cambridge, Mass.: National Bureau of Economic Research. Taylor, John B. A Historical Analysis of Monetary Policy Rules [Text] // University of Chicago Press, January 1999 [Electronic resource] // http://www.nber.org/chapters/c7419. Yuriy Polovnyov, Nikolaychuck Serhiy (2005). Otsinka tsykliv dilovoyi aktivnosti ukrainskoyi ekonomiky [The evaluation of Ukrainian Economy business activity cycles//National Bank of Ukraine Journal/Reviev]. World Databank: / World Development Indicators & Global Development Finance Available at: http://databank.worldbank.org/ddp/home.do?Step=2&id=4&hActiveDimensionId=WDI_Ctry. National bank of Ukraine site, Available at: http://www.bank.gov.ua. Ukrainian State Statistic Service Site, Available at: http://www.ukrstat.gov.ua/. Amos Peters. Exchange rate targeting in an estimated small open economy // University of North Carolina at Chapel Hill, April 21, 2009. Côté Denise, Lam Jean-Paul, Liu Ying and St-Amant Pierre. The Role of Simple Rules in the Conduct of Canadian Monetary Policy / Department of Monetary and Financial Analysis // Bank of Canada review, summer 2002. Clarida, R., J. Gali and M. Gertler. 1998. Monetary policy rules in practice: Some international evidence. European Economic Review, 42, pp. 1033-67.