ISSN 0036-0244, Russian Journal of Physical Chemistry A, 2015, Vol. 89, No. 4, pp. 724–728. © Pleiades Publishing, Ltd., 2015. Original Russian Text © Yu.A. Gubarev, N.Sh. Lebedeva, A.I. V’yugin, S.N. Golubev, 2015, published in Zhurnal Fizicheskoi Khimii, 2015, Vol. 89, No. 4, pp. 722–726.
METHODS AND TECHNIQUES OF PHYSICOCHEMICAL STUDIES
Development and Certification of an Automated Differential Titration Photocalorimeter Yu. A. Gubarev, N. Sh. Lebedeva, A. I. V’yugin, and S. N. Golubev Krestov Institute of Solution Chemistry, Russian Academy of Sciences, Akademicheskaya ul. 1, Ivanovo, 153045 Russia e-mail:
[email protected] Received May 22, 2014
Abstract—An automated differential titration photocalorimeter (ADTPC) has been designed for investigating photoinduced processes. This instrument provides means to record thermal and spectral (absorbance) changes in a calorimetric cell. Metrological characteristics of the described ADTPC are detection limit, 0.001 J with a reproducibility of 0.0002 J or better; short-duration noise level, ±5 rel. units; long-duration noise level, ±29 rel. units. ADTPC has been certified against the heats of mixing of solvents and the heat of neutralization reaction between tris(hydroxymethyl)aminomethane and HCl. The photocalorimetric unit of the device has additionally been certified against the heat of photolysis of K3[Fe(C2O4)3] and the heat of isomerization of azobenzene in heptane. Within the claimed errors, the heats measured with ADTPC are in agreement with the values recommended for the above systems. Keywords: photocalorimetry, isomerization, thermodynamics. DOI: 10.1134/S0036024415040081
Photoinduced processes are widespread in nature, are widely used in engineering, and are a subject of extensive investigation. Thermodynamic studies employing calorimetric methods are needed to solve various problems in photochemistry, coordination chemistry, and physical chemistry [1–4]. In addition, investigation of photoinduced processes is essential for biological sciences, including research in metabolism in luminescent bacteria [5] and photosynthesis and measurement of heats associated with vital activities of cell structures in vitro. Promising objects of investigation are unsaturated compounds that can change their conformation under the action of light and, accordingly, their physicochemical properties. Interest in these compounds is due to the fact that they are usable in molecular electronics. At present, numerous works are aimed at finding compounds applicable in molecular logic devices [6]. Of great interest are studies on crown compounds, which are capable of reversibly changing their conformation under the action of light. A possible area of application of this class of compounds is ion-conducting photosensitive materials for solar energy conversion, as well as molecular switches based on these materials [7]. Employing the photocalorimeter would make it possible to determine thermodynamic characteristics of photoisomerization, photocyclization, selfassembly, and restructuring processes in these systems
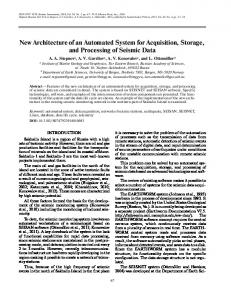
that occur under the action of light and are accompanied by heat evolution or absorption. At present, ADTPCs are not produced on a large scale. In the last decade, there have been no reports on certified precision devices of this type. Isothermal titration calorimeters, for example, Microcal™ (GE Healthcare), TROPAC (United States), and LKB (Sweden) are manufactured now, but they are inapplicable to investigation of photoinduced reactions. Furthermore, these calorimeters suffer from strict limitations imposed on the reaction medium: no organic solvents or aqueous media with pH < 7 are allowed. The design of the calorimeter reported here allows studies to be carried out in various solvents, including organic ones, and in both acid and alkali media. DESIGN OF THE AUTOMATED DIFFERENTIAL TITRATION PHOTOCALORIMETER The photocalorimeter consists of a calorimetric block, a control and measurement unit, a thermostating unit, two calorimetric (sample and reference) cells fitted with a microdoser, a stirring system, a Jouleeffect calibration system, and a light admission system (Fig. 1). The calorimetric block (Fig. 1) is a massive aluminum core (1) placed in a temperature-controlled shell. There are two identical cells (2) in the core. Around
724
DEVELOPMENT AND CERTIFICATION OF AN AUTOMATED DIFFERENTIAL TITRATION
725
The solution in the cell is stirred with a stirrer, which is rotated by an RD-09-P2 reversible motor at a speed of 80 rpm. The temperature of the calorimetric block shell is maintained with an accuracy of ±0.03 K. The control and measurement unit is based on a KP1816ВE31 (AD8031) microprocessor. This unit communicates with a computer via an RS-232 interface. The hardware–software complex includes an instrumentation amplifier with an amplification factor of Kampl = 500, a single-channel analog-to-digital converter (ADC), a load control block, a light source with a controllable shutter, a microdoser, and software operating under WINDOWS XP or higher. Input signal ranges were determined while performing ADC adjustment, which was carried out using an ADC calibration program. The input signal values listed in the Performance Characteristics section are based on the maximum values of output signals from calorimeter sensors. The output data of the complex are 16-bit words received from ADC. Performance characteristics of the hardware–software complex: ambient temperature range, 0 to +55°C; relative air humidity at 25°C, up to 80%; number of measurement channels, 1; number of control channels 2; maximum power per control channel, 60 VA; input voltage measurement range (channel 1), ±2.44 mV; maximum allowable reduced relative error for the channels, 0.2%; output signal, digital serial 16-bit code (65535); power supply, 5 V ± 5%, ±15 V ± 1%. The complex was calibrated as described in an earlier work [8].
2
3 1
Fig. 1. Calorimetric block. See main text for designations.
1
2
Microdoser 3 4 5 6
Fig. 2. Calorimetric cell: (1) titrant receiver, (2) calibrating heater, (3) optical fiber waveguide, (4) spectrometric probe (Avantes PDP-UV-micro-5), (5) capillary of the titrant doser, and (6) stirrer.
the cells, there are batteries of oppositely connected thermocouples (3). A spectrometric probe allowing spectral changes to be recorded is additionally mounted in the measuring cell (Fig. 2). The cartridges of the cells, 50 mL in volume, are made from titanium. A thermostated coiled-tube titrant receiver, 4 mL in volume, is mounted in the body of either cell. RUSSIAN JOURNAL OF PHYSICAL CHEMISTRY A
The microdoser consists of a stepper motor and a 5-mL glass syringe with a Teflon plunger secured to the movable panel of the motor and with a needle connected by a Teflon tube to the titrant receiver and to a conical capillary. The capillary is a set of decreasing cones. This design of the capillary allows the capillary diameter to be readily tuned to the physical properties of the medium. It was found experimentally that the optimum capillary diameter for investigation of processes in organic solvents is 0.2 mm. Use of thinner capillaries leads to an increase in the amount of energy released upon the introduction of a titrant dose because of the friction of the titrant on the capillary walls. An increase in the capillary diameter also seems inappropriate, for it will enhance the diffusion of the titrant and analyte. The stepper motor can be operated in the automatic and manual modes. In the automatic mode, the motor is turned on and off by sync pulses coming from the corresponding input. The dosing points in time and dosing duration are preset by software. The doser has a blocking device stopping the motor once a limiting position is reached. The doser was calibrated using double-distilled water. The vol-
Vol. 89
No. 4
2015
726
GUBAREV et al.
Table 1. Molar enthalpies of mixing of liquids ∆H of the solution, ∆H of the solution, J mol–1 J mol–1 [10]
x
0.0131 0.0181 0.0230 0.0280 0.0330 0.0024 0.0049 0.0097 0.0146 0.0194
Carbon tetrachloride–benzene 6.09 6.171 8.359 8.889 10.601 10.812 12.816 13.000 15.005 15.040 Cyclohexane–hexane 3.021 3.022 6.016 7.822 11.92 12.492 17.713 17.815 23.397 22.997
x is the mole fraction of the second component in the system.
Table 2. Experimental and calculated K3[Fe(C2O4)3] photolysis in Н2SO4
data
for
N(Fe2+), mol
Q, J
–∆H, kJ mol–1
4.60 × 10⁻⁶ 4.94 × 10⁻⁶ 4.64 × 10⁻⁶
0.2571 0.2626 0.2504
55.89 53.16 53.97 54.34 ± 2.1
ume of a unit dose at a temperature of 298.15 K and a microdoser step of h = 1 was 0.035 mL. Light Supply System The light supply system consists of a light source, an LM-4 monochromator, and optical waveguides. The waveguides conduct light into the cell either directly or through the monochromator. A waveguide (Fig. 3) consists of 60 optical fibers 200 μm in diameter divided into two parts for supplying light into both cells. The monochromator is involved using additional optical waveguides (Fig. 2b) in which the optical fibers are gathered in a rectangular connector for obtaining a 0.8-mm-wide optical slit. The waveguide connectors allow one to involve any light source suitable for the purpose of investigation. In order to supply broadband light into the calorimetric cell, a DKSSh-150 xenon lamp is commonly used, whose light is focused by a concave mirror (F = 200 mm). Between the mirror and the optical waveguide, there is a system of optical absorption filters for transmitting light in the desired wavelength interval. Light was monochromated with an LM-4 grating monochromator. When monochromatic light was used, secondary waves were suppressed with λ > 360 nm optical filters in the 360–550 nm range and
with λ > 550 nm ones in the 550–900 nm range. The optical flux intensity can also be increased by using LED sources of monochromatic radiation (UVTOP, ROITHNER LASERTECHNIK GmbH) and an ALOK-2M laser. Metrological characteristics of ADTPC: resolution limit of the calorimeter, 10–3 J with a reproducibility of 2 × 10⁻⁴ J or better; calorimeter constant, 0.0585 J/S2; short-duration noise level, ±5 rel. units; long-duration noise level, ±29 rel. units; measurement range, 65000 rel. units. In the determination of the metrological characteristics, we took into account IUPAC recommendations. The short-duration noise level was determined by recording the output signal over 60 s. The deviation from the average baseline was ±5 rel. units. The long-duration noise level was determined by averaging all output signal fluctuations over 10–20 h and was ±29 rel. units. This low noise level allows slow processes to be investigated. Certification Following IUPAC recommendations, we tested the calorimeter using the reaction between tris(hydroxymethyl)aminomethane (Fluka, 99.9%) and hydrochloric acid at 298.25 K as the standard reaction. A tris(hydroxymethyl)aminomethane solution (45 mL, 0.026 mol/L) was placed in the sample cell, and the solution was titrated with a hydrochloric acid solution (1.62 mol/L). Titration was stopped after the addition of 25–33 doses. The volume of one dose was 0.035 mL. The heat of the reaction, which was determined using a computer program like KALORY [9] with allowance made for the heat of dilution of the titrant, was –47.40 ± 0.25 kJ/mol. The ADTPC was additionally certified against heat of mixing data. For checking the measurement accuracy, we chose the carbon tetrachloride–benzene and cyclohexane–hexane binary systems (Table 1). All organic solvents used in this study were specialpurity grade. They were further purified by drying over molecular sieves 3 and 4 Å followed by fractional distillation. The water content of the solvents was determined by the Fischer method. The water content of benzene was 0.02%, and that of carbon tetrachloride was 0.01%. The heats of mixing measured for the liquids are in good agreement with the corresponding data available from the literature [10]. The photocalorimeter was certified using the potassium ferrioxalate photolysis reaction. For this purpose, 40 mL of a K3[Fe(C2O4)3] ⋅ 3H2O solution (0.006 mol/L) in 0.1 N Н2SO4 was placed in a calorimetric cell and was irradiated with monochromatic λ = 436 nm light for 10 min. The concentration of the Fe2+ ions that resulted from ferrioxalate photolysis was
RUSSIAN JOURNAL OF PHYSICAL CHEMISTRY A
Vol. 89
No. 4
2015
DEVELOPMENT AND CERTIFICATION OF AN AUTOMATED DIFFERENTIAL TITRATION
727
(a) 35(coupling)
118
24.5 A−A
20
822 15
A−A 15
(b)
150
20
A−A B−B
B−B 0.8
A−A
50 B−B
93
35
20
822 15 15
20 3
Fig. 3. Optical waveguides for (a) light supply from the source to the calorimetric cells and (b) for light supply from the source to the monochromator and from the monochromator to the calorimetric cells.
determined using an earlier reported procedure [11]. Figure 4 shows a typical calorimetric curve for K3[Fe(C2O4)3] photolysis. The enthalpy of photolysis of potassium ferrioxalate derived from these data (Table 2) is in good agreement with the literature (53.6 ± 2.9 kJ/mol) [12, 13]. The photocalorimeter was additionally certified using the trans-azobenzene–n-heptane system. A solution of trans-azobenzene (9.84 × 10⁻⁵ mol/L) in n-heptane was prepared for this purpose. The volume of the solution sample placed in the cell was 40 mL. The solution was irradiated with λ = 313 nm light for Table 3. Photocalorimetric data for trans-azobenzene isomerization in n-heptane (λ = 313 nm) N(cis), mol
Q, J
∆H, kJ mol–1
7.486 × 10⁻⁸ 7.515 × 10⁻⁸ 7.470 × 10⁻⁸
0.0035 0.0036 0.0033
46.75 47.9 44.18 46.28 ± 3.1
RUSSIAN JOURNAL OF PHYSICAL CHEMISTRY A
10 min. The following reaction occurred in the system under the action of light: N N N
hv
N (trans)
(cis)
The amount of cis isomer (Table 3) was calculated from the change in the absorbance of the solution at a wavelength of 250 nm [14]. The change of enthalpy obtained for this reaction is in good agreement with the literature (∆H = 48.9 ± 2.3 kJ/mol) [15]. Thus, we have developed and designed an automated differential photocalorimeter that provides means to determine thermodynamic characteristics of photoinduced processes. This instrument enables one to carry out a wide variety of physicochemical and photochemical studies. The instrument was certified against standard systems recommended by IUPAC. The experimental data obtained on the described cal-
Vol. 89
No. 4
2015
728
GUBAREV et al.
I, arb. units 37 000 (a)
(b)
36 000
35 000
34000
33 000
0
100
200
300
400 t, min
Fig. 4. Calorimetric curves recorded during the irradiation of (a) 0.1 N Н2SO4 and (b) a solution of K3[Fe(C2O4)3] ⋅ 3H2O (0.006 mol/L) in 0.1 N Н2SO4 with λ = 436 nm light.
orimeter are in good agreement with the literature, indicating the correct operation of the device. REFERENCES
2. Y. Harel and A. W. Adamson, J. Phys. Chem. 90, 6690 (1986). 3. Y. Harel and A. W. Adamson, J. Phys. Chem. 90, 6693 (1986). 4. M. G. Winkler, PhD Thesis (University of Regensburg, 1987). 5. P. McIlvaine and N. Langerman, Biophys. J. 17, 17 (1977). 6. M. F. Budyka, N. I. Potashova, T. N. Gavrishova, and V. M. Li, Ross. Nanotekhnol., Nos. 11–12, 89 (2007). 7. E. N. Ushakov, M. V. Alfimov, and S. P. Gromov, Russ. Chem. Rev. 77, 39 (2008). 8. N. S. Lebedeva, K. Mikhailovsky, and A. I. Vyugin, Russ. J. Phys. Chem. A 75, 1031 (2001). 9. B. N. Oleinik, Precision Calorimetry (Izd. Standartov, Moscow, 1973) [in Russian]. 10. V. P. Belousov, A. G. Morachevskii, and M. Yu. Pakov, Thermal Properties of Nonelectrolyte Solutions (Khimiya, Leningrad, 1981) [in Russian]. 11. H. J. Kuhn, S. E. Braslavsky, and R. Schmidt, Pure Appl. Chem. 76, 2105 (2004). 12. A. W. Adamson, A. Volger, H. Kunkely, et al., J. Am. Chem. Soc. 100, 4 (1978). 13. C. Teixeira and I. Wadso, J. Chem. Thermodyn. 22, 703 (1990). 14. M. Ya. Melnikov, Experimental Methods in High Enegry Chemistry, The Manual, Ed. by M. Ya. Melnikova (Mosk. Gos. Univ., Moscow, 2009) [in Russian]. 15. A. R. Dias, M. E. Minas da Piedade, et al., J. Chem. Thermodyn. 24, 439 (1992).
1. A. W. Adamson, A. Vogler, H. Kunkely, and R. J. Wachter, Am. Chem. Soc. 100, 1298 (1978).
RUSSIAN JOURNAL OF PHYSICAL CHEMISTRY A
Translated by D. Zvukov
Vol. 89
No. 4
2015