Genes & Genomics (2010) 32: 267-273 DOI 10.1007/s13258-010-0007-8
RESEARCH ARTICLE
Development and characterization of twenty-five new polymorphic microsatellite markers in proso millet (Panicum miliaceum L.) Young-Il Cho · Jong-Wook Chung · Gi-An Lee · Kyung-Ho Ma · Anupam Dixit · Jae-Gyun Gwag · Yong-Jin Park 1)
Received: 28 January 2010 / Accepted: 6 April 2010 / Published online: 30 June 2010 © The Genetics Society of Korea and Springer 2010
Abstract Millets such as proso millet have excellent nutritional properties and could become a basic resource for crop breeding programs and food diversification. In this study, 25 polymorphic microsatellite markers were developed and characterized through construction of an SSR-enriched library from genomic DNA of proso millet (Panicum miliaceum L.). In total,110 alleles were detected, with an average of 4.4 alleles per locus. Values of major allele frequency (MAF) and expected heterozygosity (HE) ranged from 0.36 to 0.98 (mean = 0.73) and from 0.04 to 0.74 (mean = 0.37), respectively. The mean genetic similarity coefficient was 0.3711, indicating that among 50 accessions of proso millet there was wide genetic variation. The newly developed microsatellite markers should be useful tools for assessing genetic diversity, understanding population structure, and breeding of proso millet.
Keywords Microsatellite markers; Panicum miliaceum L.; Proso millet; SSR-enriched library Introduction Panicum miliaceum L., an annual warm season grass generally Y.-I. Cho · J.-W. Chung · Y.-J. Park ( ) Department of Plant Resources, College of Industrial Science, Kongju National University, Yesan 340-702, Korea e-mail:
[email protected] G.-A. Lee · K.-H. Ma · J.-G. Gwag National Agrobiodiversity Center, National Institute of Agricultural Biotechnology, RDA, Seodun-Dong, Suwon 441-100, Korea A. Dixit Rice DNA and Quality Testing Laboratory, Basmati Export Development Foundation, SVBP University of Agriculture and Technology, Meerut 250110, India
known as proso, hog, broomcorn, white, hershey, yellow, or common millet, has a short growing period of about 10–11 weeks, requires little water, and is able to grow at a wide range of altitudes (Jana and Jan, 2006; Lágler et al., 2005). This crop is extensively cultivated in central Europe, Russia, China, India, and the Middle East (Martin et al., 1976). In the United States and Europe, grains of proso millet are used as bird and livestock feed, whereas they are used for human consumption in other countries (Jana and Jan, 2006). Proso millet is cultivated for its unique nutritional value, which is superior to that of the more common cereals, wheat, rice, and oats. Since it has a high alkaline content that counteracts acids, and a high protein content, it is also considered a health food (Chang, 1968; Geervani and Eggum, 1989). Simple sequence repeats (SSRs) have recently provided simple but powerful markers for several studies in diverse plant taxa (Li et al., 2003). SSRs, as DNA markers, have advantages over many other markers because they are abundant and highly polymorphic, co-dominantly inherited, analytically simple, and readily transferable (Weber, 1990). SSR markers are reported to be more variable than other markers such as RFLP or RAPD, and have been widely utilized in plant genomic studies (He et al., 2003). However, widespread use of these markers is often limited by the time and cost involved in their development, which requires DNA library construction, sequencing, identification of SSR-containing clones, and the design of primer pairs from flanking sequences of SSR motifs. Recent developments in library enrichment techniques and automated sequencing have simplified and sped up the development of these markers in a cost-effective manner (Zane et al., 2002). The development and characterization of SSR markers in foxtail millet (Jia et al., 2009), garlic (Ma et al., 2009), mung bean (Gwag et al., 2006), and sesame (Dixit et al., 2005) have recently been reported. Although some studies have developed DNAmarkers such as AFLP (Karam et al., 2004), RAPD (M’Ribu and Hilu, 1994),
268
and ISSR (Lágler et al., 2005) for Panicum millets, there is no information available regarding isolation of microsatellite sequences from the proso millet genome or the development of a microsatellite-based marker system for this crop. The present study details the development and characterization of 25 new polymorphic microsatellite markers that should serve as useful tools for assessment of genetic diversity and understanding of population structure in proso millet.
Materials and Methods Plant materials and DNA extraction For the present study, a total of 50 accessions of proso millet (Panicum miliaceum L.) were obtained from the Rural Development Administration (RDA) gene bank of the Republic of Korea (http://genebank.rda.go.kr) (Table 1). These accessions were from six countries (15 origins): Mongolia, Republic of Korea, Russia, India, Italy, and Uzbekistan. The seeds of each accession were cultivated in a glass greenhouse, and DNA was extracted from fresh leaves of 15-day-old seedlings using the Qiagen DNA extraction kit (Qiagen, Hilden, Germany). The relative purity and concentration of extracted DNA was estimated with NanoDrop ND-1000 (NanoDrop Technologies Inc., Wilmington, DE, USA). The final concentration of each DNA sample was adjusted to 20ng/μl. Construction of an SSR-enriched library We constructed an SSR-enriched library from genomic DNA of proso millet using a modified biotin-streptavidin capture method (Dixit et al., 2005). Briefly, total DNA was digested with seven restriction enzymes, EcoRV, DraI, SmaI, PvuI, AluI, HaeIII, and RsaI, in separate reactions. After being pooling together, the digested DNA was size-fractionated on a 1.4% agarose gel. Fragments ranging from 300 to 1500 bp were eluted from the gel, followed by purification using a gel extraction kit (Qiagen). DNA fragments were ligated to an adaptor (AP11-5'-CTCTTGCTTAGATCTGGACTA-3' and AP12-5'-TAGTCCAGATCTAAGCAAGAGCACA-3'). The adaptor-ligated DNA was hybridized with a mixture of biotin-labeled SSR probes [(GA)20, (CA)20, (AGC)15, (GGC)15, (AAG)15, (AAC)15, (AGG)15]. The hybridized DNA fragments were captured with streptavidin-coated magnetic beads. After stringent washings, the captured DNA fragments were eluted in 50 l distilled water. Final eluates were amplified with the AP11 primer and cloned into the pGEM-T easy vector (Promega, Madison, WI, USA).
Genes & Genomics (2010) 32:267-273
DNA sequencing and design of SSR primers White colonies were randomly picked from the primary transformation plates. Plasmid DNA was isolated using the QIAprep Spin Miniprep kit (Qiagen) and sequenced on an ABI 3100 DNA sequencer with a BigDye terminator kit (Applied Biosystems, Foster City, CA, USA). Identification of SSR clones, redundancy checking, and design of primer pairs was performed using the SSR Manager Program (Kim, 2004). For all types of microsatellites, a minimum length criterion of 12 bp was selected, and only perfect microsatellites were considered. Primer pairs were designed from the flanking sequences of SSRs and evaluated for polymorphisms in a panel of 10 accessions of Italian millet using a previously described procedure (Dixit et al., 2005). The size of polymorphic polymerase chain reaction (PCR) products was measured accurately following the M13 tail PCR method of Schuelke (2000). Amplification reactions were carried out in a total volume of 20 μl, containing 200 ng template DNA, 1×PCR buffer, 0.2 mM of each dNTP, 1U Taq DNA polymerase, 8 pmol of each reverse and fluorescent-labeled M13 (-21) primer, and 2 pmol of the forward primer with the M13 (-21) tail at its 5’ end. Conditions of the PCR amplification were as follow: 94 ℃ for 3 min, then 30 cycles each at 94 ℃ for 30 sec, 55 ℃ for 45 sec, and 72 ℃ for 1 min, followed by 10 cycles at 94 ℃ for 30 sec, 53 ℃ for 45 sec, and 72 ℃ for 1 min, and a final extension at 72 ℃ for 10 min. SSR alleles were resolved on an ABI-PRISM 3100 DNA sequencer (Applied Biosystems) using GENESCAN 3.7 software, and sized precisely against 6-carboxy-X-rhodamine (ROX) molecular size standards using GENOTYPER 3.7 software (Applied Biosystems). Data analysis Basic statistics, including total number of alleles, allele frequency, accession-specific alleles, major allele frequency (MAF), and polymorphic information content (PIC), were calculated from shared allele frequencies using PowerMarker V3.23 (Liu and Muse, 2005). The variability at each locus was measured in terms of number of alleles, observed heterozygosity (HO), expected heterozygosity (HE), and genetic distance between each pair of accessions using the genetic analysis package POPGENE version 1.31 (Yeh et al., 1999). The UPGMA algorithm was used to construct an unrooted phylogram from a distance matrix using MEGA4 software (Tamura et al., 2007).
Genes & Genomics (2010) 32:267-273
269
Table 1. Details of the 50 accessions of proso millet (Panicum miliaceum L.) used in the present study. a
Accession IT. No. Variety name Source of Donor b Origin History b No. (or place of collection) introduction Country (Temp. No.) (803157) research center PM-01 MNG MNG PM-02 (803684) UKR research center MNG Kharikovskoe 65 PM-03 (803693) HUN research center MNG (803701) research center PM-04 KAZ MNG PM-05 (803702) CSK research center MNG Unikum PM-06 103463 KOR landrace farm KOR GangwonMyeongju 103301 landrace farm PM-07 KOR KOR GangwonSamcheok PM-08 (K015760) PRK research center RUS PM-09 (K015761) PRK research center RUS (K029746) bred research center PM-10 PRK RUS KURYNKIZAN PM-11 (K011708) KOR landrace farm KOR GangwonYanggu PM-12 (K011642) KOR landrace farm KOR GangwonYangyang 185516 landrace farm PM-13 KOR KOR GangwonWonju PM-14 185523 KOR landrace farm KOR GangwonInje PM-15 033463 KOR landrace farm KOR GangwonJeongseon (K016560) landrace farm PM-16 KOR KOR GangwonCheorwon PM-17 185519 KOR landrace farm KOR GangwonChunseong PM-18 123924 KOR landrace farm KOR GangwonPyeongchang 100298 landrace farm PM-19 KOR KOR GyeonggiGapyeong PM-20 033474 KOR landrace farm KOR GyeonggiHwaseong PM-21 180613 KOR landrace farm KOR GyeongnamGeochang 033449 landrace farm PM-22 KOR KOR GyeongbukMungyeong PM-23 100312 KOR landrace farm KOR GyeongbukBonghwa PM-24 100283 KOR landrace farm KOR GyeongbukAndong 185538 landrace fram PM-25 KOR KOR GyeongbukYeongdek PM-26 123964 KOR landrace farm KOR GyeongbukUljin PM-27 123992 IND IND 123996 PM-28 IND IND PM-29 124012 IND IND PM-30 124027 IND IND research center 137670 THA ITA PM-31 137674 THA research center ITA PM-32 PM-33 153512 RUS research center IND 153518 research center PM-34 RUS IND PM-35 153528 RUS research center IND PM-36 153532 RUS research center IND 197005 research center PM-37 MNG MNG Local PM-38 197019 UKR research center MNG Conuerhoe PM-39 197022 UKR research center MNG Kormovoe-2 197026 research center PM-40 MNG MNG Typracinau PM-41 199330 CHN research center RUS Local PM-42 199331 CHN research center RUS Local 199332 research center PM-43 CHN RUS Local PM-44 199344 UKR research center RUS Veselopodel lanskoe 403 PM-45 199346 FRA research center RUS Tonkoplenchatoe 199347 research center PM-46 AZE RUS Local PM-47 199348 UZB research center RUS Local PM-48 199349 TJK research center RUS Local 204184 PM-49 MNG MNG PM-50 208540 UZB landrace market UZB a Number from the Rural Development Administration (RDA) gene bank of the Republic of Korea. b MNG, Mongolia; UKR, Ukraine; HUN, Hungary; KAZ, Kazakhstan; CSK, former Czechoslovakia; KOR, Republic of Korea; PRK, People’s Republic of Korea; IND, India; THA, Thailand; RUS, Russia; CHN, China; FRA, France; AZE, Azerbaijan; USB, Uzbekistan; TJK, Tajikistan; ITA, Italy.
270
Genes & Genomics (2010) 32:267-273
Results SSR development A library enriched for several di- and tri-nucleotide SSRs was constructed from the genomic DNA of proso millet. Developmental steps for the construction of the enriched library and its characteristic features are summarized in Table 2. A total of 504 putative recombinant clones (white colonies) were picked from the enriched library, sequenced, and analyzed for presence of SSRs. Sequence analysis revealed that 24 clones (4.76%) were redundant clones. Of the remaining 480 unique clones (95.24%), 157 (32.7% of the unique clones) were found to harbor SSR sequences. Sequence analysis of all the SSR-containing clones identified a total of 215 different repeat motifs. Tri-nucleotide SSRs were found to be more frequent (53.02%) than di-nucleotide SSRs (37.21%) (Table 3). Furthermore, a low number (9.75%) of tetra/penta/hexa nucleotide SSRs was also identified in the library. Among di-nucleotide SSRs, the AG/GAclass of repeat motif was the most frequent (52.5% of total di-nucleotide microsatellites), followed by the AC/CA class (42.50%). Among tri-nucleotide SSRs, the AGC/GCA/CAG class of repeat motifs was predominant (39.47%), followed by the AGG/GGA/GAG (18.42%) and CCG/CGC/GCC classes (14.04%). A total of 143 primer pairs could be designed from flanking sequences of different repeat motifs, and screened for polymorphism. Of these, 25 primer pairs produced very distinct and reproducible polymorphic bands and were therefore selected for further studies. SSR polymorphism The variability at each SSR locus was measured in terms of the number of alleles and expected heterozygosity. All 25 SSR loci were found to be polymorphic, and a total of 110 alleles were detected among 50 accessions. The number of detected alleles varied between two (GB-PMM-029, GB-PMM-031, GB-PMM-060, GB-PMM-117, and GB-PMM-145) and 11 (GB-PMM-134), with an average of 4.4 alleles per locus (Table 4). Of the 25 polymorphic loci, 20 were composed of perfect
repeats of di- or tri-nucleotide SSRs and four included imperfect SSRs (interrupted with non-repeat sequence). One locus (GB-PMM-060) was found to be composed of a perfect tetra-nucleotide SSR. Four loci (GB-PMM-073, GB-PMM-094, GB-PMM-111, and GB-PMM-133) were composed of multiple repeats (more than one SSR), and three loci (GB-PMM-004, GB-PMM-121, and GB-PMM-126) possessed compound repeats (SSRs composed of different repeat motifs) (Table 4). The values for expected heterozygosity (HE) or gene diversity ranged between 0.04 (GB-PMM-029, GB-PMM-031, GB-PMM-60, GB-PMM-117, and GB-PMM-145) and 0.74 (GB-PMM-126 and GB-PMM-134), with an average of 0.37 for all the loci studied. Values of polymorphism information content (PIC) and major allele frequency ranged between 0.04 (GB-PMM-029, GB-PMM-031, GB-PMM-60, GB-PMM-117, and GB-PMM-145) and 0.70 (GB-PMM-134), with an average of 0.33, and between 0.36 (GB-PMM-126) and 0.98 (GBPMM-029, GB-PMM-031, GB-PMM-60, GB-PMM-117, and GB-PMM-145) with an average of 0.73, respectively. All these loci deviated from Hardy–Weinberg equilibrium (HWE) at the significance threshold (P < 0.05). No clear correlation was evident between expected heterozygosity (HE) values and number of alleles or repeat units (Table 4). Phylogentic relationships The proportion of shared alleles was used to calculate genetic distances between all pairwise combinations among 50 ac Table 3. Identified microsatellite sequences in the enriched library for proso millet. Repeat unit Di-nucleotide
Number and Percentage 504 24 (4.76%) 480 (95.24%) 157 (32.71%) 143 25
Number
(%)
AC/CA AG/GA AT/TA GC/CG
34 42 2 2 80
42.50 52.50 2.50 2.50 37.21
AAC/ACA/CAA AAG/AGA/GAA AAT/ATA/TAA ACC/CCA/CAC ACG/CGA/GAC ACT/CTA/TAC AGC/GCA/CAG AGG/GGA/GAG ATC/TCA/CAT CCG/CGC/GCC
6 3 1 8 8 4 45 21 2 16 114 21
5.26 2.63 0.88 7.02 7.02 3.51 39.47 18.42 1.75 14.04 53.02 9.76
Total Tri-nucleotide
Table 2. Screening steps in the construction and characteristic features of the microsatellite-enriched library for proso millet. Screening step Sequenced clones Redundant clones Unique clones SSR clones Primer design Polymorphic markers
Repeat class
Total Others (Tetra/Penta/Hexa) Total repeat motifs
215
EF117735 CAGCCCATCACACTCGAT
EF117736 AAGAGCGAGGGCTAGCAT
GB-PMM-085
GB-PMM-094
EF117747 CAGGCTCTGGCAAAGATG
EF117748 TCCAAGAGCAGCACGG
GB-PMM-134
GB-PMM-145
Mean
EF117746 TCTCAGTGCTTTACGCCG
GB-PMM-133
GB-PMM-117
EF117744 GGACATACGCATGGTGGT
EF117743 GTGAGGGTGATCACGAGG
GB-PMM-115
EF117745 CTTCCATAGGGTGCCTCC
EF117742 GCACGTCACACTCACACG
GB-PMM-111
GB-PMM-126
EF117741 GTTCGAGGCTGATGCAAG
GB-PMM-107
GB-PMM-121
EF117739 AGCGAGAGGAAACAGCGT
EF117740 CTCAGCTCGCCCCTTATT
GB-PMM-106
AGACGTCGTGCCAAGAGA
CAAGGTCAGGGGAACCAT
AGGAACCGGAACCACCTA
CATCGCAATTGGGAAAGA
ACGATCGAATGAGCGAGA
CCACGCCAAACTCAAATC
TGGGTGTATCAGGGCTTG
CGCATCACACGTCACATC
GCACCGGAATATGCAAGA
ATAGGCGTCGGAGATGGT
CATCTCTTCGCTGTCCCA
GCGTTCGGAACAACTGAA
CGGCAGCAACTCATCAAT
CTTCTTCGTCGTCCCTCC
CGCATTCTCTTCCCCTTT
TCGATCTCGGTCTGCTGT
AATGAGGCACTGACAGCC
(CAG)3(TAG)(CAG)2
(AG)22
(GAG)6, (AGG)6
(GAA)5-(GA)20
(AT)7- (GTAT)9
(GA)6
(AG)15
(AG)6, (AG)5
(GA)6
(TC)19
(CTG)6
(GCC)6
(AT)4, (GCG)4
(AGG)3(AGC)(AGG)2
(TC)21, (CGTG)4
(TGC)6
(CTC)6
(AGTC)4
(TGC)3(TGA)(TGC)2
(CGA)5
(CA)10
(GA)19
(CGT)3(CAT)(CGT)5
(TCG)8
55
55
55
55
55
58
55
55
55
58
55
55
55
55
55
58
55
55
55
53
55
55
55
55
55
a
TA (°C) b
4.4
2
11
4
8
6
2
6
3
3
6
4
3
3
7
9
3
4
2
2
2
3
7
4
4
3
NA
194 - 197
241 - 267
224 - 299
128 - 272
212 - 282
292 - 316
259 - 279
269 - 291
224 - 258
218 - 240
193 - 236
117 - 188
106 - 228
238 - 265
275 - 311
225 - 231
263 - 292
183 - 188
174 - 180
190 - 214
188 - 192
219 - 231
278 - 302
234 - 256
200 - 204
Size range (bp)
0.00
0.00
0.00
0.00
0.00
0.00
0.00
0.00
0.00
0.00
0.00
0.00
0.00
0.00
0.00
0.00
0.00
0.00
0.00
0.00
0.00
0.00
0.00
0.00
0.00
0.00
c
HO
d
0.37
0.04
0.74
0.22
0.74
0.65
0.04
0.70
0.15
0.25
0.46
0.46
0.30
0.52
0.70
0.66
0.35
0.54
0.04
0.04
0.04
0.22
0.69
0.15
0.15
0.25
HE
0.73
0.98
0.47
0.88
0.36
0.46
0.98
0.39
0.92
0.86
0.72
0.68
0.82
0.54
0.50
0.53
0.78
0.49
0.98
0.98
0.98
0.88
0.49
0.92
0.92
0.86
e
MAF
0.33
0.04
0.70
0.21
0.69
0.58
0.04
0.64
0.14
0.22
0.44
0.39
0.27
0.40
0.66
0.62
0.30
0.43
0.04
0.04
0.04
0.21
0.65
0.15
0.15
0.22
f
PIC
TA, Annealing temperature bNA, Number of alleles; cHO, Observed heterozygosity; dHE , Expected heterozygosity; eMAF, Major allele frequency; fPIC, Polymorphism information conten
a
EF117734 GCTCTCACCGTCTGATCG
EF117737 GGCCTATGGGCTTTTTGT
EF117733 TAATGCCAAACCAAGCGT
GB-PMM-066
GB-PMM-073
EF117738 TGCCAGGCACTACACCAT
EF117732 CTCCGCAGCAAGACATTT
GB-PMM-061
GB-PMM-098
GGTACAAGTACAAGCCCGC
EF117731 TCGTGACAGAGCGTCCTT
GB-PMM-060
GB-PMM-096
TTTCGATCCGAGGAGGAT
EF117730 AAACGGGATCGGTGTAGC
GB-PMM-031
AATGTGGTTGGCATTGGA CTTGCTGTCGTCGTCCTC
EF117728 CTTGTGCTGGGCTAGGTG
GATGCGTACCGCTTGTGT
TACAGGTCCTGCGTGAGG
EF117729 AGCTCCTGGCTCAGCTCT
EF117727 GCTAGCTTGTTGTTGCCG
GB-PMM-023
ATAGTGATCGCGACCGTG
GB-PMM-029
EF117726 GGGAGACGCAGTGTGGTA
GB-PMM-014
Repeated motif TGGTGTCAGGAACATTAAGGA (TG)8-(GA)9
fReverse
GB-PMM-025
EF117724 GCAAGAGCGTGTGTGTGA
EF117725 AGGGGTAGGGCTGATGAA
GB-PMM-013
Forward
Primer sequence
GB-PMM-004
GenBank accession no.
Locus name
Table 4. General characteristics of the 25 new polymorphic markers developed for proso millet.
272
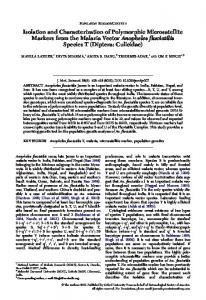
Figure 1. UPGMA dendrogram showing genetic relationships among 50 accessions of proso millet.
cessions used in this study. The genetic distance matrix generated by PowerMarker was utilized to construct a UPGMA tree using Mega4 software (Tamura et al., 2007).The similarity coefficients among the 50 proso millet accessions ranged from 0 to 1.0. The wide variation in genetic similarity among the different accessions revealed by SSRs reflected a high level of polymorphism at the DNA level (data not shown). The resulting dendrogram (Fig. 1) shows a complex distribution pattern of accessions at a genetic distance of 0.37. All 50 accessions could be clustered into four groups. Among four accessions collected from India, three were clustered into Group I, and the fourth clustered into Group III. Group II included three accessions of different origin (one each from Mongolia, Russia, and Ukraine). Group III included 18 accessions from the Republic of Korea and three of other origin (one each from the People’s Republic of Korea, China, and India). All accessions from the Republic of Korea clustered into mixed subgroups in Group III. A total of 22 accessions of various origins clustered into Group IV.
Discussion Proso millet as one of the most ancient cereal and drought-resistant crop with extremely short ripening time is the lowest water requirement of any grain crops (Lágler et al., 2005). This crop is not only as an alternative crop, or a fodder crop, but
Genes & Genomics (2010) 32:267-273
also cultivated for its unique nutritional value which is superior to main cereals such as wheat and rice. Also, it has high alkaline content which counteracts acids, and high protein content, it is utilized as health food (Chang,1968; Geervani and Eggum, 1989; Jana and Jan, 2006). Therefore, this crop as a source of crop breeding program has a high availability. The work described in this paper is the first reported development of polymorphic SSR markers from an enriched library of genomic DNA of proso millet. Characterization of SSR-containing clones in the enriched library with reference to relative abundance of various repeat motifs revealed predominance of tri-nucleotide SSR (53.02%) over di-nucleotide SSR (37.21%). This is a feature common to other plant genomes, as several recent surveys on distribution patterns of various SSRs in genomic sequences of several plant species, including Arabidopsis (Morgante et al., 2002), foxtail millet (Jia et al., 2009), garlic (Ma et al., 2009), ginseng (Ma et al., 2007), Italian millet [our unpublished results], Medicago, Lotus, and Glycine (Mun et al., 2006), mung bean (Gwag et al., 2006), rice (Goff et al., 2005), and sesame (Dixit et al., 2005), have indicated that tri-nucleotide repeats are the most common type of SSR in plants. Occurrence of the AG/GA class of repeat motif among di-nucleotide repeats is consistent with reports from other plant species (Langercrantz et al., 1993; Morgante and Oliveiri, 1993; Powell et al., 1996, our unpublished results). Among tri-nucleotide repeats, the AGC/GCA/CAG class was the most frequent, followed by the AGG/GGA/GAG and CCG/CGC/GCC classes, in contrast to the general notion that the CCG/CGC/GCC class is predominant in cereal genomes (Rota et al.,2005; Varshney et al., 2002; Kantety et al., 2002). The designed 143 primer pairs from flanking sequences of different repeat motifs were screened for polymorphism. Of these, 25 polymorphic SSR primers produced very distinct and reproducible polymorphic bands. This result is higher polymorphic rate (17.5%) as compared with previous reports of other plants, including garlic (Ma et al., 2009) and sesame (Dixit et al., 2005). The 25 SSRs developed in the present work were successfully utilized to develop phylogenetic relationships within a world germplasm collection of 50 landraces from various countries. The SSR markers were highly polymorphic, producing a total of 110 alleles with an average of 4.4 alleles per locus and a mean value of expected heterozygosity (HE) or gene diversity of 0.37 for all loci. Thus, the SSR markers among the 50 proso millet accessions in the present study were effective for assessing genetic diversity and understanding population structure. All 50 accessions collected from different countries (15 origins) could be clustered into four groups (Fig. 1). Each group was composed of accessionsfrom a variety of origins, excluding Group I. In Group III, 18 accessions from the Republic of Korea were
Genes & Genomics (2010) 32:267-273
mixed into several subgroups with three Asian accessions, one each from the People’s Republic of Korea, China, and India. A total of 22 accessions originating from several countries dominated in Group IV, possibly as a result of similar natural or human selection within regions or seed movement and gene flow. The Asian genotypes showed more genetic affinity with each other than with the European types (M’Ribu and Hilu, 1994). Only one Hungarian accession (HUN 6) appeared ungrouped, and may have been from a smaller sample or had a different domestication region than the others. The information provided in this paper will be valuable for developing breeding programs for proso millet. Acknowledgements This study was supported by the Bio-Green 21 program (Grant no. 20080401034058) of Rural Development Administration (RDA) of the Republic of Korea.
References Chang K (1968) Archeology of ancient China. Science 162: 519-526. Dixit A, Jin MH, Chung JW, Yu JW, Chung HK, Ma KH, Park YJ and Cho EG (2005) Development of polymorphic microsatellite markers in sesame (Sesamum indicum L.). Mol. Ecol. Notes 5: 736-738. Geervani P and Eggum BO (1989) Nutrient composition and protein quality of minor millets. Plant Foods for Human Nutrit. 39: 201-208. Gwag JG, Chung JW, Chung HK, Lee JH, Ma KH, Dixit A, Park YJ, Cho EG, Kim TS and Lee SH (2006) Characterization of new microsatellite markers in mung bean, Vigna radiata (L.). Mol. Ecol. Notes 6: 1132-1134. Goff SA, Ricke D, Lan TH, Presting G, Wang R, Dunn M, Glazebrook J, Sessions A, Oeller P and Varma Het al. (2005) A draft sequence of the rice genome (Oryza sativa L. ssp. japonica). Science 296: 92-100. He GH, Meng RH, Newman M, Gao GQ, Pittman RN and Prakash CS (2003) Microsatellites as DNA markers in cultivated peanut. BMC Plant Biol. 3: 3-11. Jana K and Jan M (2006) Content and quality of protein in proso millet (Panicum miliaceum L.) varieties. Plant Foods for Human Nutrition 61: 45-49. Jia XP, Zhang ZB, Liu YH, Zhang CW, Shi YS, Song YC, Wang TY and Li Y (2009) Development and genetic mapping of SSR markers in foxtail millet [Setaria italica (L.) P. Beauv.]. Theor. Appl. Genet. 118: 821-829. Kantety RV, Rota ML, Matthews DE and Sorrells ME (2002) Data mining for simple sequence repeats in expressed sequence tags from barley, maize, rice, sorghum and wheat. Plant Mol. Biol. 48: 501-510. Karam D, Westra P, Nissen SJ, Ward SM and Figueiredo JEF (2004) Genetic diversity among proso millet (Panicum miliaceum) biotypes assessed by AFLP technique. Planta Daninha 22: 167-174. Kim KY (2004) Developing one-step program (SSR Manager) for rapid identification of clones with SSRs and primer designing. MS thesis, Seoul National University, Seoul, the Republic of Korea.
273 Lagercrantz U, Ellegren H and Andersson L (1993) The abundance of various polymorphic SSR motifs differs between plants and vertebrates. Nucl. Acids. Res. 21: 1111-1115. Lágler R, Gyulai G, Humphreys M, Szabó Z, Horváth L, Bittsánszky A, Kiss J, Holly L and Heszky L (2005) Morphological and molecular analysis of common millet (P. miliaceum) cultivars compared to a DNA sample from the 15th century (Hungary). Euphytica 146: 77-85. Liu KJ and Muse SV (2005) PowerMarker: an integrated analysis environment for genetic marker analysis. Bioinformatics 21: 2128-2129. Li ZK, Yu SB, Lafitte HR, Huang L, Courtois B, Hittalmani S, Vijayakumar CHM, Liu GF, Wang GC and Shashidhar HE et al. (2003) QTL×environment interactions in rice. I. Heading date and plant height. Theor. Appl. Genet. 108: 141-153. Ma KH, Dixit A, Kim YC, Lee DY, Kim TS, Cho EG and Park YJ (2007) Development and characterization of new microsatellite markers for ginseng (Panax ginseng C. A. Meyer). Conserv. Genet. 8: 1507-1509. Ma KH, Gwag JG, Zhao WG, Dixit A, Lee GA, Kim HH, Chung IM, Kim NS, Lee JS and Ji JJ et al. (2009) Isolation and characteristics of eight novel polymorphic microsatellite loci fromthe genome of garlic (Allium sativum L.). Scien. Hort. 122: 355-361. Martin JH, Leonard WH and Stamp DL (1976) Principles of field crop production, 3rd edition. MacMillan Publishing Co., Inc., New York, pp. 415-429. Morgante M, Hanafey M and Powell W (2002) Microsatellites are preferentially associated with nonrepetitive DNA in plant genomes. Nat. Genet. 30: 194-200. Morgante M and Olivieri AM (1993) PCR-amplified SSRs as markers in plant genetics. Plant J. 3: 175-182. M’Ribu HK and Hilu KW (1994) Detection of interspecific and intraspecific variation in Panicum millets through random amplified polymorphic DNA. Theor. Appl. Genet. 88: 412-416. Mun KH, Kim DJ, Choi HK, Gish J, Debelle F, Mudge J, Denny R, Endre G, Saurat O and Dudez AM et al. (2006) Distribution of SSRs in the genome of Medicago truncatula: aresource of genetic markers that integrate genetic and physical maps. Genetics 172: 2541-2555. Powell W, Machray GC and Provan J (1996) Polymorphism revealed by simple sequence repeats. Trends Plant Sci. 1: 215-222. Rota ML, Kantety RV, Yu JK and Sorrells ME (2005) Nonrandom distribution and frequencies of genomic and EST-derived SSR markers in rice, wheat, and barley. BMC Genomics 6: 23. Schuelke M (2000) An economic method for the fluorescent labeling of PCR fragments. Nat. Biotech. 18: 233-234. Tamura K, Dudley J, Nei M and Kumar S (2007) MEGA4: molecular evolutionary genetics analysis (MEGA) software version 4.0. Mol. Biol. Evol. 24: 1596-1599. Varshney RK, Thiel T, Stein N, Langridge P and Graner A (2002) In silico analysis on frequency and distribution of SSRs in ESTs of some cereal species. Cell Mol. Biol. Lett. 7: 537-546. Weber JL (1990) Informativeness of human (dC-dA)n (dG-dT)n polymorphism. Genomics 7: 524-530. Yeh FC, Yang RC and Boyle T (1999) POPGENE Version 1.31. Microsoft Windows-based freeware for population genetic analysis. Quick User Guide. University of Alberta and Centre for International Forestry Research, Alberta, Canada, pp. 1-28. Zane L, Bargelloni L and Patarnello T (2002) Strategies for microsatellite isolation: a review. Mol. Ecol. 11: 1-16.