with dedicated FPGA (Field Programmable Gate Array): this flexible scheme allows to .... each), each hosting 16 input channels equipped with 10-bit flash-ADCs at 100 .... method, while the offline analysis, aiming at the best possible resolution ...
1
Development and commissioning of the Timing Counter for the MEG Experiment
arXiv:1112.0110v2 [physics.ins-det] 4 Feb 2012
M. De Gerone, S. Dussoni, K. Fratini, F. Gatti, R. Valle, G. Boca, P. W. Cattaneo, R.Nard`o, M. Rossella, L. Galli, M. Grassi, D. Nicol`o, Y. Uchiyama, D. Zanello
Abstract—The Timing Counter of the MEG (Mu to Electron Gamma) experiment is designed to deliver trigger information and to accurately measure the timing of the e+ in searching for the decay µ+ → e+ γ. It is part of a magnetic spectrometer with the µ+ decay target in the center. It consists of two sectors upstream and downstream the target, each one with two layers: the inner one made with scintillating fibers read out by APDs for trigger and track reconstruction, the outer one consisting in scintillating bars read out by PMTs for trigger and time measurement. The design criteria, the obtained performances and the commissioning of the detector are presented herein. Index Terms—Timing Counter, scintillator counter, high resolution timing detector.
I. I NTRODUCTION
I
N the Minimal Standard Model (SM) the Lepton Flavor mν 2 Violating (LFV) decays are proportional to ( M ) , (where W mν is the neutrino mass and mW the W boson mass) so that the predicted LFV Branching Ratios (BR) are negligible (< 10−40 ). On the other hand most theories proposed as SM extensions (e.g. SUSY) predict much larger LFV BRs. In [1] the BR(µ+ → e+ γ) is predicted in the range 10−12 − 10−14 that is accessible by a high precision experiment, like MEG (Mu to Electron and Gamma) [2], [3]. Observation of this decay would be a definitive proof of new physics beyond the Standard Model. The aim of MEG is to measure this BR down to a few times 10−13 improving the current limit of 1.2 × 10⁻¹¹ estimated by the MEGA collaboration [4]. II. E VENT SIGNATURE , BACKGROUND AND EXPERIMENTAL APPARATUS
The basic requirement for the MEG experiment is an intense source of µ+ , like the one currently available at the Paul Scherrer Institute in Villigen (CH), capable of delivering up to 108 µ+ /s in DC mode [5]. The µ+ s are stopped in a thin target M. De Gerone, S. Dussoni, K. Fratini, F. Gatti, R. Valle are with the INFN and University of Genova, Via Dodecaneso 33, I-16146 Genova, Italy P. W. Cattaneo, M. Rossella are with the INFN of Pavia, Via A. Bassi 6, I-27100, Italy G. Boca, R.Nard`o are with the INFN and University of Pavia, Via A. Bassi 6, I-27100, Italy L. Galli, M. Grassi, are with the INFN of Pisa, Largo B. Pontecorvo 3, I-56127 Pisa, Italy D. Nicol`o is with the INFN and University of Pisa, Largo B. Pontecorvo 3, I-56127 Pisa, Italy Y. Uchiyama is with ICEPP, The University of Tokyo, 7-3-1 Hongo, Bunkyo-ku, Tokyo 113-0033, Japan D. Zanello is with the INFN of Roma, P.le A. Moro 2, I-00185 Roma, Italy
inside a magnetic spectrometer and decay at rest, hence the µ+ → e+ γ signature is given by the two-body kinematic, with one photon and one positron simultaneously emitted backto-back with the same momentum, 52.83 MeV/c ≈ mµ+ /2. The recognition of the µ+ → e+ γ relies on the precise measurement of the kinematic variables that identify the event: the e+ and the γ energy and the relative emission angle and timing. The major challenge is given by the high µ+ stopping rate required to collect enough statistic in a reasonable time interval, resulting in a large background that has to be carefully identified and rejected. There are two major sources of background, in which a positron and a photon can fake a true µ+ → e+ γ event: the physical or prompt background originating from radiative decay µ+ → e+ ν ν¯γ with the neutrinos carrying small energy, and the accidental background arising from coincidences between a high energy e+ from Michel decay µ+ → e+ ν ν¯ and a high energy photon from other sources like radiative decay, positron annihilation in flight or bremsstrahlung. In the former background source, the time of the e+ and the photon at the decay vertex are coincident as for the signal, hence the relative timing is not a variable resolving signal from this background. In order to minimize the background on the experiment, a detector with excellent spatial, timing and energy resolutions is required, as proposed in [6] (all values quoted are Full Width at Half Maximum, FWHM): • • • • •
Photon energy: 4%; Positron energy: 0.7−0.9%; Single particle timing (equal for photon and positron): 100 ps; Photon-Positron relative timing: 150 ps; Photon-Positron relative angle: 17 − 21 mrad.
With these performances and the needed µ stop rate (107 − 108 µ/s) the rate of accidental background is dominant with respect to the prompt one; in this scenario a high timing resolution helps in rejecting fake events. Overall background rate is evaluated to be ∼ 3 × 10⁻¹⁴ under these conditions. µ+ decays occur in a 205 µm thick polyethylene target placed at the center of a quasi solenoidal magnetic field provided by the COnstant Bending Radius (COBRA) magnet [7]. Positrons are at first tracked by a set of Drift CHambers (DCH), and then impinge on the Timing Counter (TC) [8] that provides position and high resolution time information [9]. A schematic drawing of the detector is shown in Fig. 1 and in Fig.2.
2
Fig. 1. Schematic sectional view of the MEG experiment displaying the main components.
side the magnet, containing ∼ 900 liter of liquid Xenon whose scintillation light is read by 846 Photomultipliers (PMTs). The geometrical acceptance of the LXEC covers approximately the solid angle delimited in azimuth by 120◦ < φ < 240◦ and | cos Θ| < 0.35 for µ+ decaying at the center of the target. Most of the detector signals are digitized by fast ADCs based on the Domino Ring Sampler (DRS) chip: the longitudinal TC and the LXEC sampling frequencies are set at 1.6 GHz to preserve the time information. The slower signals from the DCH are digitized at 800 MHz [11]. The DRS incorporates on a single chip an innovative circular sample-and-hold to continuously sample the signals. When a trigger is fired the sampled waveforms are digitized and stored. The trigger system digitizes signals from all detectors using a set of 100 MHz, 10-bit flash ADCs and process them with dedicated FPGA (Field Programmable Gate Array): this flexible scheme allows to implement many decision algorithms to quickly select interesting events. The one dedicated to candidate µ+ → e+ γ events is based on fast time and direction information provided by the longitudinal TC and LXEC PMTs. A set of calibrations have been developed for each detector to correct for time offsets, space misalignment and energy scale. In the following chapter the TC design and calibrations will be described in detail, with a summary of the performances during last year run.
Fig. 2. event.
3D view of the MEG experiment with a reconstructed candidate
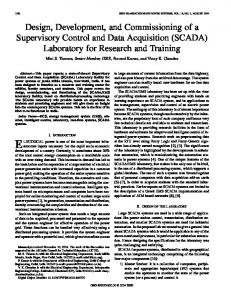
The particular configuration of the COBRA field enables the e+ bending radius, projected onto the plane transverse to the z axis 1 , to be mainly determined by the total momentum with only a mild dependency on its polar emission angle (Θ). This principle defines an energy threshold for positrons to impinge on the TC thus strongly reducing the detector occupancy and the trigger rate from positrons out of the signal region. Fig.3 shows that the threshold effect is somehow blurred by the spread in the decay points in the target and the secondary interactions in the detector material, leading to lower energy positrons passing the cut and contributing to detector crowding. Nevertheless the positron TC efficiency drops of a factor 2 (10) for positrons ∼ 5.0 MeV (∼ 10.0 MeV) below the signal energy. Photon energy, timing and direction are reconstructed in the Liquid XEnon Calorimeter (LXEC) [10], a vessel, located out1A
cylindrical coordinate system with the z axis along the beam is assumed
TC Relative Efficiency
1 0.8 0.6 0.4 0.2 0 35
40 45 50 MC Positron energy (MeV)
Fig. 3. Efficiency of the TC versus the e+ energy relative to the signal energy (52.83 MeV).
III. T HE T IMING C OUNTER CONCEPT AND DESIGN The TC provides a precise measurement of the positron timing and impact point, to be used for the event reconstruction, and the direction and timing information of the positron, for a fast µ+ → e+ γ trigger. This information must be provided over the full geometrical acceptance for signal events with the photon pointing to the LXEC inner face. The angular range of the positron acceptance cannot be defined easily in terms of the LXEC geometry because of the spread of the decay vertex on the target, in particular along z. The angular range to be covered by the TC is therefore
3
determined by Monte Carlo (MC) simulations taking into account the mechanical constraints. The MC simulations have also been used to determine the TC radial position to ensure the full efficiency for the signal simultaneously limiting the fraction of positrons from Michel decays hitting the TC that contribute to the accidental trigger rate. The detector consists of 2 identical sectors, placed symmetrically with respect to the target in order to cover the corresponding LXEC geometrical acceptance. Each sector is divided in two sub-detectors based on fast optical devices arranged in two layers: the longitudinal (outer) one segmented along the φ coordinate and the transverse (inner) one measuring the z coordinate, satisfying different requirements (Fig. 4).
deposit. The value of the high threshold determines the detector efficiency and is related also to the trigger threshold as will be discussed in Sect.VIII-D. When the DTD is fired a standard NIM waveform is generated and then digitized by DRS boards together with the PMT waveform. The NIM and PMT waveforms are analyzed offline to extract the hit time. Several algorithms can be applied, the default current one is based on template fit on the NIM waveform. This method allows to reduce the contribution from the DRS jitter to the overall time resolution. The first 10% copy of each signal is duplicated and fed to the trigger system and DRS: in this stage a second active splitter is used for level translation needed to cope with the input ranges of Trigger and DRS boards; the second one is sent to a charge integrator to monitor the PMT aging.
Fig. 5. Schematic picture of the TC electronic read-out. Signals from each PMT are passively split and fed into dedicated electronics channels. In order to optimize time and pulse reconstruction performances different splitting ratios have been used.
The described architecture provides accurate and reliable information from both NIM and PMT waveforms for each event and their combination offers adequate information valuable to further improve overall performances. Fig. 4. Picture of a TC sector: on top the fibers connected to the APD read out equipment, below the bars connected to the PMT.
A. The Longitudinal (φ) Detector The longitudinal detector is made of an array of 15 scintillating bars (Bicron BC404) with roughly square shape and dimensions 4.0 × 4.0 × 79.6 cm3 ; each bar is read-out by a couple of Fine Mesh PMTs (Hamamatsu R5924) glued at the ends. The bars are arranged in a barrel-like shape to fit the COBRA magnet profile with a 10.5◦ gap between adjacent bars. The choice of scintillator type, PMT and bar sizes has been discussed in detail in [12], [13]. A schematic picture of the electronic readout is shown in Fig. 5. Each PMT signal is passively split in three channels with 80%, 10% and 10% amplitude fractions, respectively. The highest fraction is sent to the Double Threshold Discriminator (DTD) specifically designed for time analysis purposes. DTD is a high bandwidth, low noise discriminator with two different tunable thresholds. The first threshold is set as low as possible, compatibly with the noise level, in order to minimize the Time Walk effect (see SubSect.VIII-B). The second threshold is set to accept only signals associated to physical events, rejecting spurious hits with low energy
B. The Transverse (z) Detector The transverse detector consists of an array of 256 scintillating Multi-Clad fibers (Saint Gobain BCF20) coupled to Avalanche PhotoDiodes (APD Hamamatsu S8664-55), placed orthogonally with respect to the scintillating bars, positioned on top of them and covering the same surface. The small sectional area of the fibers (5 × 5 mm2 plus 2 × 0.5 mm wrapping thickness totaling 6.0 mm in size along z) fits the required space resolution and perfectly matches the 5 × 5 mm2 APD sensitive area. In order to comply with the mechanical constraints, the fiber ends at the APD side are bent in two different types: one set has almost straight termination while the other is “S” shaped with small curvature radii (∼ 2 cm): this causes a light loss that is recovered by wrapping the fibers with a high reflectance film [14]. This results in a 1.0 mm spacing between fibers to accommodate for the wrapping, leading the pitch to 6 mm along z. The APD advantages can be resumed as: small size, insensitivity to magnetic field and fast response. The main disadvantage is the low gain, which can reach at most ∼ 103 if biased near the breakdown voltage, and high capacitance, which makes them sensitive to noise. Each APD is closely coupled to a readout electronics performing signal amplification and shaping. A single APD current pulse is read as voltage across a load resistor and
4
Entries Mean RMS
1200 1000 Counts
amplified. Bundles of 8 APDs are mounted on distinct boards carrying amplifying stages, power supplies, HV bias and ancillary control signal. Due to mechanical constraints, the fiber bundle mounted on a single front-end board is interleaved with the fiber bundle connected to the adjacent board: the resulting assembly, 16 consecutive fibers read-out by two adjacent boards, covers 9.6 × 40.0 cm2 .
54517 1.127 8.151
800 600
Amplitude (mV)
Amplitude (mV)
400 600 TriggerWaveform_514
500 400
600
400
300
300
200
200
0
-6
0.2
0.4
0.6
0.8
1
1.2 time (ns)
600 TriggerWaveform_516
×10
-6
0 0
Amplitude (mV)
Amplitude (mV)
-40
-20
0 20 z_bar - z_fiber (cm)
40
100
100 0 0
200
TriggerWaveform_515
500
0.2
0.4
0.6
0.8
1
1.2 time (ns)
×10
Fig. 7.
Distribution of (zf iber − zbar ).
600 TriggerWaveform_517
500 Fig.500 6. Example of a block of 2 trigger waveforms from APDs, related to 400 400 interleaved bunch of fibers, and covering a ∆z ≈ 9.6 cm wide region on 300 300 one (DownStream) sector. Each waveform results from the addition of signals 200 200 from 8 APDs; vertical scale is 100 mV/div and horizontal scale is 0.2 µs/div. 100 A 100 mV offset is added to keep the100whole signal and baseline into the ×10 ×10 0 0 0 dynamic 0.2 0.4range 0.6 0-10.8V. 1 1.2 0 0.2 0.4 0.6 0.8 1 1.2 ADC time (ns) time (ns) -6
-6
The analog signals from the 8 APDs on each board are summed and fed to the trigger digitizer: an example is depicted in Fig.6; this is a block of 16 interleaved fibers read out by 2 consecutive boards, whose signals can be summed up in order to increase the Signal-to-Noise ratio and consequently the trigger reliability. Noise levels are measured to be in the range 20-30 mV r.m.s. Using the analog summed output the impact coordinate z is obtained at the trigger level with O(3 cm) precision. The front end boards provide also a digital signal from a discriminator for each APD identifying each single fiber hit. The encoded information is stored on dedicated FPGA based VME boards. The coordinate of the fiber zf iber can be matched to the information obtained from the time difference between opposite PMTs on the same bar of the longitudinal detector zbar . An example of a preliminary zf iber − zbar distribution is shown in Fig.7. Since the trigger was fired by cosmic rays hitting the bars, there are some tails due to the inefficiency of the APD detector: a O (10%) is known to be due to geometrical effects (incomplete coverage due to mechanical constraints and 1 mm spacing between fibers) but the larger amount comes from inefficient event reconstruction. A more detailed study on this topic is under way. IV. T HE T IMING C OUNTER IN THE TRIGGER The trigger system is designed to operate a quick and highly efficient selection of candidate events, which is strongly needed for an experiment looking for ultra-rare decays in a huge beam-related background environment. The severe requirement of a maximum latency ≤ 450 ns prevents us from using any piece of information associated with the DCH, thus leaving the TC as the only detector available for the positron at the trigger level. The use of the TC in the trigger has a twofold objective: PMT and APD signals are digitized by means of 8 VME 6U trigger boards (named “Type1”, 4 for each), each hosting 16 input channels equipped with 10-bit flash-ADCs at 100 MHz frequency (for details on the trigger
hardware and architecture refer to [15]). The output data are recorded, and processed, by a Virtex FPGA to operate an on-line reconstruction of the time and impact point of the impinging positrons. Dedicated real-time algorithms have been developed to implement baseline subtraction and amplitude calibration to compensate for any PMT gain and bar light yield difference. A TC cluster is defined in association with a positron loosing energy in a bar such that the signal amplitudes from each PMTs exceed a pre-defined threshold. In addition, the sum of the two amplitudes must be higher than another threshold, which ensures an event selection almost independent of the hit position. That threshold is equivalent to an energy deposit of ≈ 2 MeV, which makes the selection fully efficient for signal positrons. If that condition is met by more consecutive bars (which is the usual case), these are grouped in a single cluster where only the pieces of information (time and position) of the first to be crossed are used. The on-line estimator for the positron time Te+ is obtained from a parabolic interpolation of the leading edge of the sum of the PMT signals on the hit bar. A ≈ 2.5 ns resolution is obtained on that observable, which allows us to define a conservative 20-ns coincidence window with the γ in the LXEC detector. The z-coordinate reconstruction proceeds in two parallel streams to provide, in combination with the bar index, a redundant stereo read-out of the positron hit position on the TC: • APD signal discrimination (an example of which is shown in Fig. 6 as recorded by a trigger board); • the use of a look-up table to compute the logarithm of the PMT charge ratio which, according to Eq. 6, is linearly correlated to the z-coordinate. In the former case, due to the fan-in of APD signals (8 APDs to 1 trigger input channel), a resolution σz ≈ 3 cm is expected. In the latter, the resolution has been measured to be slightly worse, σz ≈ 5 cm, but still suited to obtain an efficient background rejection. The selection of e+ − γ pairs proceeds as follows. in the absence of DCH pieces of information, we need to assume that each positron is a signal-like one: meaning, it must be back-to-back with the γ (whose direction is extracted from
5
the position of the PMT in LXEC with the maximum output) and carrying the signal momentum. Under this assumption, the association of a hit position on the TC with a photon entering the LXEC with a given direction is univocal and it is straightforward to build an association between the index of the maximum amplitude PMT in LXEC and the TC bar and APD indices based on Monte Carlo simulated signal events, as shown in Fig.8. This mapping is summarized in a look-up table which is implemented on-line to check the back-to-back condition.
The determination of the factors b and T W and their stability through the whole data taking period will be discussed hereinafter in more details. VI. P OSITION MEASUREMENT The positron impact point is obtained from the time difference between the two pulses as veff · (tin − tout − (bin − bout ) − (T Win − T Wout )) (3) z= 2 The impact point can also be evaluated using the ratio between the charges delivered at each PMT [16]: Qin = E · Gin · exp
−
L +z 2 Λeff
(4)
−
L −z 2 Λeff
(5)
Qout = E · Gout · exp
where E is the energy released inside the bar, Gin,out takes into account several contributions (i.e. the scintillator yield, PMT quantum efficiency and gain), Λeff is the effective attenuation length of the bar. Taking the ratio we obtain: Qin Gin − 2z = · exp Λeff Qout Gout
(6)
which leads to: Λeff z= 2
�
Qout Gout ln − ln Qin Gin
� (7)
Moreover, from Eq. 4 the energy release in the bar can be estimated independently from z: Fig. 8. Expected hit map (z, ϕ) for positron signals on the TC obtained from a Monte Carlo simulation. Different color markers refer to positrons emitted at different φ angles in the detector frame, each band being associated with a PMT row in the LXEC.
Considering a positron impinging on a TC bar, the time measured by the inner (in) and outer (out) PMTs can be written as: +z veff L −z + bout + T Wout + 2 veff
tin = TT C + bin + T Win + tout = TT C
L 2
(1)
where TT C is the actual time of impact of the positron on the bar, bin,out are offsets depending on the readout chain and fixed for each couple of PMTs, T Win,out are contributions from Time Walk effect, veff is the effective velocity of light in the bar and L is the bar length; the z axis points along the main axis of the bar and its origin is taken in the middle of the bar. From Eq. 1 the true impact time is given by:
TT C
bin + bout T Win + T Wout L tin + tout − − − . = 2 2 2 2veff (2)
Logaritmic Charge Ratio
V. T IMING MEASUREMENT
1.5 1
Λeff = 76.49± 0.25 cm G1/G2 = 1.10± 0.02
0.5 0 -0.5 -1 -20
0 20 Z position (cm)
Fig. 9. Logarithm of the PMT charge ratio vs the z coordinate measurement using Eq. 3 for bar number 1. The linear fit returns Λeff and the ratio of PMT gains.
p p − L Qin · Qout = E · Gout · Gin exp Λeff
(8)
Note that the combination of Eqs. 7 and 8 provides a way to evaluate the ratio between Λeff /veff for each TC bar. Assuming
6
veff = 14.0cm/ns, the value of Λeff is extracted from a linear fit as shown in Fig.9. The Λeff s extracted in 2010 for all bars fall in the range 40 − 90 cm. Two methods for the impact point reconstruction are used in different stages of the data acquisition chain. The online algorithm for z reconstruction in trigger, requiring fast response and moderate precision, relies on the charge ratio method, while the offline analysis, aiming at the best possible resolution, exploits the PMTs time difference. The need for offline calibrations to guarantee the ultimate performance (both for z and time resolutions) is satisfied by using several tools, presented in the following.
the impact angle to mimic the experiment conditions. A rear detector was used in order to veto multi-particle bunches that could affect the time measurement. A r´esum´e of the measured resolutions is presented in fig. 10 and in fig. 11 from which it is clear that the averaged time resolution for each bar is σT ≤ 40 ps.
VII. B EAM T EST PERFORMANCES
Fig. 10. Bar time resolution, as a function of bar number and impact point position.
90 80 70 60 σ (ps)
All TC single modules (bar-PMT assembly) were tested using narrow particle beams to evaluate the timing resolution under conditions close to the experimental ones. The tests were carried on at the Beam Test Facility (BTF) in the INFN Frascati National Laboratory. The BTF can provide bunches of e− or e+ with energy up to 750 MeV and multiplicity tunable in the range 1 − 1010 particles/bunch [17], [18]. In our test, we used it as a single electron source in order to simulate the bar crossing by one particle at once. The single bar rate under experimental conditions has been evaluated to be O(100 kHz) by means of MC simulations. Since the PMT response is as short as 10 ns, there is a negligible probability to have overlapping by multiple hits, thus we correctly reproduced the actual working conditions. Rate effects have been however studied to make sure the detector performance is not affected by particle crowding and are reported elsewhere [12]. The signals from PMTs were fed into the DTD and then used to provide Start-Stop signals to a TAC (Time-toAmplitude Converter) system that together with an ADC board allowed to obtain a 12.5 ps/bin resolution, calibrated using high-precision delay lines. The timing resolution was evaluated out distributions taken in various positions, from ∆T = tin −t 2 where tin and tout are defined in Eq. 1. This method is almost equivalent to the one making use of impact time from Eq. 2 with the following differences: i) ∆T is not affected by Time Walk effect at the leading order approximation and ii) a significant contribution to time spread can be due to the finite spot size. The Time Walk treatment under experimental conditions is discussed in VIII-B, while the beam spot size contribution was evaluated as follows: the impact point position was determined with an external telescope defining a 5 mm spot on the bar under test. The effective velocity of light in the bar was estimated from ∆T vs z, to be veff ∼ 14.0 cm/ns. The resulting contribution from the impact point uncertainty √to the measured timing resolution is given by σ(∆T ) = 0.5/ 12 cm/(veff (cm/ps)) = O(10 ps) under the approximation of a uniform beam spot (worst case), and thus negligible. A similar contribution was evaluated for the electronic chain (DTD-TDC-ADC) by splitting the signal from one PMT and looking to the width of Tstop − Tstart distribution. A mechanical support allowed scanning each bar by moving the impact point along its main axis (z direction) and varying
50 40 30 20 10 0
0
5 Bar number
10
Fig. 11. Bar time resolution averaged along the bar length, versus bar number.
VIII. C ALIBRATIONS The integration of the TC in the MEG apparatus requires a full set of calibrations to determine the detector parameters necessary to optimize its performances. Hereinafter only those calibrations involving the TC alone are described. Additional calibrations, involving other sub-detectors (e.g. space and time alignments with DCH and LXEC) are described elsewhere [19]. A. PMT gain equalization The PMT gain equalization procedure exploits cosmic rays hitting the TC: due of the uniformity of cosmic ray hit distribution along the bars the charge and amplitude spectra of the inner and outer PMTs are marginally affected by geometrical effects. It is therefore possible to tune the PMT gains acting on the bias high voltages and equalize the peaks
7
of the Landau distributions (Fig.12) within 15% maximum (Fig.13). A percent level offline equalization is achieved using suitable weights for each PMT in the trigger tables. Due to the non-solenoidal configuration of the magnetic field, inner and outer PMTs are subject to different field intensities and orientations and therefore operate in very different working conditions.
As shown in Fig.(15), this function reproduces outstandingly the experimental data.
500
Counts
400 300 200 100 0 0
0.2
0.4 0.6 Charge (nC)
0.8
1
Fig. 14.
Graphical representation of the Time Walk effect.
Fig. 12. Example of charge spectrum acquired with a TC bar, superimposed with a Landau function fit. 4.5 4
0.6 Time (ns)
3.5
0.5
3 2.5
Charge peak (nC)
2 1.5
0.4
1 0
0.3 Fig. 15.
0.2 0.1 0
0
5
10 15 20 Bar number
25
Fig. 13. Distribution of the Landau peak amplitudes versus the bar number.
B. Time walk corrections The Time Walk effect is the dependence of threshold crossing delay time on pulse amplitude as showed in Fig.14. The analog waveforms sampled at 1.6 GHz are averaged and interpolated separately for each PMT over many events to obtain a template waveform, that can be used to evaluate the correction required in time reconstruction: for each template pulse the leading edge region is used to produce a plot of the delay time versus pulse amplitude dependence that is fitted analytically with the function: √ T W = A + B x + C log x (9) where x is the ratio between the low threshold value and the pulse amplitude of the PMT and A, B, C are the fit parameters.
0.1 0.2 Normalized amplitude (a.u.)
0.3
Time delay versus amplitude relation with fit superimposed.
For each PMT, an event-by-event correction is applied based on the pulse amplitude and the fitted coefficients. This correction depends on the low level threshold (LLT) value and the PMT pulse shape. The optimal LLT value balancing Time Walk immunity and noise rejection was found evaluating the timing resolution of each bar with dedicated tests performed using the method described in IX-A. Fig. 16 shows the comparison between the time resolutions obtained with two different LLT values (10 mV and 25 mV) on the double bar sample. The difference between the time resolutions with the two threshold showed is systematically favoring the higher value of 25 mV. On the basis of a complete scan of the time resolution (evaluated on the double bar sample) versus the low threshold in 5 mV steps from 5 to 35 mV the optimal value of LLT was found to be 25 mV. C. Timing Counter offset correction Inter bar time offsets due to electronic chains are evaluated using again cosmic rays. All PMTs are equipped with HuberS¨uhner Enviroflex 400 signal cables with equal length (10 m) and with low loss characteristics [20]. This minimizes the possibility of time offsets drifting during the data taking period
8
distribution is directly proportional to veff in the corresponding bar. The monitoring of the stability of the bar offset is achieved throughout the full period of data taking with several tools both during the data taking itself (i.e. using the Michel positrons to check the hitmap) and with dedicated cosmic runs. Full calibration of time offsets and TW coefficients is repeated before each year-long campaign (to account for electronics and detector maintenance, rescaling of gain factors).
0.2 0.18
LLT = 25mV
0.16
LLT = 10mV
σ (ns)
0.14 0.12 0.1 0.08 0.06 0.04 0.02 0
0
5
10 15 20 Bar number
25
Fig. 16. Timing resolutions for different values of low level threshold for double bar events.
(several months) and, together with a continuous monitoring of the relevant variables, ensures a stable operation for our detector. For each bar, the time difference distribution between inner and outer PMTs is acquired. Due to the cosmic rays uniformity this distribution is expected to be flat and centered at zero; the mean values of these distributions give a direct measure of the relative offsets between PMTs on each scintillating bar. The time offsets between different bars and TC and LXEC detectors are calculated using events from muon Michel decays as well as different tools [21].
0 -20
D. DTD calibration The background rejection is a crucial point of the experiment, together with the maximum efficiency for the relevant signals: both are related to the fast on-line event reconstruction performed at the trigger level. Trigger position resolution is a key parameter for direction match with the photon entering the LXEC and is evaluated to be σ(∆z) ∼ 7.3 cm by comparing the trigger-level reconstruction of impact point and the one obtained with calibrated ∆t. On the other hand, from the point of view of subsequent analysis, TC trigger and DTD conditional efficiency study is motivated by the request for all triggered events to fire a DTD output in order to allow the best event reconstruction. The relevant parameter is the threshold efficiency �DT D defined, for each bar, as the ratio between the number of events with NIM signals and the total number of triggered events on the bar itself, plotted versus the high level threshold. This one is set slightly lower than the trigger one, in order to avoid acquiring events without NIM pulse information. Fig. 18 presents the efficiency �DT D versus threshold level. Averaging 100 over all bars we obtain �DT D ≥ 99.9% for High Threshold HLT ≤ 400 mV. 80 60
-60
50
100
150
-80
40
99 86
96 99 0.
99 99
72
0.985 89
60 -60
0.98
97
-40
0.99
0.
80
98
100 0
φ ( °)
0.
0.995
-20
0.
1
0
0.
0 z (cm)
43
-50
0. 99
-100
Efficiency
-140 -150
0.
20 -120
99 99
40
-100
99 99
-80
0.
φ ( °)
-40
-100 20 -120 -140 -150
-100
-50
0 z (cm)
50
100
150
0
0.975 0.97
Fig. 17.
Cosmic hit maps before and after bar time offset subtractions.
Fig. 17 shows the effect of accounting for bar offsets on cosmic ray two-dimensional hit map. The shape of the detector hit map becomes rectangular when the correct time offsets (lower panel) are used and the z reconstruction is reliable. This is to be compared to the upper panel, where the uncorrected time differences are used for the impact point determination resulting in a deformed hit map with respect to the actual detector shape. Eq. 3 clearly implies that the width of each
300
400 500 High level threshold (mV)
600
Fig. 18. DTD efficiency vs high threshold value. The efficiency plateau is reached for HT ≤ 400 mV .
IX. R ESOLUTIONS A. Timing resolution The timing resolution is extrapolated from multiple bars hit. On a sample of two consecutive bars hit by a positron, the time
9
difference ∆T = T2 − T1 is studied. For each bar the impact time is defined as in Eq. 2. The time difference can be written as q 2 (10) σT = (σ12 + σ22 ) + σtrack
the effect of the different path length between bars can be rejected at the first order, resulting in a better estimate of timing resolution, as showed in Fig. 19 where the red and black markers represent respectively the resolutions obtained in triple and double bar samples. However the triple sample has significantly smaller statistics so the double bar sample is kept as the reference tool for checking the detector performances. The resolutions reported in Fig. 19 are obtained from a different sample than those shown in Fig. 16: this was because of the insufficient number of triple bar events in the latter one. However the two data sets show very similar behavior pointing out a stable operation of the detector. A certain degradation of the timing performance between the Beam Test (σt = 40 − 50 ps) and the Physics Run configuration (σt = 60 − 80 ps) has been observed. A few factors have contributed to this effect: the need for a lower PMT gain in order to withstand the high rate and match the dynamic range of the DAQ/electronics chain; a slightly higher value for the low threshold due to additional noise from the surrounding environment; and intrinsic uncertainties in both double and triple bar estimates. A deeper study on alternative schemes for extracting the time information is under way in order to improve the detector performance. B. Impact point resolution From the triple bar events it is also possible to estimate the resolution on the z coordinate of the impact point, substituting the reconstructed time with the reconstructed z coordinate: z1 + z3 ∆z = z2 − (12) 2 where i = 1, 2, 3 is the bar index. The position resolution obtained from the triple bar sample is 1.1 cm < σz < 2.0 cm. Fig.20 shows an example of a ∆z distribution.
isto_res_mio isto_res
Double Entries 30 Mean 16.72 15.03 Triple RMS 8.057 6.182
0.12
σ (ns)
0.1 0.08 0.06 0.04 0.02 0
0
5
10 15 20 Bar number
25
Fig. 19. Timing resolution on double (black markers) and triple (red markers) bar events, with LLT=25 mV. Due to the different rates for two and three-bar events, the sample used here is different than the one in Fig. 16
60
Entries 1561 Mean 0.5103 RMS 2.198
50 40 Counts
(where σi are the single bar time resolutions and σtrack the contribution from the track length spread. Under the hypothesis that the two bars have similar resolutions σ1 ≈ σ2 and neglecting the term due to track propagation, the single bar resolution is √ estimated from the spread of the ∆T distributions divided by 2. More precisely, we perform a fit using a Gaussian plus second order polynomial function to take into account tails due to spurious hits (less than a few % of the total). In order to keep a conservative estimate useful also for long-term monitoring, we apply looser cuts with respect to the final analysis: for example, by requesting a track reconstructed in the DCH, the polynomial tail disappears and the core resolution remains unchanged. This method slightly overestimate the timing resolution since the track length spread term is not corrected for. Using triple bar events and evaluating the quantity: T1 + T3 (11) ∆T = T2 − 2
0.14
30 20 10 0 -20
Fig. 20.
-10
0 ∆ Z (cm)
10
20
z resolution on triple bar events with a Gaussian fit superimposed.
X. C ONCLUSION The TC is a cutting edge detector in the field of high resolution timing measurements. It demonstrated a timing resolution as good as 40 ps in dedicated beam tests and 60 ps < σ(t) < 80 ps under real conditions in the MEG experiment together with a precise measurement of the impact point with σ(z) < 2 cm. The TC fast response satisfies all the requirements of a trigger designed to select events on-line in a huge background. The TC has been commissioned and is currently operating as part of the MEG detector. ACKNOWLEDGMENTS We want to acknowledge Dr. M. Ribeiro Gomes for her valuable help in revising the manuscript and the mechanical and electronics workshops at INFN Sections of Genova and Pavia.
10
R EFERENCES [1] R. Barbieri, L. Hall, and A. Strumia, “Violations of lepton flavour and CP in supersymmetric unified theories,” Nucl. Phys. B, vol. 445, no. 2-3, pp. 219–251, 1995. [2] J. Adam et al., “A limit for the µ+ → e+ γ decay from the MEG experiment,” Nucl. Phys., vol. B834, pp. 1–12, 2010. [3] ——, “New limit on the lepton-flavour violating decay µ+ → e+ γ ,” Phys. Rev. Lett., vol. 107, p. 171801, 2011. [4] M. L. Brooks et al., “New limit for the lepton-family-number nonconserving decay µ+ → e+ γ,” Phys. Rev. Lett., vol. 83, no. 8, pp. 1521– 1524, Aug 1999. [5] http://aea.web.psi.ch/beam2lines/beam_pie5.html. [6] A. Baldini, T. Mori et al., “The meg experiment: search for the µ+ → e+ γ decay at psi,” Research Proposal to INFN, 2002. [7] W. Ootani et al., “Development of a thin-wall superconducting magnet for the positron spectrometer in the MEG experiment,” IEEE Trans. on Appl. Supercond., vol. 14, no. 2, pp. 568–571, June 2004. [8] P. W. Cattaneo et al., “The timing counter of the MEG experiment: calibration and performance,” Nucl. Phys. B (Proc. Suppl.), vol. 215, pp. 281–283, 2011. [9] P. W. Cattaneo, “The MEG spectrometer at PSI,” Nucl. Instr. and Meth. A, vol. 623, pp. 350–352, 2010. [10] R. Sawada, “Performance of liquid xenon gamma ray detector for MEG,” Nucl. Instr. and Meth. A, vol. 623, pp. 258–260, 2010. [11] S. Ritt, R. D. Napoli, and U. Hartmann, “Application of the DRS chip for fast waveform digitizing,” Nucl. Instr. and Meth. A, vol. 623, no. 1, pp. 486–488, 2010. [12] M. Bonesini et al., “Behaviour in high magnetic fields of fine-mesh photodetectors for fast time-of-flight detectors,” Nucl. Instr. and Meth. A, vol. 567, pp. 200–204, 2006. [13] S. Dussoni et al., “The timing counter of the MEG experiment: design and commissioning,” Nucl. Instr. and Meth. A, vol. 617, pp. 387–390, 2010. [14] M. De Gerone et al., “Development and characterization of scintillating fiber-APD based detector,” Nucl. Instr. and Meth. A, vol. 610, pp. 218– 221, 2009. [15] L. Galli, “A real-time glance at the Lepton Flavor Violating decay µ+ → e+ γ in the MEG experiment,” Ph.D. dissertation, University of Pisa, Italy, 2010. [16] G. F. Knoll, Radiation detection and measurement. John Wiley & Sons, 1988, ch. 10.VII, p. 329. [17] G. Mazzitelli, A. Ghigo, F. Sannibale, P. Valente, and G. Vignola, “Commissioning of the DAΦNE beam test facility,” Nucl. Instr. and Meth. A, vol. 515, no. 3, pp. 524 – 542, 2003. [18] B. Buonomo, G. Mazzitelli, and P. Valente, “Performance and upgrade of the DAΦNE beam test facility,” in IEEE Nuclear Science Symposium Conference Record, Rome, Italy, October 2004. [19] M. De Gerone et al., “The MEG timing counter calibration and performance,” Nucl. Instr. and Meth. A, vol. 638, pp. 41–46, 2011. [20] http://www.hubersuhner.com. [21] J. Adam et al., “Calibration and monitoring of the MEG experiment by a proton beam from a Cockcroft-Walton accelerator,” Nucl. Instr. and Meth. A, vol. 641, pp. 19-32, 2011.