Predicted V rsus Test Load-Deflection Curves for Specimen 2 ...... ... . ...... Reed, William, H., Avery, James P., Ph.D., PRINCIPLES FOR IMPROVING .... Burgmann, J. B., and Rawlings, B., DYNAMIC PLASTIC ANALYSIS OF PIN-. JOINTED ...
AD-784 191 DEVELOPMENT AND EXPERIMENTAL VERIFICATION OF PROCEDURES TO DETERMINE NONLINEAR LOAD-DEFLECTION CHARACTERISTIC S OF HELICOPTER SUBSTRUCTURES SUBJECTED TO CRASH FORCES. VOLUME I. DEVELOPMENT OF SIMPLIFIED ANALYTICAL TECHNIQUES TO PREDICT TYPICAL HELICOPTER AIRFRAME CRUSHING CHARACTERISTICS AND THE FORMULATION OF DESIGN PROCEDURES O.
Wittlin,
et a]
Lock heed- Califor ni a Company
Prepared for: Army Air Mobility Research Development Lab or atory May
and
1974
DISTRIBUTED BY:
N"ational Technical Information Service U.S. DEPARTMENT OF COMMERCE 5285 Port Royal Road, Springfield Va. 22151
Unclassified SECURITY CLA3IICATION OF THIS PAGE (Whe
REPO
1.
. REPORT NUME
',-TR-74-12A,/
USAA
B1m__e__
Dat
DOCUMENTATIOCN PAGE
B
GOVT ACCESO
NO
3. RRCIPIENTS CATALOG
S. TYPE OF NEORT
DEVELOPMENT AND EXPERIMENTAL VERIFICATION OF PROCEDURES TO DETEM4INE NONLINEAR LOAD-DEFLECTION
,
/)%
mooCOVREo 0t
Final report
CHARACTERISTICS OF HELICOPTER SUBSTRUCTURES
.
PERFORMING ORG. REPORT MUMmER
SUBJECTED TO CRASH FORCES - VOLUE I AUTHOR(.)
g. CONTRACT OR GRANT NUMSER(e)
G. Wittlin K. C. Park
Contract DAAJ02-73-C-0051
PERFORMING ORGANIZATION NAME AND ADDRESS
s.
POrn M&ER
Z7/%r
4. TITLE (A"mSuIftl,)
7.
COMLTWOM
10. PROGRAM ELEMENT. PROJECT. TASK AREA & WORK UNIT NUMBERS
Lockheed-California Company Burbank, California 91503
Task IF162205AH88
I1. CONTROLLING OFFICE NAME AND ADDRESS
12. REPORT DATE
Eustis Directorate U. S. Army Air Mobility RD Laboratory Fort Eustis, Virginia 23604 T.
MONITORING AGENCY NAME & ADDRESS(If diffht
May 1974 Is.
NUMBER OF PAGES
_"___
from ContelIhnd Office)
IU.
SECURITY C. ASS.
lt this epo")
Unclassified
15a. DEC.ASSI FICATION/DOWNGRADING SCNHEDULE IS.
DISTRIBUTION STATEMENT (0OiI
Repoei)
Approved for public release; distribution unlimited. I?.
DISTRIBUTION STATEMENT (of the abstrat entefodn Block 20, It Elliet
It.
SUPLEMENTARY NOTES
fr0 o RROPt)
Volume I of a two-volume report
IS.
KEY WORDS (Conthwe an rcverse saved
Aircraft Crash resistance Dynaics Structural properties 20.
SThe
ABSTRACT (Conntse on
If necoeary and Identify by block number)
Tolerances (physiology) Helicopters Energy absorbers Mathematical. models aide If necesery and fIodsily, by block mumbor)
ro
results of a study to develop simplified design proceduies for determining nonlinear load-deflection characteristics for helicopter airframe structures are presented. A literature survey i performed in which 60 tecbnical reports and papers are tvaluated with regard to their applicability to crashworthiness analysis and designer-oriented procedures.
DOI
JAN
.
1473
!OiTION OF I NOV65 IS OSOLETC
NAT!ONAtA
F$
TFCINI
r r r'v,(
!NFORMATION
A
"'.
Unclassified SECURITY CLASSIFICATION OF THIS PAGE (Uh9Jn Date
ntered)
,
Unclassified uuCUNTY CLAWU ICATiOW OF TWIS PAU9(ft
DO"hb
4. Continued. DEVELOPMENT OF SIMPLIFIED ANALYTICAL TECHNIQUES TO PREDICT TYPICAL HELICOPTER AIRFRAME CRU3IIING CHARACTERISTICS AND Ti1E FORMULATION OF DESIGN PROCEDURES 20. Continued. Studies using an existing 31 lumped mass model of the UH-lH helicopter are performed to determine the sensitivity of responses to changes in the loaddeflection representation for the engine and transmission mounts, landing gear and fuselage. Simplified techniques are used to predict the loaddeflection curve for the crushing of a segment of the lower fuselage under impact conditions. The predictions include elastic behavior, failure load and post-fallure behavior. The structural segment selected for analysis and test is a section supported on four edges, representative of the transmission pylon support. Twelve specimens were fabricated and tested. The specimens are 46 inches long by 18 inches wide by 6.125 Inches or 12.125 inches deep. The 6.125inch-deep specimens are approximately half size (except for thickness) and are varied in detail design (number of angles, spacing of angles, lightening holes). Slatic and dynamic tests were perfoned. The predicted loaddeflection curves are compared to the test load-defle'tion curves and show good agreement with regard to peak failure load, failure point, energy absorbed, and shape. The results of the tests show that for'this type of fuselage structure, static tests provide load-deflection data which is
similar to data that can be obtained from dynamic tests, but more economically. ,rcgram IGASH is refined to facilitate its use by designers. In particular, the input data is reordered, some Inputs are standardized and more general load-deflection curve characteristics are possible. The capacity of the program is increased to O lumped tmisses, 100 internal beams and 120 load-deflection tables. The refined program was ru to demonstrate capablilIty to treat a three-dimens ional Impact velocity, rass penetration into an occupiable space. and simplified rotor blade contact. Specimen test data is also
,se
t) refine the 31 mass tI-lB1 model.
The analytical techniq.es developed herein are presenten in the form of design charts, nomoigraphs, curves, tables and e",ations and form the basis of a strictural crashworthiness design manual. The ueslbrn procedures are outlinel in a step-by-step process including exa3mples. Included in the lesicn procedures are design model ing guidelines for such typical structural elements as columns, beams, honeycomb panels an(, francible tubes. Volume 11 contain3 supporting analytical and test data and a literature matrix nat~gorization. A descripti )n of refined rogrtim KRASH is provid('d w'hich sn, ",,s thr, new input-output format, listing, and :,,inple problems.
$ UIYC.AS$1FICA7ION THiS Ci. UncIOFsi OFlied SICURITY
pAOE (lrh~i D.4
Mt...de)
EUSTIS DIRECTORATE POSITION4 STATEMENT
The Eustis Directorate technical monitor for this effort was Mr. G. T. Singley III of the Military Operations Technology Division. The 'conclusions submitted by the contractor are considered to be valid. The report is divided into two volumes. Volumne I contains a description of the survey of technical publications, investigation of the sensitivity of the simulated structural response to load-deflection variations, substructure test program, refinement of KRASI, structural crashworthiness design procedures, and results obtained. Voltne 11 contains abstracts of literature reviewed, supporting analytical-and test data, a description of the refined KRASH computer program, and a user's guide for the computer program.
=!:i'
KOiSiU1~A~L 1iyL 3
CAo~r6
0
'f.
DISCLAIMERS
Ilhe fi"dng in ti I"O~ ea not to be conmtued "asn official Departent of the Army Position unlese so dselg.jte by
other
authorized documents.
~WM Government drawiiia, specificetione. or other date em usad for any purpos other than in connection %fd,a definitely related tjowenment procuremet operation, the United States Government thereby incurs no NVlilt Iep nor any obligation whatsoever and the fect that the Government noey have formulated, furnished, sppied the said drawing, specifications, or other date is not to be regarded by imlication or or Inanv yW
oheWieB as In any mnenner licensing the holder or any other person or corporation, of conveying any rtqhu or tonunfetur, ueor sell any petented invention thet may in any P"e be related thieto. per~sson Tradle ontm cited in this rep"r do no constitut an ofiia endorsement or approval of the use of such aeWN10mene harsivre or softwar
R!MPITIOU4
INSRlfTI
DOW"o this reotWhen no longe needed. Do not return it to the originator.
fi
j
--.-
N-|.,
PREFACE
This report was prepared by the Lockheed-California Company under U.S.
Army Contract DAAJ02-73-C-0051 (Pro'ect 1F262205AH88).
4G.T.
The work was
administered under the direction of the Eustis Directorate, U.S. Army Air Mobility Research and Development Laboratory, Fort Eustis, Virginia,with Singley,III, acting as Project Engineer. The Lockheed-California Company Program Manager was G. Wittlin. K.G. Park developed the analytical procedures. The design procedures were developed by both G. Wittlin and K.C. Park. Supporting effort was provided by R. Matlock (test) and M.A. Gamon (program KRASH refinements).
iii
TABLE OF CONTENTS
Page
PREFA CE
.
. . . . .
. ... . .
LIST OF ILLUSTRATIONS ..
LIST OF TABLES
INTRODUCTION
.... .....
..
..
e.
..
.
.. .
..
..
..
. .
. .
. . . . . . . .
...
..
.. .
. ..
. . .
viii
. .
. . . . . . ..
.
Background . . . . . . . ......................... . . . . . . . . . . ... Program Objectives Report Format
1 5
. . . .....................
SURVEY OF TECHNICAL PUBLICATIONS
xv
6
........
. .........
7
General Discussion .................
7
Evaluation .......................
...
.
7
Simplified Analytical Techniques . . . . . Experimen.tal Data . . . . ........... . . . Design Procedures and Guidelines .. . . . .... . Load-Deflection Data .....................
13 13
Energy Absorption .................... Methods of Analysis ....................
16 19
Strain Rate Effects ...... Inertia Effects .. .. .. ..
19 20
LOAD-SENSITIVITY STUDY ....... General . . . .
.
.
..
.
.
..
.
.
..
.
.
..
.
.
..
.. . . ..
......................
. .
..................
Landing Gear ........ Fuselage
21
21
....................
Load-Deflection Variations .................. Engine ................................. Transmission ........ ......................... Landing Gear ...... ..................... Fuselage ............ ........................ Results .......... .......................... .... Engine ................................ . Transmission
8
21 21
27 27 31 31 31 37
.........................
. . . . . . . . . . . . . . . . . . . . . . . ..
37 37
Page
StV.;:-.... .±JRE ANALYSIS .
.
.
.
.
.
Objective . . . . . . . . .......... Methods of Analy3is . Procedure.............. . Predictio' of Failure L'ads for Stiffened Panels .... Post-Failure Analysis of Stiffened Panels .......... ... Calculation of Plastic Hinge Moment (1p) . . . . . . . . Main Beam and Bottom Skin Analysis . .......... . Total Load Deflection ...... .................. .... Column Effect on the Failure Strength of Stiffened Panels ........................ General Application of the Proqedure .. .......... ... Predicted Subelement and Total Load-Deflectlon Curves .
SUBSTRUCTURE TST PROGRAM .....
..
....................
. .
Strain Data and Failure Modes .... PRLGRAM "KRASH" REFINEMENT ....
......
. .
....
.....
60
62
63
76
.................. .....
55 58
.
...................
Determination of the Deflection Value at Failure
49
67 67
General .... ....... ........................... . Comparison of Test and Analysis Load-Deflection Curves .i.. Comparison of Test and Analysis Energy Absorption ....... Remarks on the Initial Analytical Assumptions .............. Plastic Hinge Formatio:i. ..... ..................... Empirical Corrections ",o the Post-Failure Load-Deflection Curve ..... .....................
Failure Deflection ...
42 42 49
.
Tes Program Objectives ..... ..... ...... ... General . . .. . . . . . . . . . . . . . . . . . . . Test Specimens ..... ... ....................... ..... Installation ..... ........................ Instrumentation .... .... ...................... .... Test Sequence .................. Photography .... ........................ Results ..... ...... .......................... .... CORRELATION . . . .....................
42
76 76 77 80 88 88 91 91
i 11
111 118 122 122 125
127 127 132 137
iS
General ....
......
.....
........
Program "KRASH" Input Forwat Revisions ..
......
Three-Dimensional Impact and Mass Penetration ........ Case Description...... ..... ......
Results .....
.......
Rotor Blade Contact . . . Case Dec ription ..... Results ..... ......
137
...........
.....
138
..
139 139
....
........................ . .......... ..... .....
vi
...... ......
139 ..... ....
141 141 ....
4.,
-
"
Page Test Data Load-Deflection Curve . . . .141 Case Description ......... ........... Results . . . . . . . . . . . . . . . . . . . . . DESIGN PROCEDURES.........
.
.
.
. .
.
.
.
.
.
.
.
.
.
.
.
Specification of Crashworthiness Capability .......... ... General Approach ........................... Detail Approach . ....... ...............
141 143 145 145
146 150
Detail Design Procedure and Illustrative Sample Calculations ........ .....................
150
Structural Element Modeling Guidelines
185
RESULTS OF THE PROGRAM
.
............
. . . ....................
CONCLUSIONS ..................................
LIST OF SYMBOLS
.
. .
Correlation Between Test and Analysis ...... Program "KRASH" Refinement .....................
REFERENCES
. . .
...
......................
Literature Survey and Critique .... Load-Sensitivity Study .................... Substructure Analysis .............. Substructure Test Program ..................
Design Procedures
.
.
.
.
.
.
.
.
203
.
203 203
204
..
206
............
210
..
211
213 215
.........................
216
. ........................
225
vii
j
LIST OF ILLUSTRATIONS Figure 1 2
3 4
Page Load-Deflection and Energy-Absorbed Results for Static and Dynamic Fuselage Bumper Tests (Reference 1) . . .
.
4
Plate Stringer Compression Panels Load-Deflection Test Data (Reference 4)....... ... ....................
9
.
The Effects of Impact Speed on Dynamic Force-Deflection Relationship of Curved Box-Beam Columns (Reference 38)
.
11
Structural Behavior Typical of Solid Cross-Section Beams . .. . of Ductile Material (Reference 39) ...........
12
5
Structural Behavior Typical of Built-Up Beams (Reference 30
12
6
General Arrangement of the UH-lH Helicopter .
22
.......
...
31 Lumped Mass Helicopter Model Representation (Reference
1)
..........
. . . .
. .
. . .
..
.
23
8
Engine Axial and Bending Load-Stroke Curves .
9
Left Side, Looking Inboard, View of Engine Mount ..
.....
27
10
Transmission Axial and Bending Load-Stroke Curves
. ...
29
11
Landing-Gear Bending and Rotational Load-Stroke Curves . .
30
12
Fuselage External Crushing Load-Deflection Curves
. ...
32
13
Fuselage External Crushing Load-Deflection Curves
. ...
32
14
Engine-Mount Axial Load and Energy Absorbed Versus
Deflection Curves .......
...
.......
...
....................
26
34
15
Engine-Mount Bending Load and Energy Absorbed Versus Deflection Curves ....... .......................
35
16
Transmission-Mount Axial Load and Energy Absorbe,. Versus Deflection Curves .................
38
11
Landing Gear Load and Energy Absorbed Versus Deflection Curves .......
...
...................
18
Model Specimen of Lower Fuselage Substructure ...
19
Drawing For Specimens 1 and 2.... ,iii
40
...... 43
...................
45
Figure 20
Page UH-IH Lower Fuselage Bulkhead and Stiffener Arrangement
21
22
23
47
.......................
Various Failure Modes of Short Riveted Panels (Reference 12) ...... ...... .....
.....
Effect of Rivet Tensile Strength, Pitch, and Diameter UpGn Ompressive Strength of Short, Riveted, Aluminum-Alloy Z-Panels, 2117-T4 Rivets (Reference 12)
50
.
Effect of Rivet Tensile Strength, Pitch, and Diameter Upon Compressive Strength of Short, Riveted, AluminumAlloy Z-Panel, Various Rivet Materials (Reference 12) •
.
52
.
53
.........
54
.......... ...
56
Plastic Hinge Mechanisms and Effective Cross Section To Determine Plastic Moment ..... .............. ...
57
Approximate Yield Function for Combined Bendin6 and Axial Force (Reference 101)......... ...........
59
28
Lumped Model of Bottom Skin and Main Beams ..........
61
29
Critical Stress Versus L'/p Rq.'o .....
30
Failure Stress Versus Slenderness Ratio of Stiffened Panels ..... .... ..........................
32
Chsrt for Determining (p/pw)2
33
Stiffeners With Various Corners ...
34
Various Stiffener Configurations ....
35
BuJkhead Load-Deflection Curve for Specimens 1 through 6 ..... ...... .......................
36
Side Skin Load-Deflection Curves for Specimen 1 ...
37
Side Skin Load-Deflection Curve for Specimens 2, 3 and 4
38
Side Skin Load-Deflection Curve for Specimens 5 and 6
39
Main Beam and Bottom Skin Load-Deflection Curve for
24
Method of Determining Number of Flanges ....
25
Method of Determining Effective Width ..
26 27
Specimens 1 and 6 ...... ix
............
. . .. . . .
..
...
64
....
. . . . .. .
66
................. ..
....................
............
68 69
......
.
65
72 72
.
73 73 74
4
Figure
Page
4o
Predicted Total Load-Deflection Curve for Specimen 1
41
Predicted Total Load-Deflection Curve for .................... Specimens 5 and 6 .... ....
75
Predicted Total Loaa-Deflection Curve for ................... ... Specimens 2, 3 and 4 .....
75
Typical 6.125-Inch-Deep Test Specimen ......................... (Specimens 1-9) .......
78
Typical 12.125-Inch-Deep Test Specimen ....................... (Specimens 10-12) .......
78
UH-lH Lower Fuselage Bulkhead and Stiffener ... ......................... Arrangement ......
81
Drawing for Specimens 1 and 2 (All Dimensions in Inches) ....... ..... ..... ......
83
42
43
44 45 46
. .
.
74
85
47
Baldwin Universal Static Testing Machine ....
48
Static Test Setup .......
49
Frame Structure Test Tower for Dynamic Tests ...
50
Dynamic Test Setup With Load Cells for ....................... Specimens 7 and 8 .......
87
51
Strain Gage Locations (All Dimensions in Inches) ..
.....
89
52
Load Versus Deflection, Test 1 ....
..................
93
53
Load Versus Deflection, Test 2 ....
..................
93
54
Load Versus Deflecticn, Test 3 ....
..................
94
55
Load Versus Deflection, Test 4 ....
..................
94
56
Load Versus Deflection, Test 5 ....
..................
95
57
Load Versus Deflection, Test 6 .....
...............
95
58
Load Versus Deflection, Test 7 ....
59
Load Versus Deflection, Test 3 .......
QC
Load Versus Deflection, Test 9 ....
x
.........
....................... .......
..............
....
..............
..................
85 86
96 96 97
Figure
Page
61
Load Versus Deflection, Test 10 ...
.................
97
62
Load Versus Deflection, Test 11. ...
...............
98
63
Load Versus Deflection, Test 12 ...
.................
98
64
Setup for Specimen 12 ......
..................
99
65
Post-Test Condition of Specimen 1 ...
............ ...
100
66
Post-Test Condition of Specimen 2 ....
............. .. 100
67
Post-Test Condition of Specimen 3 ....
............. .. 101
68
Post-Test Condition of Specimen 4 .....
69
Post-Test Condition of Specimen 5 ...
............
... 102
70
Post-Test Condition of Specimen 6 ...
............
... 102
71
Comparison of Post-Test Damage for Specimens 5 and 6 (End View) ....
72
...
............
...................
Comparison for Post-Test Damage for Specimens 5 and 6 (Top View) ........
..............
73
Post-Test Condition of Specimen 7 ...
74
Post-Test Condition of Specimen 8 ......
75
Post-Test Condition of Specimen 9 ....
76
Comparison of Post-Test Damage to Spc.:imens 7, 8 and 9 (Top View) ....... ....................
77
101
............ ...
103 103
... 104 .....
...............
104 105
...
105
.......................
107
Comparison of Post-Test Damage for Specimens 7, 8 and 9 (Side View) ......
78
Post-Test Condition of Specimen 10 .....
......
107
79
Post-Test Condition of Specimen 11. .....
......
108
80
Post-Test Condition of Specimen 12
...........
08
81
Comparison of Post-Test Damage for Specimens ]0 .................... and 11 (Top View) ..........
109
xi
Figure
Page
82
Comparison of Post-Test Damage for Specimens 10 and 12 (Side View) ...... ... ..................
109
83
Predicted Versus Test Load-Deflection Curves for Specimen 1 ..... .. ...................... ...
113
Predicted V rsus Test Load-Deflection Curves for Specimen 2 ...... ... ......................
113
Predicted Versus Test Load-Deflection Curves for Specimen 3 ........ ......................
116
Predicted Versus Test Load-Deflection Curves for Specimen 4 ....... .. ......................
116
Predicted Versus Test Load-Deflection Curves for Specimen 5 ...... ......................
117 i.
84
85
86
87
.
88
Predicted Versus Test Load-Deflection Curve for Specimen 6
117
89
Predicted Versus Test Load-Deflection Curves for Specimen 7 ........................
119
Predicted Versus Test Load-Deflection Curves for Specimen 8 ........ ......................
119
Predicted Versus Test Load-Deflection Curves for Specimen 9 ....... ...................... ...
120
Predicted Versus Test Load-Deflection Curves for Specimen lO .....................
120
Predicted Versus Test Load-Deflection Curve for Specimen l1 ..... .. ..................... ...
121
Predicted Versus Test Load-Deflection Curves for Specimen 12 ...... ... ....................
121
Sensitivity Factor for Asymmetric Hinge Formation Versus Deflection as a Function of Column Length ...... .. .......................
124
96
Post-Failure Load - Deflection Curves ...
.............
125
97
Comparison of Analysis with Experimental Data from Reference 4 ..... ....................
128
90
91
92
93
94
95
xii
Page
FiuE 98
Variation of Stiffness with Load (Reference 107)
99
Load Versus Strain for Specimen No. 1 ...
..... ....
.............
129 133
100
Observed Deformation Modes of Stiffened Panels .
101
Three-Dimensional Impact and Mass Penetration Model
102
Rotor Blade Contact Model ......
103
Test Specimen Data Load-Defledtion Curve .. .........
143
104
Simplified Load-Deflection Categories .....
149
105
Structure Used in Example ......
106
Assumed Deformation Mode .................
107
Determination of K1 .
108
Compressive-Buckling Coefficient for Flat Rectangular Plates (Reference 12) ... ..........
. . . . .
.
.
.
...
135
. . .
140
...................
..........
...................
142
151 152
. . . . . . . .. . . . . . . . . .. . .
.
.
...................
156
157
174
109
Determination of Kw .....
110
:iomograph To Determine Beam Bending Loads ....
il
Nomograph To Determine Beam Deflections ..
112
Load-Deflection Curve Obtained by Asymptotic Matching
113
Load-Deflection Curve for Bulkhead, Sample Problem .
114
Load-Deflection Curve for the Side Stiffener Web, ...................... ... Sample Problem ..... ..
182
Load-Deflection Curve for the Main Beam and Bottom Skin, ... Sample Problem ..... ... ......................
183
115
....
.
........ .........
.....
.
175
...
176
. .
180
..
181
...
184
116
Composite Load-Deflection Curve, Sample Problem
117
Stress Ratio versus Lateral Deflection Curve for .................. ... Axially Loaded Column ......
189
Load versus Deflection Curve for Axially ... ......................... Loaded Column .....
190
118
xiii
FigurePage 119
120
121
122
123
Critical Load Factor for Thin Walled Column with Cross-Section of Unequal Angles .... .............
...
193
Load-Deformation Characteristics for Compressively Loaded Honeycomb Panel (Reference 113) .... ..........
194
Variation of Stress With Angle of Applied Load (Reference 112) ..... .. ...................
197
Thickness versus Energy Absorbing Capacity for Nonstandard Aluminum Honeycombs (Reference 112)
198
Cross-Section of Frangible Tube Energy Absorber (Reference 34) .... ................. Frangible Tube Energy Curve (Reference 34) ..........
125
Comparison of Static and Dynamic Test Results .......
126
Percentage of Structural Springback Versus Impact Velocity . .................... Comparison of Test and Analysis Results
xiv
.
.
....
124
127
.
.
b
200
...
201
..
208
209 .
.
.......
212
-Jl , -v.
'2
N IIIA
..
.
:
_ 11""
I"
"
-_-
LIST OF TABLES Table I II
III
IV
V
Page UH-iH Structural Element Types and Locations ......... Load-Deflection Data .......
14
...................
Matrix of Structural Element Load-Deflection Categories and Load Type ..... .................
15
Comparison of "One-Shot" Load-Limiting Devices For lO00-To-4000-Pound Loads (Reference 2, Table 3-)) . . . .
17
Comparative Summary of Absorption Energies
(Reference 33) ....... VI
3
..................... ...
18
Correlation Study Analytical Model Grid Point Identification (Reference 1) ............... ........
VII VIII IX
X XI XII
XIII XIV XV XVI
Transmission-Mount Axiaa and Bending KR Changes
XVIII XIX XX
...
25
.
28
.....
Landing-Gear Bending and Rotational KR Changes ......
28
Fuselage External Crushing Load-Stroke Characteristics Engine Mount Axiel Load Sensitivity Study Results
.
Fuselage Load Sensitivity Study Results ..
33 36
. . .
.
Transmission-Mount Axial Load Sensitivity Study Results Landing Gear Load Sensitivity Study Results ...
.
. ...
Engine Mount Bending Load Sensitivity Study Res,'Its
.......
.......... ..
36
39 39
41
Values of n, m, g,Pg as Function of Stiffened Panel
Configuration (Reference 12) ....... XVII
.......
Engine-Mount Axial and Bending KR Changes ..
24
...............
Specimen Design Configuration, Dimensions and Types of Tests Performed* ...................
90
....................... ...
92
Summary of Comparison Between Test Results and Predicted Values ....... ...................
xv
79
...................
Strain Gage Locations ....... Test Results ........
..
70
..
112
-
Table XXI XXII
XXIII
Page ConpWrison of Test and Analytically Obtained
Failure Tjo-fiections
..
..
..
..
..
..
Sumary of Test Specimen Stiffener Response
..
..
. ..
130
. . . . . . .
Comparison of Results Using Test Specimen Data With Previous Correlation Analykis and Test Results . . . . . .
XXIV XXV XXI
136
Core Radius
.. . . . . . . . . ..
. . . . . . . . . . .
Reduced Column Length as a Function of End Fixity Typical Values of KT and FC (Reference 34) . .
xvi
.
.. . . .
.
. .
.
144 191 191 199
INTRODUCTION BILCKGROUND To date, research into the determination of load-deflection characteristics for structural elements has been concentrated on the elastic region. Literally thousands of tests have been run on as many specimens which Semiempirhave varied in material, size, shape, loading, and end fixity. ical procedures for determining yield inputs, elastic curve and types of failure have been generated for all hinds of conceivable structures. By ccmparison, there is a sparsity of data available for structural behavior beyond the elastic regime. This, of course, is not to say that no useful information has been developed. A development program could be 'undertakel to obtain the same type of data to support analysis for nonlinear behavior as has already been accomplished on linear behavior of structural elements. However, before such a program is undertaken, the following factors should be considered:
" The cost in manpower, material and time would be very great. " The data can be obtained by performance of proof of crashworthy design tests as a modest addition to the standard laboratory structural tests that are conducted to qualify an airframe. Reference (1) provides a program by which an iterative process is used to incorporate improved crashworthy characteristics into helicopters during the early design phase. Since large deformations are involved (beyond the elastic range) in determining the energy absorbed by the structure during a crash, the nonlinear response of the various significant structural parts comprising the airframe is needed. In addition, because of the large number of different structures used in airframe construction, the designer needs the data In some orderly form that categorizes the response characteristics. The Crash Survival Design Guide (Reference 2) provides valuable information which, if applied properly, will enhance occupant survivability Jn a severe yet potentially survivable crash. The design guide, as currently constituted, presents in detail aircraft crash kinematics, survivable impact envelopes, aizframe crashworthiness principles, seat design, restraint system design, occupant environment design, and additional applicable data. However, the design guide does not describe the following significant items: *
procedures by which crashworthiness capability can be evaluated
* design criteria as a function of the aircraft design configuration and operational usage
.
.
*
.
'
j.
load deflection determination procedures in the nonlinear regime for various types of structural elements used in airframe design
In the last decade, there have been significant efforts to develop crashworthy seats (pilot, troop and gunner). The capabilities of these seats can be greatly enhanced if the structure below the seat, namely, the landing gear and airframe, can be designed to absorb additional energy. Another pertinent factor that must be considered in crashworthy design, whether it be the airframe, seats or major mass items, is that aircraft differ in design configurations, in usage and, consequently, in impact environment and dynamic response characteristics. Until recently it has been difficult to assess aircraft crashworthiness capability. However, the development of digital computer programs (references 1 and 82) has served to provide basic analytical tools. Program KRASH (reference 1), in particular, has proved to be capable of predictIng structural and occupant response during combined velocity(verticallateral and longitudinal) impact. Program KRASH provides a foundation from which the practica.l application of a consistent crashworthiness approach can evolve. The recent study described in reference 1 established that an analytical method is available which is a useful tool for the designer, if guidelines for the determination of nonlinear load-deflection characteristics of structural elements used in aircraft design are provided. The development of simplified methods to obtain this type of data will result in the establishment of procedures which can readily be applied to various airframes to evaluate their crashworthiness capability. Furthermere, designers of aircraft will have the means to improve airframe crashworthiness in an orderly manner to a desired level, with a minimum incremental weight and cost increase. Since the development of procedures applicable to crash analysis is primarily intended for designers, with special emphasis on the preliminary design, special consideration is given to simplified expressions which have general application as opposed to rigorous approaches which are oriented toward unique design or loading conditions. There are many different types of structural elements used in the various sections of a helicopter. The structure is designed to take loads acting in different directions; consequently, different modes of failure occur such as buckling, tension, compression, bearing and shear. Table I gives a sampling of the types of structural elements and their locations in a UH-lH helicopter. Some useful load-deflection information, both linear and nonlinear, has been developed over a period of time for many of the different types (f structural elements used in a helicopter. In particular, much experimental and analytical effort has been expended to determine elastic responses of columns, struts, stringers, longerons, honeycomb panels and beams to dynamic and static loads.
2
4
-4-
While research has been oriented predominately in the linear regime, the results provide valuable information (i.e., the yield points, the elastic curve and buckling behavior) for establishing the characteristics of certain structures when the nonlinear region is encountered. •
_
TATLE I.
UH-lH STI
T
TES AND LOCATIONS
1.
Honeycomb panel
Main beams, bulkheads, skin, fuel cell, door, etc.
2.
Torque box (beams)
Fuselage mid section
3.
Simply supported beam
Lift link (transmission)
4.
Cantilevered beam
Fwd. of f.s. 155, aft of f.s. 21]
5. Tension rod
Fuselage (f.s. 211 to 243)
6. Flanged webs
Bulkheads, main beam
7.
Frames
Cabin, tail boom
&
Stanchions, columns
Cabin
9.
Strt,
10.
bipod, tripod
Bulkheads
Engine mount Fuselage, tail boom
ringers
Tail boom
12.
L ngerons
Tail boom
13.
R b spar
Vertical fin
14.
TOcrsioa tube
Horiz. stabilizer, engine-transmission
15.
Panel (flat, curved)
Fuselage Fuselage, tail boom
11
16.
kii stiffeners
17. Tubular (curved, flat) 18.
Rubber mounts
19. Beam stiffeners
I';
TURAL E.
Landing gear, troop seats Transmission Main beam
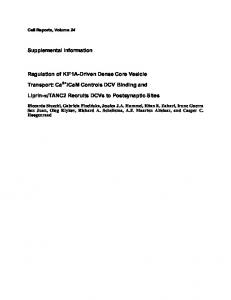
An important consideration in defining the energy absorption characteristics of structural elements in the nonlinear region is to establish the significance of rate of loading. To this end, the energy absorption characteristics of a typical aircraft substructure (P2V-4 fuselage bumper) were obtained under static and dynamic loading conditions (Reference 1). The results of these tests are compared in Figure 1. The dynamic test results show good agreement in the deformation of the shell structure when canpared to the static test data. The results obtained from the tests of the fuselage b mper are significant in that the dynamic test of the bumper indicates that for some typical aircraft structure, a simple static test will suffice.
3
;!!LBDEFLECTION
WiDEH LOAD
130,000 -13,000
i~,,oo
12,sO00
20,000 -11,000
1
100,000 -10,000 90,000 -9,000 80,000
8,00
70,000 -7,000 60,000 -6,000
V
,0
'I50,000
/
ENERGY ABSORBED
40,000 -4,000 LEGEND: 30 ,0 0 0
- 3 ,0 0 0S T IC E T
20,000 -2,000 *10,000
-
DYNAMIC TEST
1,000
DEFLECTION, IN. Figure 1. Load-Deflection and Energy-Absorbed Results for Static and .Dynamic Fuselage Bumper Tests (Reference 1). '4
Some structures, on the other hand, will behave differently under dynamic However, if loading conditione than under a static load environment. static tests can be performed in lieu of dynamic tests to obtain loaddeflection characteristics, then significant savings can be realized in What is needed is an approach which recognizes that future programs.
existing linear and nonlinear load deformAtion data can formulate a basis for establishing guidelines which will holp designers, during the preliminary design stage of a vehicle's development, to determine the amount of energy absorption necessary *o achieve a crashworthy design. The exact load-deflection curve of the element which deforms plastically, although desirable, is not essential to a crashworthiness analysis. More important is the understanding of the gross behavior in the plastic region, i.e.,
constant load-carrying capacity as compared to instantaneous loss of loadcarrying capability. From an economic point of view, it is more efficient to optimize for the incorporation of crashworthiness features early in the design stage. However, during preliminary design it is doubtful if sufficient design details, w Eic influence the exact plastic deformation shape of structural elements, will be available. The availability of simple procedures to predict energy absorption and load-deformation charaiteristics will allow the designer to initiate valuable cost, weight and geometry trade-off studies. The development of these procedures will require some testing of typical specimens. This testing should, as a minimum, verify the validity of proposed procedures for providing pertinent nonlinear load-deformation data. PROGRAM OBJECTIVES The objectives of the program are as follows: 9
To develop simplified analytical techniques by which nonlinear load-deflection characteristics of typical structural elements can be obtained.
*
To verify with tests that these simple analytical techniques are valid for crashworthiness analysis.
•
To provide designers with simplified techniques with which to perform crashworthiness studies during the preliminary design phase.
•
To simplify data input requirements of computer program KRASH.
To achieve the objectives, the results of the study will determine: (1) The pertinent structural element load-deflection characteristics that are to be modeled in order to obtain acceptably accurate structural and occupant responses.
(2)
The accuracy with which typical airframe structure load-deflection characteristics can be predicted using simplified analytical pro-
cedures.
The table of contents conveys the general plan of the report.
Background
information is presented initially to provide a proper perspective in relation to the objectives of the program. Volume I is presented in chronological order of the program milestones and includes: *
Survey of Technical Publications
"
Load Sensitivity Studies
"
Substructure Analysis
•
Substructure Test Program
*
Correlation
*
Program KRASH Refinement
*
Desien Procedures
The program results are presented in summary form prior to the conclusions.
Volume II contains supporting data for the details presented in Volume I. Volume II contains abstracts for the 60 technical reports and publications reviewed during the program. Included in the literature survey section is a matrix categorization of the reports by subject and applicable area of interest. fte test data is presented in its entirety, including accelerometer, load cell, strain gage deflection, and time (or Supporting data for analscan) histories for each of the twelve tests. Program KRASH refinements ysis and design procedures is also presented. which include standardization of input, modified input format, and user's guide are included.
6
SURVEY OF TECHNICAL PUBLICATIONS GENERAL DISCUSSION Technical publications were reviewed and their contents categorized in accordance with the vsriouq aspects of developing improved crashworthiness criteria and concepts to assist ir future reference as needed. A review and evaluation of 60 publications are presented herein. A complete listing of publications which comprise the literature survey is presented in Volume II. The literature is reviewed with regard "to the impact on developing designeroriented crashworthiness design procedures. In particular, emphasis is placed in the following areas: o
Simplified enalytical techniques
0
Experimental data
o
Design procedures and guidelines
*
Load-deflection data
o Energy absorption • Methods of analysis e Strain-rate sensitivity o Inertia effects EVALUATION All documents reviewed are evaluated for their applicability to each of the
subject areas listed above, the contribution of each is briefly stated, and a composite summary of the pertinent aspects is recorded. Volume II, which provides additional literature survey information, consists of a summary or abstract for each report and a literature survey subject index which contains a matrix categorization of the of reports by categorization lists the ccntents the technical reports. The matrix
number and associates each report with an area of specific content or applicability. All report numbers in this section refer to the reference numbers as they are listed under Literature Cited. Simplified Analytical Techniques The determination of load deformation characteristics of aircraft structure will enhance the ability of the designer to predict structure and occupant responses during severe yet survivable crashes. However, it is important that this data is presented in a manner which will aid the designer in developing the desired level of crashworthiness in the airframe structure. The data presented in the literature provides analytical procedures and/or empirical data which is applic ole to a great many types of structural ele-
7
ments.
Unfortunately, much of the data in its present form is not direct-
ly applicable for the following reasons: (i)
The analytical techniques require computer programs in order to formulate solutions.
(2)
The empirical data is not related to analytical procedures.
(3)
The data is for structural elements under a unique loading condition or boundary condition.
(4)
The data neglects effects sf inertia loads, strain rate, wave propagation and/or geometry changes.
There are several references, most notably 5, 6, 7, 9, 12, 18, 24 and 30, which povide information that can be incorporated into procedures that could serve as guidelines for designers. Several of the aforementioned references are texts (6, 7, 8, 9, 24, 30) which, although primarily limited to elastic and plastic behavior, cover a wide range of structural elements such as beams, columns, plates, rings, arches and composite structure. The data in these references provide basic information regarding yield point loads and methods by which the effects of plasticity, crppling and buckling can be taken into account. Experimental Data References 1, 4, 17, 19, 26, 28, 32, 33 and 35 pre-nt results of tests. The data is generally in the form of load versus d- lection, force versus time and stress versus strain. Reference 1 static and dynamic test re-
sults showed that for some typical aircraft structure, the load deflection
characteristics are the same for both static and dynamic loading conditions. Figure 1 shows a comparison of the results of the static and dynamic tests described in Reference 1. In Reference 4, load deflection curves for plate stringer panel configuraThe results of these panel tests, illustrated in tions are presented. Figure 2, show the energy to area ratio of the three configurations. Of particular importance is the relative absorption capabilities of the panels and their respective modes of failure. For example, the integrally machined panels produce a reasonably efficient energy-area ratio, but the load stroke performance is poor because the mode of failure is an explosive fracture in which the riser splits completely off the skin. In addition, the peak load of this latter configuration is much higher than the peak load for the other panels, which could result in higher transmitted loads. Reference (4) also presents load-deflection data for the lower frame of a typical fuselage segment obtained from drop tests. This test data is compared to analysis and is shown to differ substantially. Reference 10 presents data regarding buckling characteristics of perfect and imperfect circular cylindrical shells subjected to dynamic axial loading.
8
002 1ENERGY/AREA, IN.-LB/IN.2
6I
6=
.6 25
4,295
0.032
(a) ROLLED ZEE STRINGER
0
VERTICAL DEFLECTION, IN. 4,-o
36
ENERGY/AREA, IN.-LB/IN. 2
TYP 028 =9710
28
2.24 C.0
0o
4.0 TYP 0.82 (b)
0.2
0.
0.6
0.2
0.4
0.6
20-1-
0.040
1.19
12 0
ROLLED HAT STRINGER4
i.~~~2 20--o 6
0
,
VERTICAL DEFLECTION, IN.
0.58 2.00
0.095 0
(c)
=73 -
3.
30
0iur..09aeSti5e
1. 20
ENERGY/AREA, IN.-LB/IN.
50
aesLa-Dfeto
o.o65 INTEGRALLY STIFFENEL RISER
etDt
1 0
0
0.2
I
0.4
I
I
0.C
VERTICAL, DEFLECTION.,
Figure 2.
IN. Plate Stringer Compression Panels Load-Deflection Test Data (Reference 4).
9
2opeso
Close agreement was found between theory and experiment for both dynamic buckling strength and buckling mode shapes. Reference 17 presents data for simple structures like a clamped beam, circular ring, circular plate and hemisphere. The data is limited to deflection time histories and is for a specific material, loading condition, boundary condition and size of structure. In Reference 19, a comparison is made of experimental data with the results of a theoretical investigation of the plastic deformation of cantilevered beams subjected to impulsive loading. The test results for this particular study followed the general trend predicted by rigid-plastic theory. A conclusion drawn from the results is that an increase in yield stress with strain rate is the primary cause of the discrepancy between theory and experiment. Reference 26 presents results of an experimental investigation into the use of frangible metal tubing as an energy absorber. Tests were performed using a 1/5 scale model of a proposed manned spacecraft, and impact velocities reached 30 fps vertical and combined vertical (13.5 fps) and horizontal (18 fps). Results are presented as curves of force versus displacements. References 27, 32, 33, 34 and 35 present data for a one-shot energy absorber. References 32 through 35 provide data accumulated over a period of years for the Lockheed developed Dynasorb. The device has been tested for ground impact conditions as high as 112 fps. Materials tested include aluminum alloy 2024-T3, brass, copper, magnesium AZ-31B-F, steel (1015), steel (4130), cnd titanium. Energy curves showing load versus displacement are presented.
I*
Reference 01 presents results of experimental investigations of thin webbed plate-girder beams to determine shear loads required to cause web rupture and flange rivet failure. In all, twenty-seven beams were tested. Reference 38 discusses the impact response of curved box-beam columns Of significance are loadwith large global and local deformations. deflection curves for steel and aluminum under static and dynamic loading conditions (Figure 3). This paper concludes that the consideration of cross-section changes is necessary and important in predicting the impact response of beam columns with thin-walled box sections subjected to large deformation. The effects of strain rate sensitivity and strain wave propagation on the load-deflection curve are discussed. Reference 39 presents stress-strain curves for aluminum honeycomb and two foamed plastic structures. The characteristics of these three mrcerials axe examined to ascertain how they can be applied for human protection against accelerations encountered at low impact speeds (30 fps). Reference The ulti] presents data regarding modes of failures of multiweb beams. mate strength and buckling characteristics of multivweb beams have been investigated both experimentally and theoretically. The three primacy types of instobility that occur are (1) local buckling, (2) wrinklins, and (3) inIl is rioted that beams of solid cross sections typically terrivet buckling. exY Ait large plastic deformations as shown in Figure ,, while uit-up
10
STE L R36 SYMBOL
0_ X
-
P 25.6
MP
15.3 MPH
-
io.4 MPH
SV..
30- 20-
V
i
......
O."...Z
5.0 M
STATIC
-
10 0 0
1
2
3 4 5 EFLECTION IN.
6
ALMaIN 6061-T6 SpV.,D
SYMBOL
30-
30.2 MPH
25.6 MM 2
C.,0
15.4 MPH
Cl,
10.6 MPH
F14
10
T0
I
o
1
1
2
3 4 5 DEFLECTION, IN.
6
Figure 3. The Effects of Impact Speed on Dynamic Force-Deflection
Relationship of Curved Box-Beam Columns (Reference 38).
,~nu
II
PLATI
PASICG~
ELSTC
OF1
AwlTI
WCE
4
MNWWI DEFIECTION,9 Figure 4f.
Structural Behavior Typical of Solid Cross-Section
Beams of Ductile Material (Reference 39). BUCLM A
LENGTH CHARACTERISTIC OF BUCKLED ZONE
ELASTIC C
D
"ELASIC" B/