South African Journal of Animal Science 2017, 47 (No. 6)
Development and preliminary validation of an automatic digital analysis system for animal fibre analysis M. D. Quispe1, G. Benavidez2, R. A. Sauri1, J. J. Bengoechea1 & E. C. Quispe3# 1
MAXCORP Technologies. Calle Felipe de Zela 796, Los Ficus, Lima 46. Perú Escuela Académico Profesional de Zootecnia. Universidad Nacional de Trujillo. Av. Juan Pablo II S/N. Trujillo, La Libertad, Perú 3 Research Vice Rectorate. National University Autonoma de Chota. Calle José Osores 418, Chota, Cajamarca, Perú 2
(Received 2 February 2017; Accepted 7 August 2017; First published online 2 October 2017) Copyright resides with the authors in terms of the Creative Commons Attribution 4.0 South African License. See: http://creativecommons.org/licenses/by/4.0/za Condition of use: The user may copy, distribute, transmit and adapt the work, but must recognize the authors and the South African Journal of Animal Science.
______________________________________________________________________________________
Abstract New equipment was designed and developed to evaluate the physical characteristics of animal fibres, based on an automatic digital analysis system (ADAS) that allows the capture of a series of real-time images. In the development of the mechanical component, a design tool was used that allows visualization, simulation, and documentation of the product. At the same time, an Atmel (ATmega328) microcontroller was programmed to enable displacement of table coordinates, focus of images, and reading of the temperature and humidity of fibre samples and the environment. The fibre images were processed using artificial vision technology. Algorithms were also developed for edge detection to define the diameter of the fibre in pixels. Finally, calibration was carried out using a regression and standardized samples of wool tops. The authors then weighted the pixels to µm with a standard sample. A friendly graphical interface was developed for management of the built equipment, visualization of results, calibration, data and graphic export, configuration, among others. For validation, average fibre diameter (AFD), standard deviation (SD), coefficient of variation and comfort factor (CF) were compared with values of top wool patterns. Finally, the measurements of OFDA 2000 and FIBER-EC were compared using student t-test and Pearson correlation. The results of the validation showed that the confidence limit of FIBER-EC, which varied between 0.075 and 3.47 µm, is similar to that of the confidence limit of Sirolan Laserscan and OFDA 2000. Accuracy is better than the OFDA 2000 for fibre assessments less than 25 µm, which vary between 0.034 and 0.250 µm.
________________________________________________________________________________ Keywords: Accuracy, image digital processing, precision, technological, traits, wool #
Corresponding author:
[email protected]
Introduction Animal fibre measurement is important for animal production and genetic improvement, the pelt industry, merchandising, hand processing, and the textile industry (Arcidiácono et al., 2014). For these reasons, a lot of equipment has been developed to measure AFD, fibre diameter variability, fibre curvature index, clean yield, and colouration, among other attributes. The use of a projection microscope was developed in the 1927 to 1949 period, and is the only primary reference method for determining the diameter (IWTO 8). However, owing to the tediousness of the technique and the high costs incurred in achieving acceptable precision, other instruments have been developed that are more rapid, more precise, and more cost effective for routine measurement (Cottle & Baxter, 2015). The Airflow device was calibrated to estimate mean fibre diameter of wool, in both greasy and semiprocessed forms (Sommerville, 1998). But air flow measurement became obsolete because it lacked information, while the emergence of techniques such as gramimetry, optical diffraction, harmonics, radiometry, conductometry, sedimentometry, photometry and optical image analysis allowed a faster and more accurate analysis of fibres. Thus, CSIRO developed the Laserscan (Sommerville, 2002). However, image analysing technology, with the accelerated advance of the hardware and software technologies, was soon introduced to observe the configurations of textiles. This led to the rapid development of digitalization, informationization and intelligent analysis (Huang et al., 2013) of the metrology of animal, vegetable and human-made fibres (Glasbey & Horgan, 1995; Qi et al., 2005; Hirn & Bauer, 2006; Sommerville, 2007).
URL: http://www.sasas.co.za ISSN 0375-1589 (print), ISSN 2221-4062 (online) Publisher: South African Society for Animal Science
http://dx.doi.org/10.4314/sajas.v47i6.10
Quispe et al., 2017. S. Afr. J. Anim. Sci. vol. 47
823
Research is being carried out for objective measurement of several features simultaneously (Qi et al., 1995; Li et al., 2012) to improve precision and accuracy and reduce costs. In mid-1991, a new instrument called the Optical Fibre Diameter Analyser (OFDA 100) was introduced for measuring fibre diameter and SD. It is now under intensive evaluation throughout the world (Qi et al., 1994). For commercial reasons, manufacturers retained source codes for the programs for the OFDA. Consequently, modification of the programs is possible only by the manufacturers and their agents. Recently a new image-capture board and a charge-coupled device colour video camera have been added to the system with several compatible programming tools. These components provided the capability of developing programs to measure other fibre characteristics such as length, colour of scoured fibres, medullation in mohair, content of coloured fibres, and dehairing performance, resulting in an automatic image analysis system, which belonged to Texas Agricultural Experiment Station (Qi et al., 1995). Recently, a small portable and commercially available FibreLux micron meter was developed in South Africa (Technology Innovation agency (TIA), 2016)). A team of Texas A&M AgriLife research scientists at San Angelo evaluated the FibreLux, and compared its results with those of the OFDA 2000. The results showed that the FibreLux measures only the diameter and distribution of fibres of wool between 15 and 25 µm (Walker et al., 2015). Unfortunately, there is little information about the technology and method used in its construction. Qi et al. (1995) conducted a comparison of fibre diameter and SD of wool and mohair tops by projection microscope and OFDA. They found a difference in the SD, but none in fibre diameter in seven wool top samples. In forty samples of mohair tops they found differences in both of these attributes. Van Niekerk et al. (2004) performed a study to evaluate two techniques, namely OFDA and video image analysis (VIA), to measure the fibre diameter of cashmere and guard hair produced by South African indigenous goats. The guard hair diameter and cashmere diameter measured by the OFDA were on average 27 µm and 5 µm coarser, respectively, than those measured by VIA. A comparison of Airflow, Laserscan, and OFDA in superfine wool was performed by Sommerville (1997), who found differences between -0.67 and 0.90 µm. While Van Zyl (2000) worked with South African wool from different breeds, Heath et al. (2006) compared only the Airflow and Laserscan for South African wool. Unfortunately, there are no reports of comparisons of equipment using fibres of alpacas or llamas. Cottle & Baxter (2015) give 95% confidence limits (CLs), a statistic that evaluates the precision of various mean fibre diameter (MFD) measurement methods for raw wool, taken from the appropriate IWTO test methods. They showed CLs of ±0.33, ±0.21, and ±0.25 for samples with 15 µm for Air Flow, Laserscan and OFDA, respectively. CLs increased – decreasing the precision – according to the growing diameter of fibre samples ±0.92, ±0.85, and ±0.82 at 40 µm for each instrument. Marler et al. (2002) estimated 95% CL for OFDA 2000 (flank sample) and OFDA 2000 (mid side sample), Laserscan and Fleecescan. These had MFD 95% CL of ±1.41, ±1.28, ±1.02, and ±1.19 µm. The Australian Wool Testing Authority (AWTA, 1999) provides precision when Laserscan is compared with other methods. It showed CLs of ±0.60, ±0.41, and ±0.30 for samples with 20 µm for projection microscope, Airflow, OFDA and Laserscan, respectively, increasing the error to ± 1.40, ± 0.55, ± 0.66, and ± 0.64 µm at 35 µm for each instrument, respectively. Baxter & Marler (2004) compared AFD results from on-farm testing using OFDA and Fleecescan with standard, laboratory-issued results. They found that on-farm technologies gave similar results to those from laboratory fleece testing, but with slightly less precision. The more variable the FD range of the flock, the more helpful on-farm testing was in assisting with wool classing. Because there are differences in measurements between laboratories and instruments, IWTO (2013) stated that the use of OFDA 2000 in ‘100 mode’ requires a maximum tolerance of 0.3 µm when fibres are measured on an average up to 15 µm, increasing to 1.4 µm for fibres up 35.1 µm. ‘Tolerance’ is a term that is used to evaluate accuracy and is defined as a deviation from the true value. Several researchers have investigated the automated digital analysis system (ADAS) for evaluating the characteristics of fibres, such as Qi et al. (1995), Baltuano et al. (2005), Rojas (2006), Li et al. (2012), and Arcidiácono et al. (2014). In addition, Qi et al. (1995) and Li et al. (2012) determined how to assess fibre diameter accurately. However, few have taken the step towards marketing. It is also more expensive to purchase high technology equipment in South America. Taking these considerations into account, this work was carried out to achieve automated equipment that could provide objective information about animal fibres. This research considered three processes: design, development and validation in the field of advanced driver assisted systems (ADAS) equipment, using alpaca, llama, and Corriedale sheep fibre.
Materials and methods An ADAS called FIBER-EC, was developed at the electronic laboratory of Maxcorp Technologies SAC, Santa Anita, Lima, Perú, between July and August 2016. Validation testing was performed at the Fibres and Wool Laboratory of Universidad Nacional de Huancavelica, Perú.
824
Quispe et al., 2017. S. Afr. J. Anim. Sci. vol. 47
For the ADAS design, four sub systems were considered: mechanical, electronic, optical, and informatics. These sub systems were directed at measuring average fibre diameter (AFD) objectively in various regions of the fibres, which also allowed for measurement of the diameter distribution, later based on mathematical formulas to calculate the CVDF, SD, CF, PF, and spinning fineness (SF). Additionally, with the knowledge that the fibre has a characteristic profile for fineness (Brims et al., 1999; Mayhua et al., 2011), the equipment should perform a scan along every fibre of each sample to provide an XY coordinate table. Autodesk Inventor program (Zhu & Li, 2011) was used for the design to allow the visualization, simulation, and documentation of a digital prototype in three dimensions (3D). The designed pieces were transformed to stereo lithography format, and printing was performed with a 3D printer. Altium Designer was used to design the printed circuit board with other electronic components (Cheng et al., 2009), MATLAB was used for quick design of algorithms to calculate fibre diameter. Microsoft Visual 10 with OpenCV libraries was utilized for improvement, fast image processing and mathematical calculations (Andrews, 2012) of the inherent characteristics of animal fibres. Arduino language was used to program the microcontroller Atmega 328. Finally, all components were joined to achieve electronic characterization of animal fibre (FIBER-EC). The mechanical and electronic sub systems consisted of the industrial USB digital camera VTEX120CPGS, with sensor CMOS, maximum resolution of 1280 x 960, and speed programmable exposure through the manufacture’s SDK (Contrastech Co., Ltd) in a holder (Z coordinate) to capture the images to be processed; a zoom lens (objective and ocular) capable of 40x magnification engaged at the digital camera with spacers; an LED lamp as light source; an Atmel ATmega328 microcontroller, programmable to control four Nema 17 steppers (42SHD0217-24B), of which a motor (Z coordinate) served as micrometer and macrometer to adjust the focus of the image and the other engines for displacement of the XY coordinate table. The microcontroller also receives signals from the environmental humidity DHT22 sensor and infrared temperature MLX90614 sensor, which are connected to the I2C port. Those readings were then sent to a computer (laptop HP i3), where all signals were processed. The images captured by a preconfigured digital camera with its SDK were improved (pre-processing enhancement) by converting to grayscale (to distinguish poorly lighted fibres), followed by segmentation and smoothing, then images were binarized to distinguish background shows (1 = displayed, 0 = bottom). Morphological erosion and dilation operations were performed to remove unwanted contaminants and residues, thus providing homogenized images of the fibres. The skeletonization of the fibre images, a process that involved removing a pattern (fibre images) of the greatest possible number of pixels without affecting its general form, was carried out to obtain a line (skeleton) of a single pixel. Then it was connected, evaluated and located in the center and along of each fibre image. To find outgoing branches of the skeleton Hough transform was used to find straights along the curvature of the fibre samples from these images. Then, edge detection algorithms were developed to define the distance of the fibre diameter in pixels. The MATLAB software was used to develop the graphical user interface (GUI), where the measurements of fibre diameter and other characteristics were shown, but later the authors migrated to Microsoft Visual Studio 2010 (C++ y C#) with OpenCV libraries because of the complexity and time needed to process images (Andrews, 2012). When straights were found along the curvature of image samples of fibre, verification of vertical, horizontal or tangential orientation was determined mathematically. Then a perpendicular scanning was done on both sides and along these lines until a ‘0’ was reached, which is equal to the bottom and each side of fibre diameter. The sum of these points (pixels) was considered the total diameter of the fibre. The CVDF, SD, CF, PF and spinning fineness (SF) were calculated with mathematical equations defined by Quispe et al. (2013). The GUI was designed in C#, which provided six windows to show results, sample identifying data and graphics. Additionally, it was planned to implement certain icons to start assessment and other actions. It was also planned to manage the ADAS with a mouse click on icons or with the enter key. To evaluate accuracy, and repeatability – a statistic that assesses precision through the variation in measurements taken by a single instrument on the same item, under the same conditions, and in a short time – and the relationship between FIBER-EC and OFDA 2000, measurements were performed on 60 samples of alpaca, llama and sheep fibres from the middle ribs. Samples were washed in a sonic bath using Toluene Hexane mixture in an 8 : 2 ratio. Measurement of each sample was done 20 times consecutively. To determine the accuracy of measurements, ADAS measurements were compared with sample fibre patterns using fibres of known diameters (15.71, 18.47, 20.66, 24.29, 26.57, 31.65, 32.60 µm) from the Laboratory of Wool and Fibre of the Universidad Nacional Agraria La Molina, Lima. Measurements of each pattern were performed 10 times. Software R version 3.3.0 (R Core Team, 2014) was used to assess the accuracy of FIBER-EC. Statistical measurements consisted of standard deviation, standard error and confidence interval error at 95% confidence level (CL) of each group of 20 measurements in each of the 60 fibre samples. To assess
Quispe et al., 2017. S. Afr. J. Anim. Sci. vol. 47
825
accuracy, the absolute difference between the fibre diameter averages of 10 measurements done with the true value of each sample was calculated using the sample pattern. In addition, VCE version v.5.0 (Neumaier & Groeneveld, 1998) was used for the solution of the proposed random mode by restricted maximum likelihood for the six characteristics in the study. The T-student test for paired samples and the Pearson correlation coefficient were used to assess the differences between and relationships of measurements of FIBER-EC and the OFDA 2000.
Results Table 1 show some features of ADAS, which was designed and developed, and called FIBER-EC. This system has four parts, which interact to capture thousands of fibre images through scanning. These images are then processed through their own software to provide measurements of AFD, DV, PF, CF and SF. The processing speed of the computer, along with OpenCV libraries in the computation algorithm, allows more than 3200 fibres to be scanned in about 43 seconds.
Table 1 Information about some features of the FIBER-EC Specification N° Function/components
Description Detail
1
Principal function
2
Structure material
3
Quality of results
4 Kinematics
5
Electric energy
General
The system measures six characteristics of animal fibres: average fibre diameter, standard deviation, Six characteristics of coefficient of variation, variance, comfort and prickle Performance animal fibres factor. Its mechanical structure and vision system allow us to observe fibres that are measured in real time The structure is completely portable, designed to be Rectangular design. Portability carried easily from lab to farm. Maintaining accuracy Portable with two hands and calibration is easy and fast The price of the final equipment could be lower than Low cost of competitors (OFDA, Sirolan Laserscan), thus < US$5,000 production facilitating acquisition in product sectors at second and third level Corrosion resistant The material has a protective layer that prevents Corrosion material corrosion during fieldwork. It also support efforts resistant during transport. The total weight is 16.5 kg With low weight Measurements have a lower error for fine fibres Between 0.034 and ±1.317 Precision (0.034 for samples of 15 µm) and higher for fibres µm and hairs (1.317 for samples 32 µm) Between ± 0.075 and Measurements have low difference with the real ±0.347 µm Accuracy value for fine fibres. Difference is greater with coarse fibres 36 seconds Delay 36 seconds with snippets and 70 seconds Speed 70 seconds with staples The unit with which the displacement is handled has Displacement Micrometric precision a micrometer scale. Motors, gears, steps per minute Precision Actuators generate precise movements Screws, precision. Steps per minute 220V Enables use of car battery. It can be connected Electric directly to 220V power point. The current of the power source Battery actuators must not exceed 1.5A
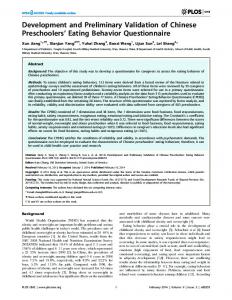
The GUI has six windows. The first controls the hardware (lighting fibre by an LED lamp, moving the camera stand microscope along the Z coordinate for focus and checking camera connection and microcontroller with SAAD). The second identifies and describes the sample, and shows the results of the fibre evaluation. The third calibrates the diameter of the fibres with a standard sample, starts the process of
826
Quispe et al., 2017. S. Afr. J. Anim. Sci. vol. 47
scanning, and exports data and images to Excel. The fourth window shows the last nine results of the evaluated samples. The fifth displays histogram and fibre diameter profile. The last shows the progress of the sample evaluation in real time (Figure 1).
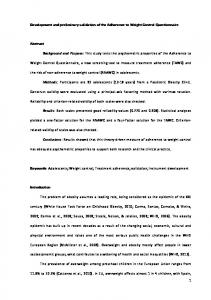
Figure 1 Graphical user interface of FIBER-EC The algorithm allows FIBER-EC to assess dirty fibres and prevents measurements at junctions among fibres because the images are cleaned and locked during image processing. The logic of this sub program was to eliminate regions whose areas were smaller or larger than pre-established values. In this way, small white dots, and small lines are removed. This process eliminates noise at the edges. Areas in regions in which pixels are between default values are copied into a new image for further evaluation (Figure 2).
Figure 2 Regions (in green) in which fibre diameter is calculated (detected Hough line) after image processing
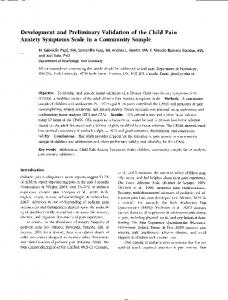
The structure is portable, namely 60 x 44 x 40 cm, with a maximum weight of 16.5 kg. The cover is made of aluminium polyethylene (ALPOLIC) material, whose functionality meets the requirements of a resistant container. Aluminium composite gives mechanical strength and corrosion resistance, and is lightweight. Its transmission mechanisms allow a lower degree of accuracy of 0.19 µm when measuring fine fibres less than 25 µm, in farm conditions. FIBER-EC is currently in version 3.2, having gone through versions 1.0, 2.0, 3.0, and 3.1 (Figure 3). The image-acquiring process is capable of capturing the fibres to be measured because of its optical,
Quispe et al., 2017. S. Afr. J. Anim. Sci. vol. 47
827
electronic, and mechanical and algorithm systems. It has a sample holder capable of holding slides of 7 x 7 cm and 7 x 20 cm, making it possible to measure snippets, long fragments and complete staples. When staples are measured, scans can be performed every 3, 5, or 10 mm (according to the user’s need), allowing users to save data from each scanning to obtain the profile fibre diameter and confidence interval. It can also allow one to see and export the bar graph of fibre measurements.
a
c
e
b
d
f
Figure 3 FIBER-EC in various versions: a) version 2.0; b) version 3.0; c) version 3.1 and d) version 3.2
Preliminary evaluation of the new programs for fibre characterization using FIBER-EC indicates that this equipment can be used for multiple fibre types, but should mainly be adequate for South American camelid fibre and sheep wool, and for fibres such as mohair, camel, rabbit hair, cow and human hair with high accuracy and precision. The results of four characteristics are shown in Table 2. The AFD and CF for each animal fibre, which were performed with OFDA 2000 and FIBER-EC, are similar. The variation is just from 0.59 to 0.89 µm and from 2.92 to 2.45%, respectively (between AFD and CF). Moreover, AFD and CF measurements carried out by OFDA 2000 are slightly higher than those obtained through the FIBER-EC, except for CF of sheep wool where the difference was higher (77.75 vs 63.85%). However, a difference of 9.04% was found in CVFD, with substantial variation between the types of equipment. The CVFD measurements carried out by OFDA 2000 have values around 19.00 % in various animal fibres (alpaca, llama and sheep) and lower compared than the FIBER-EC. Similar comparisons are given for SD.
Quispe et al., 2017. S. Afr. J. Anim. Sci. vol. 47
828
Table 2 Descriptive statistics and standard error (± SE) of AFD, standard deviation and coefficient of variation of AFD and comfort factor of alpaca, llamas and sheep fibres performed with FIBER-EC and OFDA 2000 Species and descriptive statistics
FIBER-EC
OFDA 2000
Difference*
- Average fibre diameter (AFD) ± EE (µm)
20.21 ± 0.49
20.80 ± 0.47
0.59
- Standard deviation of AFD ± EE (µm)
5.29 ± 0.09
3.88 ± 0.13
-1.41
- Coefficient of variation of AFD ± EE (%)
27.01 ± 0.45
19.04 ± 0.37
-7.97
- Comfort factor ± EE (%)
93.54 ± 1.01
96.12 ± 1.58
2.58
19.57 ± 0.95
20.46 ± 0.89
0.89
Alpaca (n = 40)
Llama (n = 10) - Average fibre diameter (AFD) ± EE (µm) - Standard deviation of AFD ± EE (µm)
5.50 ± 0.24
3.95 ± 0.30
-1.55
- Coefficient of variation of AFD ± EE (%)
28.54 ± 0.51
19.50 ± 0.94
-9.04
- Comfort factor ± EE (%)
93.60 ± 1.17
96.05 ± 1.15
2.45
28.57 ± 0.83
29.20 ± 0.77
0.63
Sheep (n = 10) - Average fibre diameter (AFD) ± EE (µm) - Standard deviation of AFD ± EE (µm)
5.64 ± 0.18
5.47 ± 0.29
-0.17
- Coefficient of variation of AFD ± EE (%)
21.95 ± 0.92
19.03 ± 0.82
-2.92
- Comfort factor ± EE (%)
77.75 ± 2.73
63.85 ± 4.85
-13.9
*Difference: average of the measurements obtained in the OFDA 2000 minus FIBER-EC
The statistical precision of FIBER-EC, standard deviation, standard error and confidence interval error increased with larger fibre diameter. The SD of measurements ranged from 0.121 to 0.559 µm and confidence interval error increased from 0.075 to 0.347 when standard samples were from 15.71 to 32.60 µm (Table 3).
Table 3 Statistical precision of FIBER-EC in measuring average fibre diameter, based on repeated measurements of seven standard wools and compared with alpaca, llama and sheep wool Factor
n
Standard deviation in µm
Standard error µm
Error confidence interval in µm
- 15.71 µm
10
0.121
0.038
0.075
- 18.47 µm
10
0.249
0.079
0.154
- 20.66 µm
10
0.216
0.068
0.134
- 24.29 µm
10
0.303
0.096
0.188
- 26.57 µm
10
0.393
0.124
0.244
- 31.65 µm
10
0.435
0.138
0.270
- 32.60 µm
10
0.559
0.177
0.347
- Alpaca
40
0.174
0.039
0.076
- Llama
10
0.284
0.063
0.123
- Sheep
10
0.288
0.064
0.125
Standard samples
Animal fibre samples
Quispe et al., 2017. S. Afr. J. Anim. Sci. vol. 47
829
In addition, values for the repeatability measurement of each sample for six characteristics performed with FIBER-EC are high. Repeatability ranged from 0.959 to 0.998, and standard error from 0.673x10⁻⁴ to 0.182x10⁻² (Table 4).
Table 4 Repeatabilities and standard error of average fibre diameter of alpaca fibre samples, with 20 measurements/sample with FIBER-EC Fiber characteristics
n
Repeatability
SE
Average fibre diameter
40
0.998
0.673 x 10
-4
Standard deviation of AFD
40
0.959
0.186 x 10
-2
Coefficient of variation of AFD
40
0.966
0.142 x10
Comfort factor
40
0.993
0.181 x 10
-3
Prickling factor
40
0.993
0.181 x 10
-3
Spinning fineness
40
0.992
0.323 x 10
-3
*AFD: Average fibre diameter;
-2
SE: Standard error
The accuracy of OFDA 2000 and and of FIBER-EC, using a set of eight standard samples with known AFD values (15.71 to 32.60 µm), is shown in Table 5. FIBER-EC had the best accuracy with fine fibres, but it decreased when coarser fibres were evaluated (±1.317 at 32.60 µm with standard top wool samples) in contrast with OFDA 2000. It does not have good accuracy with fine and thick fibres, because the differences with standard samples were higher than 0.20 µm, except for 26.57 and 31.65, where the differences were 0.136 and 0.078 µm, respectively.
Table 5 Accuracy of FIBER-EC and OFDA 2000, expressed as absolute difference between average fibre diameters performed with equipment and true value of sample pattern Standard samples
n
OFDA 2000
FIBER-EC
- 15.71 µm
10
0.724
0.034
- 18.47 µm
10
0.897
0.058
- 20.66 µm
10
0.233
0.312
- 24.29 µm
10
0.438
0.250
- 26.57 µm
10
0.136
0.670
- 31.65 µm
10
0.078
0.558
- 32.60 µm
10
0.680
1.317
-
The comparison focused initially on OFDA 2000 and FIBER-EC, since these are capable of working under farm conditions. Figures 4 and 5 compare AFD results from this equipment. Table 6 shows statistical Pearson correlation and linear regression.
Quispe et al., 2017. S. Afr. J. Anim. Sci. vol. 47
830
a
b
c
d
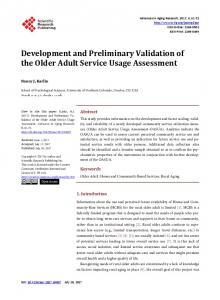
Figure 4 Images in real-time of alpaca (a, b) and mohair (c) fibres performed with FIBER-EC, plus images of alpaca fibre performed with OFDA 2000
15
20
25
Diameter evaluated with OFDA (microns)
30
Relationship OFDA2000 y FIBER-EC
20
25
30
Diameter evaluated with FIBER EC(microns)
Figure 5
Scatterplot of measurements of average fibre diameter performed with FIBER-EC and OFDA 2000 under farm conditions.
Table 6 Pearson correlations (r), their confidence interval and regression equation of measurements of FIBER-EC and OFDA 2000, with reference to four characteristics of alpaca, llama and sheep fibre Fiber characteristics
n
r
Confidence Interval of r
Regression
Average fibre diameter
60
0.989
[0.982 - 1.000]
AFDOFDA= -1.035+1.018*AFDFIBER-EC
Standard deviation of AFD
60
0.695
[0.565 - 1.000]
SDAFDOFDA= 3.748+0.394*SDAFDFIBER-EC
Coefficient of variation of AFD
60
0.382
[0.182 - 1.000]
CVAFDOFDA= 16.347+0.527*CVAFDFIBER-EC
Comfort factor
60
0.981
[0.981 - 1.000]
CFOFDA= -1.035+1.018*CFFIBER-EC
AFD: average fibre diameter; SDAFD: standard deviation of AFD; CVAFD: coefficient of variation of AFD; CF: comfort factor
Quispe et al., 2017. S. Afr. J. Anim. Sci. vol. 47
831
Agreement between the two instruments was good in FIBER-EC for AFD and FC, but not for SD and CVAFD. There were significant differences (P