een hoogwaardig gas met behulp van plasma wordt plasmavergassing .... It was found that the oxy-steam plasma gasification showed the highest material ..... Besides the well-established plasma spraying, plasma cutting and plasma welding.
Ontwikkeling en studie van verschillende numerieke plasmastraalmodellen en experimentele studie van plasmavergassing van afval Development and Study of Different Numerical Plasma Jet Models and Experimental Study of Plasma Gasification of Waste Nicholas Agon
Promotoren: prof. dr. ir. J. Vierendeels, ereprof. dr. ir. G. Van Oost, prof. dr. M. Hrabovský Proefschrift ingediend tot het behalen van de graad van Doctor in de Ingenieurswetenschappen Vakgroep Mechanica van Stroming, Warmte en Verbranding Voorzitter: prof. dr. ir. J. Vierendeels Faculteit Ingenieurswetenschappen en Architectuur Academiejaar 2014 - 2015
ISBN 978-90-8578-831-7 NUR 928, 952 Wettelijk depot: D/2015/10.500/75
Supervisors: Prof. dr. ir. Jan Vierendeels Prof. dr. ir. Guido Van Oost Prof. dr. Milan Hrabovský
Research lab: Department of Flow, Heat and Combustion Mechanics (FloHeaCom) Ghent University Sint-Pietersnieuwstraat 41 B–9000 Gent Belgium
Members of the exam committee: Chairman: Prof. dr. ir. Luc Taerwe
Secretary: Prof. dr. ir. Christophe Leys
Reading committee: Dr. ir. Jiří Jeništa Prof. dr. ir. Jan Pieters Prof. dr. ir. Lieve Helsen
Other members: Prof. dr. Milan Hrabovský Prof. dr. ir. Guido Van Oost Prof. dr. ir. Jan Vierendeels
Faculty of Engineering and Architecture, UGent
Faculty of Engineering and Architecture, UGent
Institute of Plasma Physics, Academy of Sciences of Czech Republic Faculty of Bioscience Engineering, UGent Faculty of Engineering, KU Leuven
Institute of Plasma Physics, Academy of Sciences of Czech Republic Faculty of Engineering and Architecture, UGent Faculty of Engineering and Architecture, UGent
This research was funded by the Agency for Innovation by Science and Technology in Flanders (IWT).
Acknowledgements
During my Master in Bioscience Engineering, I remember answering the question about my future outlook with: “The last thing I want do is start a PhD!”... This was before I got passionate about plasma gasification via my master thesis. Since I owe the introduction to this subject to Greet Van Eetvelde, who I admire for her inexhaustible drive and enthusiasm, she is (un)willingly responsible for changing my life course. Thanks to the encouragement and guidance of Prof.
Jan Pieters and Prof.
Guido Van Oost, I could continue in the dynamic and interesting field of plasma gasification after graduation by committing to a PhD. This 4 year and a half long challenge could not have been brought to a successful conclusion if it wasn’t for all the people around me who contributed in their own way to this achievement.
First of all, I would like to acknowledge my supervisors. Prof. Jan Vierendeels has been instrumental in guiding me through the maze of computational fluid dynamics, in which I frequently got lost. I am very grateful for his patience, willingness and perseverance in sharing his knowledge with me. Thank you for encouraging my critical thinking and for allowing me to grow as a research scientist. My sincere gratitude is also due to Prof. Guido Van Oost, who has been coaching me from the sideline since the very beginning of this journey. He is one of the few people with whom I can share my interest for plasma gasification. I enjoyed our interesting discussions on the topic, which from now on will probably have to take place in a tearoom in De Haan. Furthermore, he acted as an excellent liaison for the collaboration with the Institute of Plasma Physics (IPP) in Prague (Czech Republic). During the many visits to the IPP, Prof. Milan Hrabovský was always very accommodating. Thanks to him, I got the opportunity to participate in experiments and gain expertise in the field of plasma gasification.
i
Next, I would especially like to thank my girlfriend Maxine Frimpong. Her love and reassuring support, particularly in the final stretch, have helped me bring this manuscript to completion. I dearly appreciate you for being by my side during both the smooth and the rough periods of the PhD. Thank you for riding out this roller-coaster with me! Many thanks to my mother for her empathy and motivation which helped me find the strength to tackle the challenges along the way, and to my father for his advice and admonitions. I also want to thank my brothers, Michael and Thomas and my cousins, Tim, Ben and Rob, for the nice lunch breaks together, and their understanding: I still owe you a snowboard trip!
I had the pleasure of being surrounded by great colleagues, both in Ghent as in Prague, to whom I would like to express my gratitude. In the first years of the PhD, I was fortunate to share an office with Dieter Fauconnier who was always prepared to assist me with any problem presented. Later on, I could call on Joris Degroote with my questions, who might be the most intelligent and most friendly ‘helpdesk’ in the world. Many thanks to my other colleagues, office roomie Akil Osman and especially Alireza Rasekh, who I rather consider as a good friend than a colleague. Thank you for the great times over the course of my PhD, both at work as well as outside of work. Furthermore, I wish to acknowledge the help from Tanya Kavka, Oleksiy Chumak, Jiří Jeništa, Michal Hlina, Alan Mašláni and the late Miloš Konrád at the IPP. Big thanks to Anouk Bosmans for the pleasant collaboration and Rudi Smet for the occasional English proofreading. Finally, I want to thank all my friends for allowing our friendship to survive beyond the PhD years! Nicholas Agon Gent, September 2015
ii
Summary Samenvatting
Samenvatting
Thermische plasmas worden reeds uitgebreid toegepast in een waaier van veeleisende industriële toepassingen. De omzetting van organische materie tot een hoogwaardig gas met behulp van plasma wordt plasmavergassing genoemd. Oorspronkelijk was het doel van deze verwerking door plasmatoortsen uitsluitend om vaste stoffen zoals assen en metalen onschadelijk of vloeibaar te maken. De laatste jaren ligt de nadruk in de afvalsector op een circulaire economie, hetgeen geavanceerde verwerkingmethodes vereist met de mogelijkheid om secundaire grondstoffen te bekomen uit afvalstromen. Dit was een drijfveer voor de recente ontwikkeling van de plasmavergassingstechnologie voor afvalverwerking. Twee onderdelen met betrekking tot plasmavergassing worden in dit onderzoek bestudeerd, namelijk het modelleren van een plasma jet en de plasmavergassing van een afvalstroom met een hoge anorganische fractie (bv. ‘refuse-derived fuel’ of RDF). In het luik rond plasma modelleren worden eerst de karakteristieken van plasma en de uitdagingen in verband met het correct weergeven van de complexe fysische fenomenen in een stromingsmodel (CFD) beschreven. In een dergelijk model dienen onder andere de thermodynamische en transporteigenschappen van het gasmengsel van plasma en andere gassen correct toegewezen worden. Het correct berekenen van deze eigenschappen voor een uitgebreid gasmengsel is niet voor de hand liggend en daarom worden vaak mengwetten toegepast. Hoewel de accuraatheid van deze mengwetten reeds werd onderzocht, blijkt uit de literatuurstudie dat de invloed van de afwijkende waarden, bekomen door gebruik van mengwetten, op de berekende stromingspatronen nog niet werd bestudeerd. Met dit doel wordt een model van de plasma jet uit een gelijkstroom (DC) plasmatoorts in stikstof atmosfeer ontwikkeld. Dankzij de karakteristieken van de geselecteerde toorts, volgend uit de typerende combinatie van zowel waterals gas (argon) stabilisatie van de vlamboog, is deze toorts uitermate geschikt voor plasmavergassingsdoeleinden. Met deze modelopstelling worden drie CFD simulaties uitgevoerd die verschillen in de mate waarin mengwetten gebruikt v
worden voor de berekening van de thermofysische eigenschappen van het driedelig gasmengsel (Ar/H2 O/N2 ). Het eerste ‘mengmodel’ (model 1) past mengwetten toe tussen alle gassen. Model 2 berekent de eigenschappen van het tweedelig plasma gasmengsel (Ar/H2 O) afzonderlijk zonder mengwetten en combineert deze met de eigenschappen van stikstof aan de hand van mengwetten om de eigenschappen van het driedelige gasmengsel te bekomen. Het derde ‘mengmodel’ (model 3) berekent de thermofysische eigenschappen van het gasmengsel rechtstreeks en maakt geen gebruik van mengwetten. Het laatste model wordt ook wel het ‘full multicomponent’ model genoemd. Aan de hand van een vergelijking van deze drie simulaties op basis van de berekende snelheids-, temperatuurs- en concentratievelden, kan de invloed van de mengwetten kwantitatief onderzocht worden. De resultaten tonen aan dat de geschatte thermofysische eigenschappen aan de hand van mengwetten een grote invloed kunnen uitoefenen op de processen aan de rand van de jet (zoals de ontwikkeling van turbulente structuren en inmenging van andere gassen). De aanname, die vaak in de literatuur wordt gebruikt, dat de afwijkende waarden voor de transporteigenschappen berekend door mengwetten met beperkte accuraatheid (zoals die van Wilke, en Mason en Saxena) een verwaarloosbare bijdrage zouden leveren ten opzichte van de turbulente transporteigenschappen wordt weerlegd. De turbulentie in de hete zone van de plasma jet, dicht tegen de toortsuitlaat, is immers vaak beperkt. Daaruit volgt dat het samenspel tussen de thermodynamische en moleculaire transporteigenschappen bepalend is voor de ontwikkeling van de plasma jet.
Het tweede luik van het doctoraatsonderzoek betreft de plasmavergassing van afval. Plasmavergassing wordt eerst gesitueerd ten opzichte van andere conventionele thermochemische verwerkingsmethodes. Daarna worden de voor- en nadelen van het proces en de mogelijke eindtoepassingen van de vergassingsproducten besproken. Een uitgebreide oplijsting van alle huidige plasmavergassingsinstallaties is toegevoegd en in detail gedocumenteerd. Eén van de weinige academische plasmavergassingssystemen bevindt zich op het Institute of Plasma Physics (IPP) in Praag (Tsjechië). De experimenten met deze reactor hebben reeds een belangrijke bijdrage geleverd in dit onderzoeksgebied. De details van de opstelling en de diagnostiek van deze reactor worden in detail besproken. De eigenschappen van het materiaal (RDF) dat geselecteerd werd om de haalbaarheid van de plasma behandeling van een afvalstroom met een hoge anorganische fractie aan te tonen, worden besproken. Dit afvalmengsel werd bekomen na scheiding en voorbehandeling van huishoudelijk en industrieel afval afkomstig vi
uit een stortplaats. Verschillende combinaties van vergassingsmedia (CO2 , O2 en H2 O) werden toegevoegd aan het proces tijdens het experiment voor verschillende debieten van het materiaal (21.3 en 28.9 kg/u). De resultaten van negen verschillende casussen bestaan uit de samenstelling van het syngas, de energieverliezen in de toorts en via de reactorwanden en temperatuursmetingen langs de reactorwand. Aan de hand van deze variabelen wordt aangetoond dat het plasmavergassingsproces een syngas van hoge kwaliteit en met lage concentraties aan teer (132-543 mg/Nm3 ) kan produceren uit RDF. Uit de vergelijking tussen de gemeten samenstelling van het syngas en de theoretisch berekende samenstelling wordt de afwijking van thermodynamisch evenwicht nagegaan. De effecten van ‘equivalence ratio’ (ER), materiaaldebiet en type vergassingsmedium worden vervolgens onderzocht via vergelijkende analyses van de prestatiecriteria (zoals ‘carbon conversion efficiency’ (CCE), ‘CO yield’ en ‘H2 yield’) en energie-efficiënties van de verschillende casussen. De CCE voor plasmavergassing van RDF aan een debiet van 28.9 kg/u varieert voornamelijk tussen 82 en 87 %. De hoogste energie-efficiënties worden verkregen via plasmavergassing met water als vergassingsmedium, terwijl de O2 -H2 O casus de hoogste prestatiecriteria weergeeft. Verder wordt er aangetoond dat CO2 en H2 O als vergassingsmedia kunnen uitgewisseld worden zonder weerslag op de performantie van het process, op voorwaarde dat de ER constant gehouden wordt. Een vergelijking tussen de experimenten met RDF en vorige experimenten met biomassa wordt getoond waaruit voortkomt dat de grovere verdeling van de deeltjes, het hogere vochtgehalte en de hogere asfractie van het RDF een negatief effect op de efficiëntie van het proces hebben. Een tweede vergelijking wordt gemaakt tussen de huidige resultaten van de eentraps plasmavergasser met die van een tweetrapssysteem. Beide systemen vertonen een goede afbraak van teercomponenten en houden er elk een specifiek voordeel ten opzichte van elkaar op na. Enerzijds bezit het syngas bekomen via het eentrapsproces gunstigere karakteristieken (hogere CO en H2 concentraties en een hogere CO/CO2 verhouding), anderzijds slaagt het eentrapsproces er niet in om de anorganische fractie te verwerken tot een inerte verglaasde materie. Dit laatste werd wel succesvol gedemonstreerd door het tweetraps-plasmavergassingsproces. Plasmavergassing kan beschouwd worden als een veelbelovende verwerkingsmethode voor RDF dankzij de goede controle van de syngas samenstelling, de hoge kwaliteit van het syngas en de algemene flexibiliteit van het systeem.
vii
Summary
Thermal plasmas have been widely used in a large number of high-technological industrial applications. The conversion of organic matter to a high-quality syngas by using plasma torches is called plasma gasification. The original goal for this plasma treatment was to either melt or immobilize solid materials such as ash and metals, making them safe for disposal. The recent emphasis in the waste industry on a circular economy requires more advanced conversion technologies which yield improved resource recovery. This has triggered the recent development of the plasma gasification technology for waste treatment. In this work, two subjects associated with plasma gasification have been studied, i.e. plasma jet modelling and plasma gasification of refuse-derived fuel (RDF). The first part of the research related to plasma jet modelling is situated by outlining the details of thermal plasma systems and the challenges of modeling the complex physical phenomena involved.
An important issue arising from
the mixing of high-temperature plasma gas(es) with surrounding gas(es) is the correct estimation of thermodynamic and transport properties of the resulting gas mixture.
The use of mixing rules for the calculation of thermophysical
properties of a gas mixture is common practice. However, it was recognized that the influence of these approximations on the accuracy of the simulated flow field has not yet been quantitatively investigated. A model of the plasma jet from a direct current (DC) hybrid water/gas-stabilized torch, particularly suited for plasma gasification, issuing in nitrogen atmosphere has been developed. With this model case, three computational fluid dynamics (CFD) simulations were performed, which differ in the extent to which mixing rules are used for the calculation of the thermophysical properties of the ternary (Ar/H2 O/N2 ) gas mixture. The first model approach (model 1) estimates the properties of the gas mixture by using mixing rules with the temperaturedependent properties of each individual gas. The second model approach (model 2) calculates the properties of the plasma gas (Ar/H2 O) rigorously and combines them with those of nitrogen by using mixing rules to estimate the properties of ix
the ternary gas mixture. Model 3 represents the full multicomponent approach in which no mixing rules are used and the thermophysical properties of the gas mixture are calculated rigorously. The effect of the mixing rules for the calculation of gas mixture properties is evaluated through comparison of calculated temperature, velocity and gas concentration fields of the plasma jet flow. The results revealed that the use of approximate mixing rules can greatly influence the calculated flow of a plasma jet.
It was demonstrated that the
effect caused by deviations from the exact molecular transport properties by using low-accuracy mixing rules such as the one of Mason and Saxena for thermal conductivity is non-negligible. It is proven that the assumption of a negligible contribution of the laminar transport properties in relation to their turbulent counterparts (frequently postulated in literature), is not self-evident. In plasma jet modelling, the level of turbulence in the high-temperature region close to the torch exit is often low and the interaction of the thermophysical properties at the boundary of the jet in this quasi-laminar region determines to a great extent the onset of turbulence and hence the entrainment of surrounding gas.
The second subject studied in the PhD work is the plasma gasification of waste. The thermal plasma application in solid waste treatment is first put in relation to conventional thermochemical waste conversion methods. The advantages and challenges of plasma gasification are explained and the different possibilities for end-use of the products (syngas and slag) are listed. The state of the art of plasma gasification is illustrated by summarizing all the plasma gasification facilities currently operating in the world. The plasma gasification system at the Institute of Plasma Physics (IPP) in Prague (Czech Republic) is one of only a limited number of academic installations and has delivered significant contributions to this field of research. The configuration of this reactor system and details of its extensive diagnostics system are described. Refuse-derived fuel (RDF), a processed mixture of excavated municipal and industrial solid waste was selected as the feedstock to evaluate the performance of the in-flight plasma gasification process for materials with a high inorganic content. During the experimental run, different combinations of gasifying agents (CO2 , O2 and H2 O) were added to the reactor volume and the material was supplied at different mass flow rates (i.e. 21.3 and 28.9 kg h−1 ). The sets of experimental data consist of syngas composition and flow rate, energy losses from the torch and the reactor walls, and temperature distribution in the reactor volume. Nine experimental cases with different operating parameters were identified during steady x
state operation. The production of high-quality syngas with low levels of tar (132543 mg/Nm3 ) was demonstrated for all cases. The measured syngas composition was in good accordance with the calculated syngas composition in thermodynamic equilibrium. The effects of equivalence ratio, material feed rate and type of gasifying agent were investigated by comparing the performance criteria (carbon conversion efficiency, CO yield and H2 yield) and energy efficiencies of the different cases. The carbon conversion efficiency of plasma gasification with a RDF feeding rate of 28.9 kg h−1 ranges between 82 and 87 %. The highest registered cold gas efficiency and mechanical gasification efficiency are 57 % and 97 %, respectively. It was found that the oxy-steam plasma gasification showed the highest material conversion efficiency. Furthermore, it was found that for the same equivalence ratio, the H2 /CO ratio in the syngas can be inverted by interchanging CO2 with H2 O as gasifying agent without affecting the performance of the process. The lower performance of the RDF experiments compared to biomass experiments on the same plasma gasification system were attributed to the coarser particle size, higher moisture content and higher ash fraction of RDF. The comparative analysis between this single-stage plasma gasification experiment and two-stage plasma gasification of a similar waste material revealed advantageous characteristics (higher CO and H2 content and higher CO/CO2 ratio) for the syngas produced by the former system. The tar destruction efficiency is considered similar for both systems. The inorganic content is collected as a vitrified slag in the two-stage plasma gasification system, whereas a large portion of the residual material in the single-stage in-flight gasification system was recovered as particulates and only a small fraction of the inorganic fraction was vitrified in the wake of the plasma jet. It was concluded that the good control of the characteristics of the high-quality syngas and the overall flexibility of the system make plasma gasification a promising technology for the treatment of refuse-derived fuel.
xi
Contents
Acknowledgements
i
Samenvatting
v
Summary
ix
Contents
xiii
Abbreviations and Symbols
xvii
Introduction
1
Part I
–
Literature Study
1 Plasma
9
1.1
Definition and General Features . . . . . . . . . . . . . . . . . . . .
9
1.2
Classification of Plasma . . . . . . . . . . . . . . . . . . . . . . . .
10
1.2.1
Non-Thermal Plasma
. . . . . . . . . . . . . . . . . . . . .
11
1.2.2
Thermal Plasma . . . . . . . . . . . . . . . . . . . . . . . .
12
1.3
Plasma Forming Mechanisms . . . . . . . . . . . . . . . . . . . . .
13
1.4
Thermal Plasma Torch Characteristics . . . . . . . . . . . . . . . .
15
1.4.1
Type of Plasma Discharge . . . . . . . . . . . . . . . . . . .
15
1.4.1.1
Alternating Current (AC) . . . . . . . . . . . . . .
15
1.4.1.2
Radio Frequency (RF) . . . . . . . . . . . . . . . .
16
1.4.1.3
Direct Current (DC) . . . . . . . . . . . . . . . . .
16
1.4.2
Torch Operating Mode . . . . . . . . . . . . . . . . . . . . .
17
1.4.3
Type of Electrodes . . . . . . . . . . . . . . . . . . . . . . .
17
1.4.4
Arc Stabilization Mechanisms . . . . . . . . . . . . . . . . .
18
1.4.4.1
Gas Flow Stabilization . . . . . . . . . . . . . . .
19
1.4.4.2
Water-Stabilized Torches . . . . . . . . . . . . . .
20
xiii
Contents 1.4.4.3
Hybrid Water/Gas-Stabilized Torches . . . . . . .
2 Plasma Gasification 2.1
25
Background . . . . . . . . . . . . . . . . . . . . . . . . . . . . . . .
25
2.1.1
Incineration . . . . . . . . . . . . . . . . . . . . . . . . . . .
27
2.1.2
Pyrolysis . . . . . . . . . . . . . . . . . . . . . . . . . . . .
27
2.1.3
Conventional Gasification . . . . . . . . . . . . . . . . . . .
28
2.1.3.1
Gasification Process . . . . . . . . . . . . . . . . .
28
2.1.3.2
Oxidizing Medium . . . . . . . . . . . . . . . . . .
30
2.1.3.3
Type of Configuration . . . . . . . . . . . . . . . .
31
2.2
Definition and General Features . . . . . . . . . . . . . . . . . . . .
32
2.3
Advantages . . . . . . . . . . . . . . . . . . . . . . . . . . . . . . .
34
2.4
Disadvantages . . . . . . . . . . . . . . . . . . . . . . . . . . . . . .
36
2.5
Product Applications . . . . . . . . . . . . . . . . . . . . . . . . . .
36
2.5.1
2.5.2 2.6
2.7
Syngas . . . . . . . . . . . . . . . . . . . . . . . . . . . . . .
37
2.5.1.1
Thermal Valorization . . . . . . . . . . . . . . . .
37
2.5.1.2
Chemical Valorization . . . . . . . . . . . . . . . .
41
Slag . . . . . . . . . . . . . . . . . . . . . . . . . . . . . . .
44
State of the Art . . . . . . . . . . . . . . . . . . . . . . . . . . . . .
45
2.6.1
Industry . . . . . . . . . . . . . . . . . . . . . . . . . . . . .
45
2.6.2
Academic . . . . . . . . . . . . . . . . . . . . . . . . . . . .
57
Conclusions . . . . . . . . . . . . . . . . . . . . . . . . . . . . . . .
58
3 Plasma Modelling 3.1 3.2
3.3
3.4
63
Background . . . . . . . . . . . . . . . . . . . . . . . . . . . . . . .
63
Physical Phenomena . . . . . . . . . . . . . . . . . . . . . . . . . .
64
3.2.1
Fluid Models . . . . . . . . . . . . . . . . . . . . . . . . . .
64
3.2.2
Turbulence . . . . . . . . . . . . . . . . . . . . . . . . . . .
65
3.2.3
Radiation . . . . . . . . . . . . . . . . . . . . . . . . . . . .
66
3.2.4
Diffusion
. . . . . . . . . . . . . . . . . . . . . . . . . . . .
67
Modelling Aspects . . . . . . . . . . . . . . . . . . . . . . . . . . .
68
3.3.1
Dimension of Space
. . . . . . . . . . . . . . . . . . . . . .
68
3.3.2
Computational Domain . . . . . . . . . . . . . . . . . . . .
68
3.3.3
CFD Software
. . . . . . . . . . . . . . . . . . . . . . . . .
69
3.3.4
Time Dependency . . . . . . . . . . . . . . . . . . . . . . .
70
Thermophysical Properties 3.4.1
xiv
21
. . . . . . . . . . . . . . . . . . . . . .
70
Different Mixing Rules . . . . . . . . . . . . . . . . . . . . .
72
3.4.1.1
Density . . . . . . . . . . . . . . . . . . . . . . . .
72
3.4.1.2
Specific Heat . . . . . . . . . . . . . . . . . . . . .
73
Contents
3.5
3.4.1.3
Viscosity . . . . . . . . . . . . . . . . . . . . . . .
73
3.4.1.4
Thermal Conductivity . . . . . . . . . . . . . . . .
74
Conclusions . . . . . . . . . . . . . . . . . . . . . . . . . . . . . . .
75
Part II – Mixing Rules
CFD Modelling of Plasma Jet - Effect of
4 Numerical Modelling of Ar/H2 O Plasma Jet with Different Mixing Models
79
4.1
79
4.2
4.3
Introduction . . . . . . . . . . . . . . . . . . . . . . . . . . . . . . . Model Set-Up . . . . . . . . . . . . . . . . . . . . . . . . . . . . . .
81
4.2.1
Computational Domain . . . . . . . . . . . . . . . . . . . .
82
4.2.2
Boundary Conditions
. . . . . . . . . . . . . . . . . . . . .
83
Description of the Mixing Models . . . . . . . . . . . . . . . . . . .
89
4.3.1
Model 1 . . . . . . . . . . . . . . . . . . . . . . . . . . . . .
91
4.3.2
Model 2 . . . . . . . . . . . . . . . . . . . . . . . . . . . . .
91
4.3.3
Model 3 . . . . . . . . . . . . . . . . . . . . . . . . . . . . .
91
4.4
Model Assumptions and Equations . . . . . . . . . . . . . . . . . .
94
4.5
Results . . . . . . . . . . . . . . . . . . . . . . . . . . . . . . . . . .
97
4.6
Discussion . . . . . . . . . . . . . . . . . . . . . . . . . . . . . . . . 102
4.7
Conclusion
Part III
. . . . . . . . . . . . . . . . . . . . . . . . . . . . . . . 113
–
Thermal Plasma Processing of Waste
5 Single-Stage Plasma Gasification of Refuse-Derived Fuel
119
5.1
Background . . . . . . . . . . . . . . . . . . . . . . . . . . . . . . . 119
5.2
Materials and Methods . . . . . . . . . . . . . . . . . . . . . . . . . 125 5.2.1
The Reactor System . . . . . . . . . . . . . . . . . . . . . . 125
5.2.2
Refuse-Derived Fuel (RDF) Characteristics . . . . . . . . . 127
5.2.3
Procedure for Gas Tar Analysis . . . . . . . . . . . . . . . . 128
5.2.4
Procedure for Residual Ash Analysis . . . . . . . . . . . . . 128
5.2.5
Calculation of the Theoretical Gasification Energy from Thermodynamic Equilibrium . . . . . . . . . . . . . . . . . 128 5.2.5.1
Heat of Formation of Ash . . . . . . . . . . . . . . 129
5.2.5.2
Heat of Formation of RDF . . . . . . . . . . . . . 130
5.2.5.3
Heat of Formation of H2 O as Moisture in RDF . . 131
5.2.5.4
Heat of Formation of H2 O from Plasma . . . . . . 131
5.2.5.5
Heat of Formation of H2 O as Gasifying Agent . . 132 xv
Contents
5.3
5.4
5.2.5.6
Heat of Formation of Syngas . . . . . . . . . . . . 132
5.2.5.7
Sensible Heat of Syngas . . . . . . . . . . . . . . . 134
5.2.5.8
Sensible Heat of Ash . . . . . . . . . . . . . . . . . 134
Results and Discussion . . . . . . . . . . . . . . . . . . . . . . . . . 137 5.3.1
Experimental Parameters . . . . . . . . . . . . . . . . . . . 137
5.3.2
Theoretical Results . . . . . . . . . . . . . . . . . . . . . . . 139
5.3.3
Syngas Composition . . . . . . . . . . . . . . . . . . . . . . 141
5.3.4
Performance Yields and Energy Efficiencies . . . . . . . . . 147
5.3.5
Tar Analysis . . . . . . . . . . . . . . . . . . . . . . . . . . 152
5.3.6
Residue Analysis . . . . . . . . . . . . . . . . . . . . . . . . 153
5.3.7
Comparison with Single-Stage Biomass Plasma Gasification 154
5.3.8
Comparison with Two-Stage RDF Plasma Gasification . . . 158
5.3.9
Comparison with Conventional RDF Conversion Methods . 160
Conclusions . . . . . . . . . . . . . . . . . . . . . . . . . . . . . . . 162
Conclusions and Future Work
167
Appendices
175
A Expression for the Diffusion Flux in a Three-Component Mixture in Terms of Binary Combined Diffusion Coefficients . . . . . . . . . . . 175 B Comparison of the Position of the Dissociation Peaks Between Thermal Conductivity and Heat Capacity
. . . . . . . . . . . . . . 179
List of Figures
183
List of Tables
187
List of Publications
189
Bibliography
191
xvi
Abbreviations and Symbols
Abbreviations AC
Alternating Current
AER
Absorption Enhanced Reforming
APP
Advanced Plasma Power
ASCR
Academy of Sciences of the Czech Republic
ASR
Automobile Shredder Residue
BFB
Bubbling Fluidized Bed
BM
Biomass
BTEX
Benzene, Toluene, Ethylbenzene and Xylene
BTX
Benzene, Toluene and Xylene
CCE
Carbon Conversion Efficiency
CEN
European Committee for Standardization
CFB
Circulating Fluidized Bed
CFC
Chlorinated Fluorocarbons
CFD
Computational Fluid Dynamics
CGE
Cold Gas Efficiency
CHP
Combined Heat and Power
DC
Direct Current
DCM
Dichloromethane
DME
Dimethyl Ether
DNS
Direct Numerical Simulation
DOM
Discrete Ordinates Method
ELFM
Enhanced Landfill Mining
ER
Equivalence Ratio
FTS
Fischer-Tropsch synthesis
GC
Gas Chromatography
GC-FID
Gas Chromatography with Flame Ionization Detector
GFC
Gas Flow Controller xvii
GHV
Gross Heating Value
HTFT
High Temperature Fischer-Tropsch
IGCC
Integrated Gasification Combined Cycle
IGFC
Integrated Gasification Fuel Cell
IPP
Institute of Plasma Physics
IW
Industrial Waste
LCE
Local Chemical Equilibrium
LES
Large Eddy Simulation
LHV
Lower Heating Value
LILRW
Low and Intermediate-Level Radioactive Waste
LTE
Local Thermodynamic Equilibrium
LTFT
Low Temperature Fischer-Tropsch
MAS
Mixed Alcohol Synthesis
MGE
Mechanical Gas Efficiency
MPTS
Mobile Plasma Treatment System
MS
Mass Spectrometry
MSW
Municipal Solid Waste
MTBE
Methyl Tetra Butyl Ether
NCV
Net Calorific Value
NEC
Net Emission Coefficient
NLTE
Non Local Thermodynamic Equilibrium
ODS
Ozone Depleting Substances
PAHWTS
Plasma Arc Hazardous Waste Treatment System
PAWDS
Plasma Arc Waste Destruction System
PCB
Polychlorinated Biphenyl
PCDD
Polychlorinated Dibenzo-p-dioxins
PCDF
Polychlorinated Dibenzofurans
PDMR
Plasma Direct Melting Reactor
PEM
Plasma Enhanced Melter
PEPS
Plasma Energy Pyrolysis System
PODS
Plasma Ordnance Demilitarization System
POP
Persistent Organic Pollutant
PRRS
Plasma Resource Recovery System
PTDR
Plasma Thermal Destruction & Recovery
RANS
Reynolds-Averaged Navier Stokes
RDF
Refuse-Derived Fuel
RMS
Root-Mean-Square
RF
Radio Frequency xviii
RTE
Radiative Transfer Equation
S
Soret effect
SI
Spark Ignition
SMR
Steam Methane Reforming
SPA
Solid Phase Adsorption
SPE
Solid Phase Extraction
SOFC
Solid Oxide Fuel Cell
SRF
Solid Refuse Fuel
SSW
Sewage Sludge Waste
TF
Thermo-field
UDF
User-Defined Function
UV
Ultraviolet
VITO
Flemish Institute for Technology Research
VOC
Volatile Organic Compound
VUV
Vacuum Ultraviolet
WPC
Westinghouse Plasma Corporation
WtE
Waste-to-Energy
WtM
Waste-to-Material
YSZ
Yttria-Stabilized Zirconia
Symbols a
Subscript to an element in the chemical formula of
-
reactant A
Substitute chemical notation for ash
-
A
Surface of the plasma column cross section
m2
B
Magnetic field
T
CFL
Courant-Friedrichs-Lewy number
-
c
Speed of sound
m s−1
Cp
Specific heat at constant pressure
J kg−1 K−1
Dij
Binary diffusion coefficient
m2 s−1
DiT
Thermal diffusion coefficient of species i
g m−1 s−1
T Dij
Combined temperature diffusion coefficient
g m−1 s−1
x Dij
Combined ordinary diffusion coefficient
m2 s−1
e
Electron
-
e
Electronic charge
C
E
Specific total energy
J kg−1 xix
Ef
Energy content from enthalpy of formation
kJ/kgRDF
Egas
Energy required for complete gasification of RDF
kJ/kgRDF
Eq
Energy content from sensible heat
kJ/kgRDF
�
Dissipation rate of turbulent kinetic energy
m2 s−3
�N
Net emission coefficient
W m−3 sr−1
η
Thermal torch efficiency
%
F
Flow rate
slm or ml min−1
g
Gravity
m s−2
G
Conductance
S
h
Enthalpy
J kg−1
Hf °
Standard enthalpy of formation
kJ mol−1
I
Current
A
j
Current density
A m−2
Ji
Mass flux of species i
kg m−2 s−1
k
Thermal conductivity
W m−1 K−1
k
Turbulent kinetic energy
J kg−1
kB
Boltzmann Constant
J K−1
l
Length
m
m
Mass
kg
m ˙
Mass flow rate
g min−1 or kg h−1
M
Molecular weight
g/mol
mi
Average molar mass of the heavy species of gas i
g/mol
µ
Dynamic viscosity
kg m−1 s−1
µ0
Permeability of free space
H m−1
µt
Turbulent viscosity
kg m−1 s−1
n
Molar amount
mol
N
Total number density
m−3
nash
Number of ash components
-
ne
Electron number density
m−3
ni
Number density of gas i
m−3
nprod
Number of products in the full oxidation reaction of
-
RDF nRDF
Number of elements in the generic formula for RDF
-
nSG
Number of syngas components
-
p
Pressure
Pa
P
Power
kW
Pstatic
Static or gauge pressure
Pa
q
Coefficient to the products of a chemical reaction
mol/molRDF
xx
r
Radial position
m
r
Molar ratio of gasifying agents
-
R
Net energy loss by radiation
W m−3
R
Torch radius
m
ri
Net rate of production of species i
kg m−3 s−1
Rp
Absorption radius in the NEC method
m
ρ
Density
kg m−3
Sct
Turbulent Schmidt number
-
σ
Electrical conductivity
S m−1
t
Time
s
T
Temperature
K
TH
Temperature of the heavy species
K
τ
Stress tensor
-
U
Potential difference
V
v
Velocity
m s−1
Vm
Molar volume at standard conditions
l mol−1
wH2 O
Moisture content
dry wt%
wi,ash
Normalized weight fraction of ash component i
-
excluding P2 O5 and SO3 x
Molar fraction
-
y
Mass fraction
-
Y
Mass fraction
-
z
Coefficient to oxygen in a chemical reaction
mol/molRDF
Units A
Ampere
C
Coulomb
J
Joule
kt
Kilotonne
Pa
Pascal
S
Siemens
slm
Standard litres per minute
T
Tesla
tpd
Tonnes per day
tpy
Tonnes per year
tph
Tonnes per hour xxi
vol%
Volumetric percent
W
Watt
wt%
Weight percent
Subscripts 0
Centreline
C
Carbon
e
Electron
(g)
Gas
H
Hydrogen
i
Species i
in
Inlet
j
Species j
JH
Joule heating
(l)
Liquid
mix
Gas mixture
req
Required
SG
Syngas
t
Turbulent
w
Wall
Superscripts °
Standard conditions
(2)
Binary gas mixture
(3)
Ternary gas mixture
xxii
Introduction
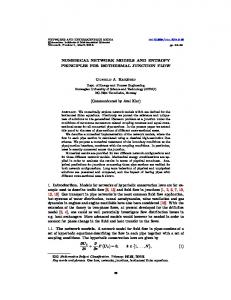
Problem statement The intense research and development efforts in plasma research since the 1960s are allowing plasma to continuously find its way into new fields of applications. Besides the well-established plasma spraying, plasma cutting and plasma welding techniques, thermal plasma materials processing applications also include the melting of metals and the vitrification of incinerator ashes. The recent focus on resource recovery in the waste industry (i.e. material recuperation and/or energy valorization) has triggered the search for more advanced waste treatment technologies, in which thermal plasma treatment has been recognised as a promising technology. Thermal plasma technology has several advantages over conventional waste elimination technologies (incineration in particular) which can allow viable resource recovery from non-conventional sources like municipal solid waste (MSW) and industrial waste (IW) through the production of synthetic gas (syngas). Hence, the thermochemical conversion of a wide variety of waste materials by plasma pyrolysis (in absence of oxygen) and by plasma gasification (i.e. by adding controlled amounts of oxygen) has been studied with ever-growing interest over the last 15 years. Within the scope of these evolutions, the Hybrid Plasma Thermal Gasification & Vitrification research- and development project was erected at the Department of Thermal Plasma of the Institute of Plasma Physics (IPP) of the Czech Academy of Sciences in Prague (Czech Republic) under impulse and in close collaboration with the Faculty of Engineering of Ghent University in 2004. A picture of the pilot-scale plasma gasification reactor which was built is shown in Figure I.1. This system is equipped with the IPP’s signature DC hybrid plasma torch, ideally suited for materials treatment thanks to its high-temperature, high enthalpy flow at low mass flow rates. Through a great number of experiments, the research on this system has significantly contributed in showing a proof of concept for the performant and 1
Introduction
Figure I.1: Picture of the plasma gasification reactor at the IPP during operation environmentally-sound treatment of waste by the innovative plasma gasification technology. Most of the materials treated (e.g. pure plastics or biomass) contain almost exclusively organic components. Considering the distinct advantages of plasma treatment, such a system is more likely to be employed for the conversion of more difficult waste streams.
Therefore, it is necessary to validate the
performance of the system for waste streams with a significant inorganic content.
Generally, the main challenges in further development and optimization of the process are identifying the effects of process parameters and operating conditions and demonstrating reproducibility of the results. These complications can only be removed by trial and error methods through repeated black-box experimentation. Unfortunately, plasma-based experiments are time consuming and costly (mainly because of the large amount of electricity used).
Ruj
and Ghosh [164] are among many researchers who therefore put forward that modelling of plasma gasification systems is much required. 2
Babu [9] also
Introduction concluded that the capability of describing the process by kinetic modelling and simulation would be useful to predict the product gas concentration for various operating conditions and for a variety of feed mixtures. The overall purpose of the numerical modelling of a plasma gasification system is to improve the efficiency of the process through enhanced process control and to optimize the design.
A lot of the attempts at modelling the plasma gasification process found in literature are limited to a thermodynamic analysis by an equilibrium model. Mountouris et al. [130] developed the GasifEq model which aims at predicting the performance of the plasma gasification process through detailed energy and exergy analysis. In the validation of the equilibrium model with results from experiments, non-negligible deviations from the experimental values can be observed. The indication by Montouris et al. [130] that this is caused by the fact that equilibrium might not be attained in the experiments, illustrates the need for a more comprehensive fluid dynamic modelling approach. The incorporation of the effect of the flow field on the simulation results was also suggested as a next step from equilibrium modelling by Wang et al. [198]. The starting point in the computational fluid dynamic (CFD) modelling of plasma gasification is the accurate calculation of the plasma flow. The correct prediction of the velocity, temperature and concentration fields of the plasma jet exiting the torch is important since it directly influences any physical process taking place downstream. Nevertheless, the effect of the description of a plasma gas mixture and the connected thermophysical properties calculation have not yet been the subject of a quantitative study.
Research objectives In this work, the goal is first to develop a CFD model of the plasma jet of the above-mentioned hybrid-stabilized plasma torch. This plasma model can then serve as the basis for a universal in-depth analysis of the effect of the estimation of thermophysical properties of a ternary plasma gas mixture on the threedimensional (3D) simulated flow field. The second objective is to analyse the feasibility of treating waste materials with a high inorganic content in the plasma gasification system at the IPP.
3
Introduction
Thesis outline The first four chapters of the manuscript, grouped in Part I, present a literature study on the most important aspects related to the research. Chapter 1 first provides background information about plasma. After explaining the general features, the focus is put on thermal plasmas and the characteristics of thermal plasma torches. Conventional gasification is the topic of Chapter 2, in which the technique is first situated among other thermochemical conversion methods. Next, the chemistry of the gasification process is summarized and an overview of the different elements of conventional gasification technology is given. Chapter 3 is the culmination of the subjects of the two previous chapters, discussing plasma gasification. The added value of plasma to the gasification process and the consequent distinct features and (dis)advantages are presented. The possible end-uses of the products from a plasma gasification system, with the emphasis on syngas are also elaborated upon. Finally, a comprehensive list is given of all currently operating plasma gasification facilities in the world. Details of the plasma gasification technology providers, the treated material and the output of these plants are discussed and summarized. The last chapter of the literature study, Chapter 4, explains the different aspects of numerical modelling of plasma (jets). Special emphasis is put on the calculation of thermodynamic and transport properties and the use of mixing rules for multicomponent plasma gas mixtures.
Part II encompasses Chapter 5, which deals with the research related to plasma jet modelling. The modelling approach to the DC hybrid water/gas-stabilized plasma torch serving as the model case for the CFD simulations is explained. Then, the set-up of three plasma jet models which differ in the method for calculating thermophysical properties by the extent to which mixing rules are used, is presented. Through comparative analysis of the features of the calculated flow fields, the influence of the use of mixing rules on the accuracy of the simulation results is determined.
Chapter 6 in Part III presents the contribution to the performance evaluation of the plasma gasification unit located at the IPP. The experimental set-up of the system is first described in detail. Next, the experimental parameters and procedures used in the experiments on the plasma gasification reactor with refuse-derived fuel (RDF) using different combinations of oxidizing media are 4
Introduction given. The results from these experiments are evaluated by mass- and energy balances and compared with plasma gasification experiments with other materials, with other plasma gasification set-ups and with conventional gasification of RDF.
Finally, overall conclusions of the research work and some thoughts about future perspectives for plasma gasification and plasma modelling are given.
5
One Literature Study
Chapter
1 Plasma
1.1
Definition and General Features
Plasma as a phenomenon was first described in 1879 by the English physicist Sir William Crookes, but it was only until 1929 that it was given the name plasma by Dr. Irving Langmuir [190]. Although natural plasmas on Earth are very exceptional (e.g. lightning and northern light), it is by far the most common state of matter, estimated to make up 99 % of the visible universe both by mass and by volume. Plasma is described as the fourth state of matter, next to the solid, liquid and gas states. In forming a plasma, the molecules of a gas get sufficient energy and dissociate. If the thermal motion is strong enough, more and more atoms will be split into electrons and ions until the gas becomes ionized and is transformed into a plasma. In contrast to other phase transitions, ionization does not occur at a precise temperature, but happens gradually over a large temperature interval. Plasma is defined as a quasi-neutral ensemble of positively and negatively charged particles and neutral particles, featuring collective behaviour, because local charge separation and electrical currents create additional electric and magnetic fields which, together with externally imposed fields, determine the equations of motion of the individual particles [190]. In other words, plasma resembles a high temperature gas with freely moving charged particles (positive and negative ions), neutral particles in ground and 9
1. Plasma exited states, high-mobility electrons and photons. In spite of the presence of positive and negative particles it remains an electrically neutral medium. This property is known as quasi-neutrality. In contrast to a normal gas with electrically neutral particles, the charged particles make the plasma electrically conducting. Plasma is a source of concentrated energy, positive and negative ions, highly active radicals and intense radiation, which leads to complicated physical phenomena.
1.2
Classification of Plasma
Density and temperature are the two most important parameters characterizing a plasma. The temperature (or kinetic temperature) of a plasma is defined by the average kinetic energy of a particle (molecule, atom, ion or electron), i.e. 1 ¯2 3 mv = kB T 2 2
(1.1)
1 where m is the mass of the particles, v¯2 is defined by (v¯2 ) 2 , which is the root
mean square speed of the particle, kB is the Boltzmann constant and T represents the absolute temperature (K). It is clear from this equation that the temperature is dependent on a mean speed. In a plasma, the speed of the particles at equilibrium is not unique but follows a Maxwell-Boltzmann distribution. Plasmas can be classified into different categories in terms of electron temperatures and electron densities (see Figure 1.1). Extreme conditions in terms of electron density and temperature exist in thermonuclear fusion plasmas with temperatures above 106 K and as high as 108 K [18]. These plasmas, also called ‘hightemperature plasmas’, imply that all species (electrons, ions and neutral species) are in a thermal equilibrium state. Besides thermonuclear fusion plasmas, a distinction is made between thermal and non-thermal plasmas. Consistent with the previously mentioned terminology, these two categories can also be referred to as ‘low-temperature plasmas’ or gas discharges. Thermal plasmas (hot plasmas) are characterized by their high-energy densities and the equality between the temperatures of the heavy particles TH and those of the electrons Te . The thermodynamic state of the plasma approaches local thermodynamic equilibrium (LTE) and these plasmas are therefore also called quasi-equilibrium plasmas. Non-thermal plasmas (cold plasmas) on the other hand are characterized by their lower energy densities and by the large difference between the electron and heavy particle temperatures (TH � Te ) and are also 10
Classification of Plasma
1,E+28 1028
Stellar interiors
Thermal plasmas
Charge density (m-3)
1,E+24 1024
Fusion
1,E+20 1020
Fusion experiments
Non-thermal plasmas
1,E+16 1016 Earth's ionosphere
1,E+12 1012
Interplanetary plasma
1,E+08 108
Interstellar plasma 1,E+04 104 1,E+02 102
1,E+04 104
1,E+06 106
8 1,E+08 10
10 1,E+10 10
Electron Temperature (K)
Figure 1.1: Classification of plasmas. Reproduced from [142] called non-equilibrium plasmas [17]. It will be described in Paragraph 1.3 that a plasma is maintained throughout collisions between the different particles. The state of equilibrium of a plasma will depend on the collision frequency and the energy exchange during a collision. These two parameters strongly depend on pressure, as can be seen from Figure 1.2. A high gas pressure implies many collisions in the plasma (i.e. a short collision mean free path, compared to the discharge length), leading to an efficient energy exchange between the plasma species, and hence, equal temperatures. A low gas pressure, on the other hand, results in only a few collisions in the plasma (i.e. a long collision mean free path compared to the discharge length), and consequently, different temperatures of the plasma species due to inefficient energy transfer [15].
1.2.1
Non-Thermal Plasma
Cold plasmas refer to low-pressure plasmas where most of the coupled electrical energy is primarily channelled to the electron component of the plasma. Energetic electrons are thereby produced with a high temperature (Te ) instead of heating the entire gas stream. The plasma ions and neutral components remain at or near room temperature (TH ) and their thermal motion can be ignored. Non-thermal 11
1. Plasma
Figure 1.2: The electron temperature (Te ) and heavy particles temperature (TH ) as a function of pressure. Reproduced from [108]. plasmas are thus characterized by non-equilibrium (i.e. the non-thermal arc region in Figure 1.2). Examples of these plasmas are different types of glow discharges, low-pressure radio frequency (RF) discharges and corona discharges. Because the temperature of ions and neutrals remains relatively low, this characteristic provides the possibility of using cold plasmas for low temperature plasma chemistry and for the treatment of heat sensitive materials including polymers and biological tissues [143]. A detailed review comprising various types of non-thermal plasmas with the mechanisms of their generation and with their applications is published by Bogaerts et al. [15].
1.2.2
Thermal Plasma
Thermal plasmas are typically at atmospheric pressure or higher and are characterized by an equilibrium or near equality between electrons, ions and neutrals (Te = TH ). These plasmas are in a local thermal equilibrium (LTE) state, because it is assumed that the collisions dominate other physical processes in the plasma. In that case, the local velocity and energy distribution of particles is given by the Maxwell distribution and Boltzmann distribution respectively, and consequently a temperature can be defined. Thermal plasmas are characterized by high enthalpy contents and high temperatures, typically 2000 up to 20 000 ◦C [194]. Other properties of thermal plasmas include: • A high energy density and a high energy transfer rate 12
Plasma Forming Mechanisms • Short reaction times for chemical reactions in the plasma • Wide choice of plasma media; at high temperatures any material can be plasma These characteristics make plasma suitable for a diversity of industrial applications and interesting for many research possibilities.
Next to lightning
as a natural phenomenon, well established industrial applications of thermal plasmas are cutting, welding, spraying, analysis by inductively coupled plasma, furnaces for metallurgy with DC arcs and graphite electrodes, tundish heating, metal melting and purification, and environmentally friendly treatment of waste streams with plasma torches, etc. The research presented in this work deals with thermal plasma and the content of the next chapters will concern only this type.
1.3
Plasma Forming Mechanisms
Plasmas are formed by supplying energy to a neutral gas causing the formation of charge carriers. When man-made plasmas are considered, this can be achieved by either subjecting the gas to electromagnetic radiation (e.g. microwaves for non-thermal plasmas and lasers for thermal plasmas), or by driving an electric current through the gas. Other possibilities include supplying thermal energy, for example in flames, where exothermic chemical reactions of the molecules are used as the prime energy source, or applying adiabatic compression to the gas which can heat it up to the point of plasma generation. The most common way for transferring energy to the working gas and generating plasma is by means of an electric field. The mechanism of formation of a thermal plasma is further illustrated through the process of electrical breakdown of a direct current (DC) gas discharge.
At room temperature, gases consist of neutral species and are good insulators (i.e. non-conductive). The collisions that occur between molecules are elastic so they only change in speed and direction. To generate enough charge carriers to make the gas electrically conducting, a sufficiently high potential difference is applied between two electrodes placed in a gas. In a normal gas, the negatively charged electrons form an electrically neutral system around the positive charge in the nucleus. However, it is supposed that a few electrons are always present in 13
1. Plasma the gap between the electrodes, either by emission from the electrodes, by cosmic radiation or as a consequence of field emission from asperities on the surface, close to which electric fields are strongly enhanced [20]. These electrons are accelerated by the action of the electric field and collide with the gas molecules. If these collisions are inelastic, new electrons and ions are produced in the gas phase by different ionization processes (incl. direct or stepwise electron-impact ionization or photo-ionization) [59]. − ∗ e− f ast + A → eslower + A + − → e− slower + A + e
(1.2)
Due to the externally supplied electric field, the ejected electrons accelerate and gain kinetic energy and more inelastic collisions occur. This process leads to an avalanche of charged particles in an intense quasi-neutral cloud of free electrons, ions and neutrals in constant agitation [36]. This creates a conductive path for an electric arc to form between the cathode and anode. This event is called electrical breakdown. Because of the electrical resistivity across the system, significant heat is generated by the arc (in general by the Joule effect), which is first captured by the electrons because of their high mobility and which strips them away from the gas molecules. The electrons transfer part of this absorbed energy to the heavy particles by elastic collisions. Due to the high electron number density, ne , in thermal plasmas, elastic collision frequencies are very high, so energy transfer is important and leads to an equal distribution of the energy. The electrons are also mainly responsible for inelastic collisions, such as ionization, recombination, excitation, de-excitation, attachment, and detachment. To summarize, in a discharge, the plasma is generated by a current flowing in a partially or fully ionized gas, dissipating sufficient energy to keep the gas ionized and conducting. This process continues in a self-sustaining manner, provided a steady source of energy is continually applied. The arc discharges provide a high density, high temperature region between the electrodes. With the aid of a sufficiently high gas flow, introduced in the electrode gap, the plasma extends beyond one of the electrodes, thereby transporting the plasma energy to the reaction region [68]. This part of the plasma is called the plasma jet.
A plasma torch, also known as plasmatron, is the device that generates a directed flow of thermal plasma from its nozzle. Plasma torches vary in the primary electricity source used, which can be direct current (DC), alternating current at mains frequency (50Hz) (AC) or alternating current at radio frequency (RF). Other
14
Thermal Plasma Torch Characteristics aspects which distinguish a specific plasma torch are the arc stabilization mechanism, the plasma gas, the type of flow, electrode geometry and electrode cooling. These elements will be presented with the main emphasis on the characteristics of a DC plasma torch, which is of interest in this research.
1.4
Thermal Plasma Torch Characteristics
Plasma can be generated by various methods of discharges.
In Bogaerts et
al. [15], the different types forming non-LTE plasmas, their working principles and their applications are elaborated upon. The two main types of discharges used for the generation of thermal plasmas are the electric arc (DC or AC) and the high frequency (HF) or radio frequency (RF) induction discharge. For the arc discharge generator, further classification can be made, first according to the energy transfer mechanism, namely as non-transferred arc or transferred arc plasma torch if the material to be treated serves as one of the electrodes and secondly according to the cathode emission mechanism [74]. Some hybrid plasma torches have also been developed by the superposition of more than one plasma-generating device. Examples are a combination of DC and RF plasma torches and the combination of two RF plasma torches in tandem operating at two different frequencies.
Although these can be advantageous in specific
applications, it is unlikely because of their complexity that their use will grow to replace alternate simpler plasma systems [17].
1.4.1 1.4.1.1
Type of Plasma Discharge Alternating Current (AC)
AC thermal plasma torches are particularly applied as high-power plasma generators, but are not widely used. In this type of generator, the gas is heated by the energy of an alternating current of industrial frequency. The physical processes of the burning of the arc at direct and alternating current are basically identical [217]. The application of alternating current is associated with difficulties caused by the variability with time of the electrical parameters of the power source. On the other hand, the technological complexity of the power supplies of the DC torches involves a costly price, mainly due to the rectifier part of the electrical signal which can involve an increase of 30 percent of the price of the power supply. AC power supplies could be an alternative for reducing costs [53].
15
1. Plasma 1.4.1.2
Radio Frequency (RF)
Almost all RF torches are inductively coupled discharges, in which the discharge is sustained by the coupling of energy to the plasma through the electromagnetic field of the induction coil. The plasma gas does not come in contact with the electrodes, thus eliminating possible sources of contamination and allowing for the operation of such plasma torches with a wide range of gases, including inert, reducing, oxidizing and other corrosive atmospheres. The excitation frequency is typically between 200 kHz and 40 MHz. Laboratory units run at power levels of the order of 30-50 kW, while large-scale industrial units have been tested at power levels up to 1 MW. 1.4.1.3
Direct Current (DC)
Among the most commonly used plasma-generating devices in material processing are DC plasma torches [17]. DC arc generated plasmas involve the use of DC electric currents as high as 105 A, across two electrodes which create a potential difference in the input gas. The gas is forced to pass through the confined space between the two electrodes which provides the energy required, beginning the electrical breakdown that leads to plasma generation. The plasma extends beyond the anode in the form of a high enthalpy, high-temperature plasma jet. The majority of plasma arc generators used in materials processing use DC rather than AC because there is less flicker generation and noise, a more stable operation, better control, a minimum of two electrodes, lower electrode consumption, slightly lower refractory wear and lower power consumption [68]. Ruj and Ghosh [164] describe one major drawback with DC thermal plasma arc generators, a phenomenon called sputtering where the discharged ions and atoms from the plasma gas collide with the cathode surface causing the release of some atoms from the cathode. These can be deposited along the circular anode surface or pass through the opening along with the arc and contaminate the reactants. This reduces the life-span of the electrodes and extensive cooling of the electrodes is necessary for stable arc operation. More than 50 percent of electrical energy fed into thermal plasma can be wasted through cooling water resulting in a poor energy efficiency of the thermal plasma torch. Power dissipated in the arc column is divided between Joule heating effect (heat generation) and the heat losses by conduction, convection and radiation. The essential components, which determine the functional design of the plasma torch and consequently the plasma properties, are the arc electrode design and the choice of plasma forming gas.
16
Thermal Plasma Torch Characteristics
1.4.2
Torch Operating Mode
The design of DC plasma arc generators differs greatly depending on whether they are transferred or non-transferred. The plasma jet can be operated in a transferred/non-transferred mode depending on whether the arc is electrically review
transferred to the work piece or not. With transferred arcs (Figure 1.3a), the (a)
Cathode
Insulator
Anode (material to be heated)
(b) Plasma gas
Cathode
(c) Plasma gas
RF coil
Plasma gas
Insulating tube
Anode
Plasma jet
Plasma jet
e 1. Methods of generation of thermal plasmas. (a)modes dc transferred arc;plasmas. (b) dc plasma torch (a non-transferred arc); (c) rf Figure 1.3: Operating of thermal (a) DC transferred arc; vely-coupled plasma torch. (b) DC non-transferred arc; (c) RF inductively-coupled plasma torch [136].
n this article, I present some of the theoretical, where the non-zero components of the stress ten treated material forms one of the electrodes, whereasgeometry with non-transferred arcs are utational and experimental studies that have increased our cylindrical (Figure 1.3b), both electrodes are incorporated in the generator and differ from the standing of thermal plasmas in gas mixtures. Sections 2 = −2η∂v τ rr r /∂r substance being The electrodes review some fundamentals thattreated. are required for the in the latter configuration have the sole function of generating thein plasma. The transferred arc mode torches operate with utational modelling of all thermal plasmas, both single τθθ = −2ηvr /r and gas mixtures. low In section 2, the required fluid dynamic gas flows and high torch voltages. The torches in non-transferred arc mode τzz =[194]. −2η∂v z /∂z ons are introduced,need andhigh in section 3, thecurrents calculation of thecomparatively lower efficiencies operating and have Nonosition and the thermodynamic properties and for their high temperature plasma transferred DCand arctransport torches are used popularly rmal plasmas is described. τzr = τrz = z /∂r + ∂vr /∂z). arcs and better mixing of the plasma with reactants. In transferred arc−η(∂v generators, he subsequent sections are specifically directed towards one of the electrodes, usually the anode hasThe a large respect to the(11). otherseparation quantitieswith are defined after al plasmas in gas mixtures. Section 4 describes the The energy equation, written in te cathode. Transferred arc reactors can utilise multiple rod conservation electrodes to generate ation of diffusion coefficients, which are required in enthalpy h, is a plasma arc. modelling of mixed-gas plasmas, and introduces the � � ∂(ρh) j2 κ 5k ned diffusion coefficient formulation, which allows 1.4.3 Type of Electrodes ∇h + + ∇ · (ρ v h) = −U +∇ · ∂t σ cp 2e simplications in the treatment of many such plasmas. � � � electrodes �� � q the torch q Toof achieve reliable and processes, the erosion of ction 5, the results the modelling ofreproducible some specific κ hi ∇Y − ∇ ·they hi Ji . −∇ ·of DC torches has to be and isi simple: ples of thermal plasmas in understood gas mixtures arecontrolled. presented.The concept cp i=1 i=1 ection includes an in-depth study of the phenomenon of Here, the first four terms on the right-hand side ing in welding arcs, a calculation of the turbulent mixing 17 respectively ohmic heating, net radiative emission mospheric air into a plasma jet, and an investigation process for the destruction of hazardous chemicals. conduction and energy transfer arising from the measurement of the properties of mixed-gas plasmas is electrons. This fourth term arises because electr specific heat 5k T /2 at constant pressure, and the
1. Plasma comprise of a cathode, a plasma forming gas injector and an anode nozzle. An additional classification of the arc discharge generator can be made by the cathode emission mechanism which characterizes the arc operation. The cathode is the source of electrons for maintaining the arc discharge. There are two basic mechanisms by which a surface can provide these electrons. The first mechanism involves thermionic emission from the cathode surface heated by the arc to a temperature allowing the escape of sufficiently large numbers of electrons [194]. In most cases (98 %), they are made of tungsten doped with 1-2 wt% of ThO2 (thoriated tungsten) [57]. The role of the dopant is to lower the tungsten work function and thus the operating temperature. Thoriated tungsten cathodes cannot be used with oxidizing gases since they would damage the tungsten cathode. Consumable graphite electrodes are used instead. For industrial applications various types of DC plasma torches are used with either stick- or button-type ‘hot cathodes’. The stick-type cathodes are cylindrical (diameter-length ratio < 2/20) with a conical tip and operate at power levels in a range between 10 and 150 kW, with arc currents generally below 1000 A. The second method is field emission of electrons due to high electric fields in front of the surface. This emission mechanism rarely provides a sufficient number of electrons for arc plasmas, but combinations of field emission with either thermionic emission (thermo-field (TF) emission) or an emission mechanism where microscopic evaporation sites provide a partially ionized metal vapor, are the dominant providers of electrons with "cold cathodes" [74]. These water-cooled cathodes are of the well-type. Typical materials are copper or zirconium/zirconia [194]. It is also good to mention that the design of the gas injector, close to the cathode tip, plays a key role not only in the operating conditions of the torch, but in the cathode erosion as well. Because the cathode spot is molten over a given current, the cold gas flow close to the cathode tip has to be well controlled to avoid the blowing of the molten pool. The anode can have different configurations with respect to the jet axis. The two orientations are orthogonal to the jet axis (in transferred arcs) and parallel to the jet axis. In the latter case, with a superimposed flow to the arc, the anode attachment is unsteady. The connection column between the arc column and the anode surface crosses the cold gas boundary layer and is pushed downstream by the flow.
1.4.4
Arc Stabilization Mechanisms
Venkatramani et al. [194] describe the need for arc stabilization well by stating that the plasma arc is a highly unstable, turbulent discharge phenomenon 18
Thermal Plasma Torch Characteristics and that disturbances from equilibrium are undesirable, as they will tend to extinguish the arc. The instabilities inherent to thermal plasmas (e.g. electrical, thermal and magneto-hydrodynamic instabilities) are described in detail by Heberlein [74].
Under these circumstances, the stabilizing mechanism should
come into play. The word ‘stabilize’ means to create and maintain boundary conditions, which will enable the arc to remain in a steady state. A plasma torch is a device which provides arc stabilization and enables the arc to remain in a steady state. It constricts the arc, cools the outer layers efficiently and defines the path for a steady passage of the electric current. Besides natural convection in free burning arcs, the two main types of stabilization are gas and water flows [194]. Other types of external stabilizing mechanisms are the cold surface of the arc torch chamber in wall-stabilization and an axial magnetic field preventing the expansion of the arc column, increasing the temperature and stabilizing the arc. The principle physical mechanisms that control arc and plasma properties in both gas- or water-stabilized arcs are axial heat transfer by convection and radial heat transfer by heat conduction and radiation [81].
1.4.4.1
Gas Flow Stabilization
Gas flow stabilization is the simplest and most common technique. A flowing external cold layer of gas surrounds the arc column and constricts it. Additionally, it serves as a protection for the torch walls from overheating. The flow can be vortex or axial, depending on the mode of injection. The vortex-stabilization is extremely effective in constricting the arc, increasing the energy density and the temperature, resulting in a short and intensive arc. The vortex flow creates centrifugal forces, which drive the cold gas towards the walls of the chamber and the axial component of the flow replenishes the cold gas flow. The axial flow-stabilized arcs on the other hand have a laminar flow and the cold gas tends to surround the hot core and forms longer arcs. Illustrations of an axial flow-stabilized torch and a vortex flow-stabilized torch are shown in Figure 1.4. Plasma torches used for cutting or spraying applications are normally vortexstabilized, while axial flow-stabilized torches are used for metal processing applications. The most commonly used gases in the generation of plasma in gas-stabilized torches are argon, helium, nitrogen, air and hydrogen, or a mixture of these [194]. The choice of the plasma gas is based on gas enthalpy, reactivity and cost. Argon gas is used in some plasma torches as a heat transfer medium and for forming an inert atmosphere. This helps to prevent undesirable reactions, thus ensuring the purity of the operation and the product. 19
1. Plasma
Figure 1.4:
Plasma torch gas-stabilization schemes: (a) Axial flow-
stabilized; (b) Vortex flow-stabilized. 1, Cathode; 2, Gas flow; 3, Anode nozzle; 4, Cooling channel; 5, Plasma jet [194]. Performance characteristics of a gas-stabilized torch in a specific application are determined by plasma jet characteristics which can be adjusted by torch design, choice of plasma gas and by arc current. In general the plasma created by this type of torch has a temperature between 8000 K and 15 000 K and a mean enthalpy that is usually not higher than 10 MJ kg−1 [81]. Gas plasma torches using steam as plasma gas only achieve mean temperatures below 4000 K [192].
1.4.4.2
Water-Stabilized Torches
Substantially different plasma jet parameters can be achieved in plasma torches with water flow stabilization. The arc is ignited in the centre of a water vortex, which is created in a cylindrical arc chamber by tangential injection of water. In water-stabilized torches (see Figure 1.5), the arc column is confined inside a vortex of liquid and it is stabilized by its interaction with the inner wall of that vortex. Plasma is created by heating and ionization of steam that is produced by evaporation of water from the inner surface of the vortex. The steam that flows into the arc column is heated by absorption of radially transferred heat. Water torches are characterized by very low mass flow rates of plasma, but high velocities of the plasma flow. For the same arc power the plasma enthalpy is several times higher (150-300 MJ kg−1 ) than enthalpies achieved in common gas torches [95]. Water torches have typical low-density and high enthalpy, high temperature plasmas. These high reaction temperatures reduce the time constants of the decomposition of chemical substances and high process throughputs can be achieved.
20
Thermal Plasma Torch Characteristics
Figure 1.5: Water-stabilized torch [95]
1.4.4.3
Hybrid Water/Gas-Stabilized Torches
The substantial difference between gas- and water-stabilized arcs lies in the torch aspects that determine the flow rate of the plasma mass. In gas torches, the plasma mass flow rate is controlled independently by a flow rate of supplied gas. In water-stabilized torches, the flow rate of plasma is controlled by a balance of heat transfer in the arc column and cannot be adjusted independently like in gasstabilized torches [81]. There are some limits in the range of adjustable plasma jet characteristics that are given by the principle of arc-stabilization. Physical limits of both gas- and waterstabilized arcs do not allow to cover a wide gap in plasma parameters between high enthalpy, low-density plasmas generated in liquid-stabilized torches, and lower enthalpy plasmas generated in gas-stabilized torches [191]. The different ranges of both types of torches as a function of these parameters is shown in Figure 1.6. For better control of plasma jet characteristics, a new type of DC hybrid plasma torch (Figure 1.7) has been designed at the Institute of Plasma Physics (IPP) that utilizes combined gas-liquid stabilization. The hybrid torch unites both principles of water- and gas-stabilization of the arc. Gas, such as argon, is supplied along the cathode with a vortex component to assure proper stabilization of the arc at the cathode nozzle. The gas which flows in this cathode part of the torch protects the cathode tip and hence the consumable carbon cathode used in water-stabilized torches can be replaced by a fixed tungsten cathode [191]. Subsequently, the plasma enters the second chamber which is surrounded by a water vortex, formed by a tangential injection of water. Interaction of the arc column with the water vortex causes evaporation from the inner surface of the vortex. The steam mixes with the gas flowing from the cathode section, and forms 21
1. Plasma
Figure 1.6:
Operation regimes of plasma gas- and water-stabilized
torches. Plasma mass flow rate (g/s) as a function of power (kW) [81].
Figure 1.7: DC hybrid water/gas-stabilized plasma torch [95] a plasma that consists of a mixture of steam and gas (e.g. argon). The overpressure which is produced in the arc chamber due to the evaporation, accelerates the plasma towards the exit nozzle. The anode of the torch is created by a rotating copper disk, which is positioned outside the arc chamber downstream of the torch exit nozzle (see Figure 1.7). Due to the principle of arc stabilization by a water vortex the flow rate of plasma gas is very low, plasma enthalpy is more than 200 MJ kg−1 and mean plasma temperature is more than 15 000 K [88]. If argon is used as stabilizing gas, the hybrid torch keeps the same thermal characteristics as a water-stabilized torch with high enthalpy and high temperature but plasma density, velocity and momentum flux can be increased significantly (Figure 1.8). 22
Thermal Plasma Torch Characteristics These increases are due to the substantial difference between the plasma proper-
Figure 1.8: Radial profiles of enthalpy flux density and plasma density at the nozzle exit of water-stabilized and hybrid-stabilized torch at an arc current of 400 A [81]. ties of argon and steam plasmas. Enthalpy, heat conductivity, radiation intensity and absorption coefficients of argon plasma are much smaller than in the case of steam plasma. Therefore, the properties of plasma that are controlled by heat transfer change only slightly. The change of properties related to mass balance, on the contrary, is more substantial. By changing the argon flow rate, the hybrid torch provides the possibility of controlling the plasma jet characteristics and plasma composition in a wide range from high enthalpy, low density plasmas typical of water stabilized torches to lower enthalpy, higher density plasmas generated in gas stabilized torches [81] (see Figure 1.6). The other characteristic feature of this hybrid torch is the very low mass flow rate of plasma. Experimental measurements of the plasma temperature showed that the energy balance in the arc column is almost independent of argon flow rate [22]. The inflow of argon plasma with very low enthalpy does not noticeably influence the radial transfer of energy to the wall, so the arc has electrical characteristics and power balances that are very close to the ones of water-stabilized torches. On the other hand, mass flow rate and momentum flux are strongly influenced by the argon flow and can be thus controlled almost independently of the power balance. Plasma velocity, enthalpy and other thermodynamic and transport properties can be varied in a wide range by changing argon flow rate [99]. The wide range of operating parameters of the hybrid-stabilized torch has distinct advantages in certain plasma applications. 23
1. Plasma • In plasma spraying, desired plasma characteristics according to the application can be selected by adjusting the torch parameters. This allows the same torch to be used for extremely high spraying rates and plasma temperatures, as well as for a reduction of spraying rate with an increase of particle velocities. • Materials treatment such as plasma gasification could benefit from the specific characteristics of this torch. As a low amount of plasma carries high energy, the power needed for heating of plasma to reaction temperature is relatively low, and the efficiency of utilizing plasma power for decomposition is high. The large amount of energy at a low mass flow rate also decreases the contamination of plasma components in the product gas produced from decomposition of organic matter and provides high heat transfer rates from the plasma gas to the material. The hybrid stabilization of the plasma arc also has an effect on the entrainment of surrounding atmosphere in the plasma jet [99]. The strong interaction between plasma and the ambient gas is brought about by the strong velocity and density gradients at the jet fringes and becomes apparent in reducing plasma temperature and velocity. The control of this effect is crucial for efficient plasma processing since it determines the conditions of the plasma flow field at the point of entry of material interacting with the plasma. That is why study of the entrainment process in the jets generated under different conditions is a question of great importance.
Many of the features of the hybrid stabilized plasma jet discussed above have been elaborately investigated by experimental measurements. A CFD model of the plasma jet from this hybrid plasma torch, however, has not yet been developed. Such a model would accelerate the efforts of visualizing the temperature and velocity field across the wide range of operating parameters. Additionally, the dynamic interaction between the plasma flow and the surrounding gas could be studied in detail. This could provide an understanding of the plasma properties controlling the entrainment processes. A model of the plasma jet would also allow optimization of the application of this torch for plasma spraying and plasma gasification. Based on a correct simulation of the plasma flow field, the point of entry of powder in plasma spraying or the position and configuration of plasma torches in a plasma gasification reactor can be determined.
24
Chapter
2
Plasma Gasification
2.1
Background
The fewer reserves of fossil fuels and a greater environmental awareness have prioritized sustainability in waste management practices. Simultaneously, the energy industry is experiencing a transition to renewable energy systems, in which among solar, wind and water, also waste (incl. biomass) is considered as a sustainable (potentially CO2 -neutral) energy source. The focus on improved resource recovery and the interest in energy valorization from waste have been triggering the development of more advanced methods and concepts for the conversion of waste to useful end-products. One of the most current concepts is a circular economy, in which waste is managed as a resource, material loops need to be closed by direct recycling of pre-consumer manufacturing scrap/residues (e.g. steel slags), by urban mining of post-consumer End-of-Life products (e.g. recovery rare earth metals from electronic waste), and by landfill mining of historic (and future) urban waste streams [96]. In the context of the third approach, the concept of Enhanced Landfill Mining (ELFM) has been introduced by the Flemish ELFM Consortium in 2008. Currently, ELFM is defined as “the safe conditioning, excavation and integrated valorization of (historic and/or future) landfilled waste streams as both materials (Waste-to-Material, WtM) and energy (Waste-to-Energy, WtE), using innovative transformation technologies and respecting the most stringent social and ecological criteria” [96]. 25
2. Plasma Gasification On the one hand, this definition incorporates the temporary storage concept and on the other hand, more relevant to the subject of the presented research, the need for innovative separation and transformation technologies. The development of advanced waste treatment technologies starts with understanding the conventional conversion methods and identifying their shortcomings. The different conventional conversion pathways that have been commercially proven in a full-scale plant are shown in Figure 2.1, adapted from Helsen and Bosmans [75]. Depending on the type and characteristics (e.g. composition, moisture content, etc.) of the waste, the most suitable treatment option can be selected. The waste after pre-treatment, storage and/or transport can be treated WASTE
PRETREATMENT/STORAGE/TRANSPORT
PYROLYSIS
LIQUEFACTION
BIOCHEMICAL
PHYSICOCHEMICAL
THERMOCHEMICAL COMBUSTION
TORREFACTION
GASIFICATION
ANAEROBIC DIGESTION
FERMENTATION
EXTRACTION
ESTERIFICATION
DESTILLATION
PYROLYSIS OIL
METHANOL
SYNGAS
CHAR
BIOGAS
ETHANOL
VEGETABLE OIL
BIODIESEL
FUEL
MECHANICAL WORK
THERMAL ENERGY
HEAT
CHEMICALS
ELECTRICITY
Figure 2.1: Different conversion pathways for waste with a range of conversion technologies. The main products obtained from these processes (potentially after an intermediate physical or chemical step) can have different end-uses. The most frequently used approach for energy valorization from waste is combustion, from which the retrieved thermal energy can supply heat and/or generate electricity. The secondary energy carriers in the other pathways can be directly applied as chemical raw materials or utilised as alternative fuel sources. If these are not burned to provide heat and/or electricity, their energy content can be transformed to mechanical work (e.g. to drive a car or fuel a plane). The waste-to-resource technologies can be divided into three categories, being thermochemical, physicochemical and biochemical conversion methods. Besides 26
Background combustion (or incineration), the other two main thermochemical conversion methods are pyrolysis and gasification. Since plasma gasification is a variation on conventional gasification, the specifics of this technology are briefly presented and its performance compared to the other thermochemical conversion methods. These will not be described in detail, but a comprehensive review of the available technologies for thermochemical treatment of waste streams was published by Bosmans et al. [16].
2.1.1
Incineration
Incineration is the exothermic oxidation of the combustible organic content in waste. During combustion, the majority of the fuel energy is contained as heat in the reaction products (mainly CO2 , H2 O and O2 ), also called flue gases. If air is used as the oxidizer, the flue gas also contains nitrogen. For effective oxidative combustion, a sufficient oxygen supply is essential and the ratio of the amount of supplied air to the stoichiometric required amount for full oxidation usually ranges from 1.2 to 2.5. The incineration process has undergone rapid technological developments over the last 10 to 15 years which have been mainly directed towards reducing emissions. However, because of the oxidizing environment and relatively low operating temperatures between 500 and 1000 ◦C, not all harmful components (CO, hydrogen halides, nitrous oxides, sulphur oxides, heavy metal compounds and tar (e.g. dioxins (PCDD), furans (PCDF) and other volatile organic compounds (VOCs)) can be broken down and extensive gas cleaning is needed for save flue gas exhaust. The inorganic content and unreacted carbon (soot) are recovered as fly ash (dust in the flue gas) and bottom ash (i.e. the heavier solid ash). Additional treatment can improve bottom characteristics and would allow its use in congregate aggregates. Fly ash immobilisation is required in order to make it environmentally safe for landfill disposal [16].
2.1.2
Pyrolysis
Pyrolysis is the thermal decomposition of organic material at elevated temperatures with limited amounts or in the absence of oxygen. The typical temperature range is from 400 to 900 ◦C, but usually lower than 700 ◦C. The pyrolysis process is endothermic, so heat needs to be provided to the material. This can be done by partial combustion of the waste material, by direct heat transfer from either the recycled product gas or circulating solids, and by indirect heat transfer from exchange surfaces. Three products are obtained depending on the modes of pyrolysis (slow, fast or flash): pyrolysis gas, pyrolysis oil and solid coke (charcoal). 27
2. Plasma Gasification The usefulness of pyrolysis for secondary fuel production or substance recovery from waste depends on the presence of potential pollutants, which could make the pyrolysis products (very) difficult to use [75].
2.1.3
Conventional Gasification
Gasification is the thermochemical conversion of solid, liquid, or gaseous carbonaceous material at increased temperatures (usually in the range of 700-1800◦C) by means of sub-stoichiometric amounts of free oxygen or bound in the form of, for example, steam [72]. This means equivalence ratios, which are lower than 1, typically around 0.4-0.5. The carbon-rich material is converted by addition of controlled amounts of oxygen to a low-or medium-value syngas, which contains varying amounts of carbon monoxide, hydrogen, methane and possibly other gases.
The history of gasification dates back to the seventeenth century when the process was discovered in 1699 by Dean Clayton, who obtained coal gas from pyrolytic experiments. It was not until 1788 that the first patent with regard to gasification was issued to Robert Gardner [169]. Gasification was further developed during the nineteenth century in factories to produce town gas from coal and peat for lighting and cooking purposes, prior to the introduction of electricity and natural gas. Due to the shortage of petroleum during World War II, the gasification process for the production of fuel and chemicals was re-implemented and improved. The end of the war and the availability of cheap fossil fuel reduced the usefulness of this process but with new contemporary global challenges, gasification of waste is re-emerging, becoming one of the most advanced waste conversion methods. 2.1.3.1
Gasification Process
To understand the influence of the gasification agents and conditions, it is convenient to consider the thermodynamics of the gasification process. In the gasifier, the treated material successively undergoes three major stages: heating and drying, de-volatilization, and char reaction [185]. The latter two steps cover several different processes and reactions (with the standard enthalpy change at 298 K included). • The pyrolysis or de-volatilization process occurs as the carbonaceous particle heats up. Volatiles are released and char is produced, resulting in up to 70 % weight loss during coal gasification. The process is dependent on the properties of the carbonaceous material, which also determine the structure 28
Background and composition of the char. The volatiles consist of tar, water vapour and light gases (CO, CO2 , H2 , CH4 ,...). • The combustion process occurs as the volatile products and some of the char reacts with oxygen to form carbon dioxide and carbon monoxide, which provides heat for the subsequent gasification reactions. Letting C represent a carbon-containing organic compound, the important reactions are partial oxidation (2.1) and the combustion reaction (2.2) [72]. 1 O2 2 C + O2
C+
→
CO
→
CO2
(-110.5 kJ/mol) (-393.5 kJ/mol)
(2.1) (2.2)
• Other gasification reactions that occur on the carbon of the char are with steam to produce carbon monoxide or carbon dioxide and hydrogen, via the water-gas reaction (2.3) and the carbon-steam reaction (2.4). Two other important heterogeneous gasification reactions are the Boudouard reaction (2.5) and the hydrogasification reaction (2.6). C + H2 O
CO + H2
(+131.3 kJ/mol)
C + 2H2 O
CO2 + 2H2
C + CO2
2CO
(+172.4 kJ/mol)
(2.5)
C + 2H2
CH4
(-75 kJ/mol)
(2.6)
(+90.2 kJ/mol)
(2.3) (2.4)
• The most important homogeneous volatile reactions that can be identified during the gasification process are the gas phase water-gas shift reaction (2.7), the methanation reaction (2.8) and carbon monoxide, hydrogen and methane oxidation (2.9, 2.10, 2.11). CO + H2 O
CO2 + H2
(-41.1 kJ/mol)
CO + 3H2 1 CO + O2 2 1 H2 + O2 2 1 CH4 + O2 2
CH4 + H2 O
→
CO2
(-283 kJ/mol)
(2.9)
→
H2 O
(-242 kJ/mol)
(2.10)
→
CO + 2H2
(-206.1 kJ/mol)
(-38 kJ/mol)
(2.7) (2.8)
(2.11)
• The high-temperature environment also promotes the decomposition of tar to smaller, desirable gas components. In the listed tar reactions, which are - in order of appearance - partial oxidation, dry reforming, steam reforming
29
2. Plasma Gasification and thermal cracking, tar is represented by Cm Hn . m O2 2
→
Cm Hn + mCO2
→
Cm Hn + mH2 O
→
(m − p)Cm Hn
→
Cm Hn +
n H2 + mCO 2 n H2 + 2mCO 2 n (m + )H2 + mCO 2 mq − pn H2 mCm−p Hn−q + 2
(2.12) (2.13) (2.14) (2.15)
The balances of these reactions, depending on the gasifying medium and temperature, determine the share of carbon monoxide, carbon dioxide, hydrogen and methane in the syngas composition.
Besides the operating parameters of the gasifier (such as temperature, catalysts, material flow rates, etc.), a gasification system is defined by the design of the gasifier. The design depends on the choice of oxidizing agent and on the type of gasifier configuration. 2.1.3.2
Oxidizing Medium
The process can be carried out by partial oxidation with air, oxygen-enriched air, pure oxygen or as steam gasification. Air-blown gasification is the simplest way to convert biomass into a low-calorific value syngas. The calorific value of the producer gas ranges between 4 and 7 MJ/Nm3 [7]. The low energy content of the produced syngas is caused by the inherent dilution with nitrogen (up to 60 %) [100]. For enhanced chemical conversion to a medium-calorific value syngas (characterized by a heating value in the range of 10-20 MJ/Nm3 ), nitrogen must be removed from the process. Some processes are operated with oxygen-enriched air, i.e. a mixture of nitrogen and oxygen with an oxygen content up to 50 %. This produces a higher heating value gas without the consumption of expensive pure oxygen. The investment of an air separation unit (ASU) to achieve partial oxidation with pure oxygen appears only justified for large scale units (larger than 100 kilotonnes per year). The characteristics of oxygen-enriched air gasification are a higher syngas heating value, reduced volumetric flow rate, low tar content and vitreous ash production [7]. Steam gasification can also provide an attractive alternative for the production of medium-calorific value syngas, free of atmospheric nitrogen. This process is especially attractive when increased hydrogen content in the syngas is desired.
30
Background No exothermic reactions are involved, so an external source of energy for the endothermic gasification reactions is needed. This is called allothermal gasification in contrast to autothermal gasification, which relies on the partial and complete oxidation of some of the material to generate the heat for the gasification reactions (diluting the syngas with CO2 ). The MILENA gasification process is an example of allothermal gasification where the gasification of biomass material is separated from the combustion of the remaining char. The energy for heating the biomass is transported by the circulating bed material from the combustion chamber. Although this type of indirect gasifier is only in the development stage of the technology, a higher fuel conversion and lower ash load is reported compared to direct gasifiers [188]. In other allothermal gasification systems, electric heaters are also used to supply the external heat to the system [200]. More recently, CO2 is also investigated as an oxidizing medium, either exclusively or in combination with oxygen or steam. Analogous to these combinations of gasifying agents, oxy-steam (O2 +H2 O) gasification is also a technology which is being developed [165]. 2.1.3.3
Type of Configuration
Gasifiers can be categorized based on the type of bed and type of flow [106]. The different configurations include fixed-bed, fluidized-bed and entrained-flow type gasification. The fixed bed gasifiers can be further differentiated in the way the reagents and the gasifying agent come into contact with one another. In an updraft or counter-current reactor, the waste feeding system is at the top of the gasifier and the oxidant intake is at the bottom. In this configurations, the product gas moves upwards. In downdraft or co-current reactors, the material is fed in from the top and drops downwards, while the gasifying agent is injected from the side and mingles with the products of the pyrolysis. The solids and product gas then move downward in parallel streams. The syngas exits from the bottom at higher temperature (around 800 ◦C in stead of around 500 ◦C), with lower tar level compared to an updraft configuration. In the category of fluidized bed-type gasifier, bubbling or circulating fluidization is possible. In a bubbling fluidized bed (BFB), the flow of gaseous oxidant is blown upwards through a distributor plate and permeates a bed of inert material (typically silica sand or olivine) located at the gasifier bottom, which contains the waste to be treated [7]. The resulting fluid-like state achieves an intense mixing between gas and solids allowing very high heat and mass transfers. Circulating fluidized beds (CFB) have higher flow rates which carry most of the bed partic31
2. Plasma Gasification
Figure 2.2: Different types of gasifiers ulates and ungasified material to an attached cyclone separator, from which the solids are re-circulated to the gasifier bed. This is one of the preferred technologies for large-scale biomass gasification plants [163]. A complete overview of the differences between fixed bed and fluidized bed gasifiers and the (dis)advantages of each type have been summarized by Warnecke [199]. The last type of the most commonly used gasifier types is the entrained flow reactor. These reactors are operated at high pressures (about 25 bar). Very fine particles (smaller than 1 mm) are mixed with water to form a slurry which is entrained by the pressurized gasifying medium upon entering the reactor. The rapidly occurring combustion at the top of the reactor raises the temperature to high temperatures which melts the ash onto the gasifier walls. The molten slag can then be further discharged [7].
2.2
Definition and General Features
The application of the previously mentioned thermochemical conversion technologies in waste management faces fundamental problems and does not meet the stringent requirements of sustainable development. Sustainable development is defined as the development that meets the needs of the present without comprising the ability of future generations to meet their own needs. Recuperation of by-products or thermal energy from waste streams is not only motivated by cost saving, but also by resource saving considerations for future generations. The bottom line idea advocated here is to develop and to implement technology 32
Definition and General Features using waste as a source for ‘green energy’ or ‘green chemicals’, in other words, not detrimental to the environment. An advanced technology for the environmentally friendly treatment of all types of waste streams is needed. Plasma gasification is a promising alternative for conventional thermochemical conversion technologies as it offers a substantially higher resource recovery potential and much better tar removal capabilities.
Plasma torches have been used in materials processing as long ago as the 1960s [24]. Several applications which have been developed since its first use for testing heat shields for spacecraft were previously mentioned in Paragraph 1.2.2. These processes rely on the high temperature, high intensity, non-ionizing radiation and high-energy density characteristics of plasma torches. Heberlein [74] describes why the heat transfer by thermal plasma to a material occurs more effectively than by normal gas convection.
Since in a thermal plasma the
molecular components are mostly dissociated and atomic species are partially ionized, the energy transport occurs not only by transfer of kinetic energy as in ordinary gases, but includes transfer of the heat of dissociation and of ionization. This transport of reaction energy in addition to the fact that electrons transport heat more efficiently results in thermal conductivity values for thermal plasmas which are considerably higher than those of gases. The heat source is also directional with sharp interfaces and steep thermal gradients that can be controlled independently of chemistry.
The specific properties of plasma have triggered the interest for applying plasma torches in gasification. Thermal plasmas can be combined with gasification in two ways. The first possibility is to use the plasma as a downstream processing step after the gasification process, where it cleans the syngas by destroying most of the unwanted contaminants and melts the inorganic components (ash and metals) into a vitrified slag. In the second way, the thermal plasma torch is directly incorporated in the gasification reactor, where it serves as the energy source for the allothermal gasification process.
The latter interpretation of
plasma gasification is the subject of the further explanation of the technology. Plasma allows a better process control than other energy carriers in the allothermal gasification process. Whereas an upper temperature limit of 2000 ◦C can be achieved by burning fossil fuels, electrically generated thermal plasmas can reach temperatures of 20 000 ◦C or more [68]. This high-temperature, reactive environment accelerates the kinetics and improves the thermal decomposition 33
2. Plasma Gasification of hazardous organic compounds (such as tar) into desirable gas species. As energy for the process is supplied by the plasma power, chemical reactions with the treated material and its devolatilization products are not the primary source of energy, allowing the adjustment of the injected energy independently of the heating value of the treated material. Additionally, the enthalpy provided by the plasma can easily be adjusted by the tuning of the electrical power supplied to the system, making the process independent of O/C ratio and the nature of the plasma medium (neutral, oxidizing or reducing atmosphere) [53]. At the elevated temperatures in the reactor volume, the inorganic constituents of the treated material can reach their melting point and can be reduced to a nonhazardous melt with a very low unburnt organic residue content.
2.3
Advantages
The advantages of plasma gasification which follow from the plasma features and their effects on the gasification process are [24, 53, 57, 68, 74, 82, 164]: • Better control of process temperature by adjusting the plasma power in relation to the material feed rate. • The produced syngas is of higher quality and contains a reduced amount of unwanted contaminants. These include soot, char, higher hydrocarbons, tars and other complex molecules, toxic gases such as oxides of sulphur or nitrogen and pathogens. • A better overall control of the composition of the syngas because of several elements; first, the decoupling of the process chemistry from the heat source. Because the plasma can carry sufficient energy to the process at substantially lower flow rates, the composition of produced syngas is not much influenced by plasma gas composition. Secondly, a uniform composition can be attained by high-temperatures and a homogeneous temperature distribution inside the reactor. Additionally, the steep thermal gradient for the gas exiting the reactor leads to high quench rates, which allows to obtain non-equilibrium compositions or metastable states and non-equilibrium compositions, thereby minimising the reformation of persistent organic pollutants (POPs), such as polychlorinated biphenyls (PCB) or dioxins [68]. • Reduced off-gas treatment. The amount of gases added is much smaller since they only serve as oxidant to generate syngas and not for producing the process heat source. A lower amount of gases are therefore diluting the 34
Advantages produced syngas, i.e. lower off-gas flow rates and consequently lower gas cleaning costs. • A low thermal inertia makes it possible to control and to provide feedback to the process in a fast and easy way. • The fast reaction times and higher process rates correspond to shorter residence times and larger material throughputs. This means that the footprint of the reactor installation can be smaller for a given waste throughput. • The possibility of producing saleable co-products from the inorganic residues. This eliminates the need for extensive ash-handling and/or disposal. • Rapid start-up and shutdown times can be achieved without compromising refractory performance thanks to the high heat flux densities at the reactor boundaries and fast attainment of steady-state. • A wide range of materials can be treated with plasma gasification. The treated materials can be in gaseous (e.g. poisonous gases), liquid (such as sludge or urine) or solid state. A higher level of heterogeneity can also be handled, which requires less pre-sorting. Besides ashes and metals, the various waste streams which have been known to be treated by plasma gasification can be divided in three categories for which a non-exhaustive list of materials is given. A first group of raw materials are residues from agricultural activities and other natural resources which are of insufficient quality to be accepted by conventional combustion processes. – Woody biomass – Biological waste, e.g waste from slaughterhouses – Tar sands – Peat – High-sulfur brown coal (lignite coal) and bituminous coal – Oil shale A second group consists of materials from consumer’s and industrial activities: – Municipal solid waste – Sewage sludge waste (SSW) and other sludge wastes, with a range of organic contaminants, and high moisture content – Waste aboard ships (cruise ships, large warships) 35
2. Plasma Gasification – Unrecoverable plastic waste – Used automobile tyres and rubber waste – Auto-shredder residue (or car fluff) – Residues from chemical industry: paint, ink, textile products – Waste from leather manufacturing A third group is hazardous wastes: – Pathological clinical waste from hospitals and outdated pharmaceuticals – Contaminated soils, usually with hazardous organic materials – Hazardous liquids and gases, including PCB-containing oils, chlorinated fluorocarbons (CFC’s) and various widely used solvents – Asbestos cement waste – Low level radioactive waste ranging from contaminated structural materials to clothing – Military waste The better process characteristics of the treatment of these waste streams by plasma lead to environmental benefits by the offset of greenhouse gases and prevents undesired pollution in the by-products (a possibly non-leachable vitrified lava) and end product (a clean syngas of high caloric value).
2.4
Disadvantages
The main disadvantage associated with the plasma process is the use of electrical power as an energy source, which is expensive. Another disadvantage is the short lifetime of the electrodes of the plasma torch, which implies additional high maintenance costs. Consequently, economic considerations provide the strongest barrier for the development of plasma gasification projects [73]. Plasma gasification offers the technology for waste disposal, combined with power generation. The feasibility of this treatment however, depends greatly on the energetic and economical balance of the process.
2.5
Product Applications
Waste is considered a very promising renewable resource which is wide-spread and abundantly available on a global level. The produced syngas from waste plasma 36
Product Applications gasification can be the feedstock for a broad range of energy- and material endpurposes. As such, it can substitute fossil fuels as raw materials. The general added value of the syngas produced by plasma gasification compared to that from conventional gasification is its high quality. A first reason for this is the syngas composition, which contains higher levels of carbon monoxide and hydrogen and much lower concentrations of carbon dioxide. After all, the energy for the gasification reactions does not originate from the full oxidation reaction of the treated material (which produces CO2 amounting up to 35 volumetric percent of the syngas), but rather from the plasma energy. The more desirable composition also translates into a higher calorific value of the syngas. For example, the lower heating value of syngas from air-blown conventional gasification typically ranges between 5 and 7 MJ/Nm3 [7], while the syngas heating value from plasma gasification with air as the oxidizing medium can reach 10 MJ/Nm3 [21]. In terms of unwanted contaminants, the lower concentrations in the syngas from plasma gasification reduces the extent of gas cleaning prior to its use as fuel or as feedstock.
2.5.1 2.5.1.1
Syngas Thermal Valorization
Syngas can be used to generate electricity by means of different technologies. The syngas can be burned in a boiler to produce high-pressure steam which drives a steam turbine. More efficient electricity production systems are gas engines and gas turbines.
Gas engines running on syngas are mostly spark-ignition (SI) reciprocating engines. The normal energy source in a gaseous-fueled engine is methane. A number of the components of syngas cause challenges which must be countered by a number of technical modifications. Gas contaminants in syngas, most notably tar and humidity, are a key technical challenge to the utilisation of synthetic gases. The concentration of tar allowed in the syngas for downstream use in gas engines is limited to 50 mg/Nm3 . The high hydrogen levels in the syngas can also cause problems. Hydrogen is much quicker to burn than methane and faster combustion in the engine cylinders would lead to the potential of pre-ignition, knocking and engine backfiring. These elements reduce the output of the engine to between 50 % to 70 % of its typically natural gas output.
With emphasis on clean engine operation, burning of syngas in SI engines proved to be viable due to significantly lower exhaust gas emissions, equal heat release 37
2. Plasma Gasification characteristics and larger usable operating range when compared to methane. Due to the low energy content of syngas, it is necessary to use much higher amounts of syngas to obtain similar performance output values [175]. The net electrical efficiency of gas engines related to the energy content of the syngas is reported around 35 percent (e.g. efficiencies of 37 % and over can be achieved with Jenbacher gas engines) [77]. Gas engines (and steam turbines) can also be operated in combined heat and power mode (also called co-generation). The sensible heat of the off gases is then recuperated by use of an exhaust gas heat exchanger to generate pressurised hot water or steam, which can be used for district heating or for heating a process.
Gas turbines are a type of internal combustion engines, consisting of a compressor unit, a combustion chamber and a turbine. Fresh atmospheric air flows through the compressor which brings it to higher pressure. Energy is then added by spraying fuel into the air and igniting it so the combustion generates a high-temperature flow. This high-temperature, high-pressure gas enters a turbine, where it expands down to the exhaust pressure. The turbine shaft work is used to drive the compressor and the electric generator. Some key issues that need to be considered when using syngas rather than natural gas to fire a gas turbine are: flame stability issues, the level of water vapour, the lower calorific value and the higher corrosion potential [64]. Syngas-fueled gas turbines are almost exclusively used in a combined cycle power block (consisting of one or more gas turbines and a steam turbine). Clean syngas (with tar levels lower than 5 mg/Nm3 is combusted in highly efficient gas turbines to produce electricity. The excess heat from the gas turbines and from the gasification reaction is then captured, converted into steam, and sent to a steam turbine to produce additional electricity. Moreover, the system is referred to as integrated gasification combined cycle (IGCC) (Figure 2.3) when material and gas flows are internally linked between the gasification process and the heat- and electricity generating unit. An important aspect, among others, is the conversion of the heat captured from the hot syngas to steam and consequently additional electricity through the steam turbine. In an IGCC, where power generation is the focus, electricity is generated with very low emissions and high electrical efficiencies up to 60 % (higher heating value of the feed gas). Analogous to an IGCC power plant, the integrated gasification fuel cell (IGFC) cycle links a high-temperature type fuel cell (such as the solid oxide 38
Product Applications
Figure 2.3: Schematic of an IGCC system [145] fuel cell (SOFC)) power generation unit to the gasification process instead of a gas turbine (Figure 2.4).
A SOFC operates at higher temperatures than
Figure 2.4: Schematic of an IGFC system [144] lower-temperature fuel cell types such as proton exchange membrane fuel cells or alkaline fuel cells. The latter fuel cell types require pure hydrogen as fuel, whereas the SOFCs are not poisoned by carbon monoxide and carbon dioxide, and can accept hydrogen, carbon monoxide, carbon dioxide, steam, and methane mixtures 39
2. Plasma Gasification as fuel directly, because of their internal shift and reforming capabilities [65]. Fuel cells offer the ability to convert chemical energy directly into electrical energy with a very low environmental impact. A diagram of the SOFC and its principle of operation are shown in Figure 2.5. The key to the operation is a thin,
Figure 2.5: Diagram of a solid oxide fuel cell [141] dense layer of ceramic material, called yttria-stabilized zirconia (YSZ), which separates the air-side (with cathode) from the fuel-side (with anode) of the cell, and performs as the electrolyte. At high temperature (800–1000 ◦C), the hydrogen and/or other fuel gas at the porous anode layer, can flow towards the electrolyte. An oxidation reaction on the catalyst sites strips the hydrogen atoms from their electron. The electrons cannot go through the electrolyte and flow around the membrane through an external circuit. At the cathode, or air electrode, which is a thin porous layer on the electrolyte, oxygen reduction takes place. The Y–doped zirconia allows the negatively charged oxygen ions to pass through to the anode, where the oxygen ions and the hydrogen combine to produce heat and water. The external flow of electrons in the process creates the electrical current. A single fuel cell produces less than 1.16 volts, so to increase the amount of electricity generated, hundreds of individual fuel cells can be combined in a fuel cell stack. The waste heat from SOFC systems may be captured and reused, increasing the theoretical fuel utilization ratio to as high as 80 % to 85 % [141]. Recent developments allow an accessible incorporation of carbon capture & storage technology with IGCC and IGFC plants, which reduces the flow of CO2 emitted to the atmosphere. Such IGCC-CCS and IGFC-CCS also have reduced energy efficiencies, because of the energy requirements for the carbon capture & 40
Product Applications storage, with maximum reported values for system efficiencies of 60 % [171]. The syngas can contain tars and trace species such as particulates, chlorides (HCl), sulphur (H2 S) and alkali compounds among others, which could be detrimental to SOFCs if they are contained within the feeding syngas stream. Therefore the syngas must be pre-treated in order to reduce these trace species to a level that SOFCs are able to tolerate [115]. In terms of tar concentrations in the syngas, the limit for a fuel cell is 1 mg/Nm3 .
The higher calorific value of syngas from plasma gasification due to less dilution by CO2 compared to conventional gasification increases the efficiency of the power generation mechanisms. It is important to note that the net produced electricity from syngas from plasma gasification can only be considered renewable if the power demand of the torch was supplied by the generated electricity of the system or by another renewable energy system (e.g. solar panels). 2.5.1.2
Chemical Valorization
Hydrogen is of special importance, because it is pollution-free and usable in many power and propulsion systems and as a chemical building block for different chemicals. Because of its cleaner burning characteristics (only H2 O is produced) as well as a high-energy density on mass basis, it is being considered as a possible replacement for fossil fuels. The global market for hydrogen is already greater than $40 billion per year [103] including hydrogen used in ammonia production (49 %), petroleum refining (37 %), methanol production (8 %), and miscellaneous smaller-volume uses (6 %) (e.g. as a fuel gas, or for electric power generation with fuel cells). Hydrogen might be pollution free, but nevertheless, it is only as clean as its method of generation. Today, most of the hydrogen is produced from natural gas by steam reforming. Presently, 77 % of the worldwide hydrogen production comes from petrochemicals, 18 % from coal, 4 % from water electrolysis and 1 % from other sources [10]. Hydrogen production using steam methane reforming (SMR) is the most economical method among the current commercial processes.
The
popularity of SMR is due to its low cost; however, the volatile price of methane can elevate the SMR-based hydrogen cost and in addition, this method of hydrogen production results in the release of carbon dioxide, which is of great concern, since CO2 is a main component of greenhouse gases. Waste can offer an economical and environmental-friendly feedstock for renewable hydrogen production through plasma gasification. Similar to the SMR process, 41
2. Plasma Gasification this alternative for production of hydrogen also encompasses a water-gas shift reaction with catalysts such as copper-zinc and a CO2 adsorption step using an adsorbent such as CaO, but the need for extensive pre-treatment and steam reforming is eliminated. A preliminary assessment reported by Lau et al. [107] suggests that hydrogen can be produced economically from biomass, but large-scale infrastructure is needed to be competitive with the cost of hydrogen produced from natural gas. However, the process is definitely more advantageous than fossil fuel reforming in consideration of environmental benefits, which can be even higher for plasma gasification of waste instead of biomass. In the future, the costs of renewable hydrogen production are expected to be lower than the costs for production from natural gas, which will allow thermochemical biomass conversion to become one of the most economical large-scale renewable hydrogen technologies [146]. There are still challenges that must be overcome, but as technology improves, natural gas prices increase, and government incentive programs evolve, syngas produced from plasma gasification will present an economical way to produce hydrogen.
As stated in the previous section, the largest end-use of hydrogen is for the production of ammonia. If the air-blown gasification of biomass and waste is considered, one might speculate that ammonia could be directly synthesized from the produced hydrogen-rich syngas, since it already contains the two reacting compounds (N2 and H2 ) for ammonia production. However, the catalysts in the process have high requirements, i.e. there cannot be any H2 O, CO, CO2 , O2 and other poisons present in the gas. Therefore, the syngas is first purified to hydrogen and then recombined with nitrogen to form ammonia.
Methanol produced from biomass and/or waste is a promising carbon neutral fuel, well suited as a transportation fuel and as a chemical building block. From a thermodynamic point of view, utilisation of methanol in internal combustion engines could bring some advantages such as an increase in power (due to the increase of the engine’s compression rate) and in energy efficiency, besides reducing the emission of pollutants. Because of its specific properties and high hydrogen to carbon ratio, it is also considered an ideal hydrogen carrier for fuel cell vehicles. Methanol is further used as a precursor in the synthesis of chemicals such as acetic acid, methyl tetra butyl ether (MTBE), dimethyl ether (DME) and olefins (such as polypropylene acrylonitrile). According to Galindo-Cifre and Badr [62], more than 75 % of methanol is currently produced from natural gas. 42
Product Applications An interesting alternative way for the production of methanol is via synthesis of syngas from waste plasma gasification. The technological process of producing biomethanol includes gasification, gas reforming and catalytic synthesis [212]. One concept, discussed in a study published in [6] incorporates an innovative Absorption Enhanced Reforming (AER) gasification process, which enables an efficient conversion of a carbonaceous waste source into a hydrogen-rich gas and then, uses the Mitsubishi methanol converter (superconverter) for methanol synthesis. Analyses in this study show that the unit cost of methanol production mostly depends on the capital investments.
The researchers give a positive
outlook for the commercially competitive production of methanol from syngas.
The Fischer-Tropsch synthesis (FTS) is a well established process for the production of long-chain hydrocarbons from a CO and H2 gas mixture (usually after steam reforming of natural gas or gas from coal gasification). FTS yields a complex mixture of saturated or unsaturated hydrocarbons (C1 -C40+ ) and C1 C16+ oxygenates, as well as water and CO2 [46]. The product distribution depends on the polymerization at the surface of the catalyst (iron, cobalt, ruthenium and potassium). In the FTS, one mole of CO reacts with two moles of H2 in the presence of a cobalt (Co) based catalyst to afford a hydrocarbon chain extension (-CH2 -). The reaction of this synthesis is exothermic [167]. CO + 2H2 → -CH2 - + H2 O
(∆Hr = -206 kJ/mol)
(2.16)
The -CH2 - is a building stone for longer hydrocarbons. The FTS can be operated at low temperatures (LTFT) to produce a syncrude with a large fraction of heavy, waxy hydrocarbons (>C20 ). This can be refined to waxes or converted by hydrocracking and/or isomerization to excellent diesel, base stock for lube oils and a naphtha which is an ideal feedstock for cracking to light olefins. The FTS can also be operated at higher temperatures (HTFT) to produce a light syncrude and olefins.
These primary products can also be refined to environmentally
friendly gasoline and diesel, solvents and olefins. Biomass has been used as a feedstock for producing synthesis gas, which was consequently converted to FT liquids. This production of synfuels from biomass and waste will lower the energy cost, improve the waste management and reduce harmful emissions [46]. The syngas, originating from plasma gasification, provides an environmentally sound substitute for the natural gas as feedstock for the production of FT liquids.
43
2. Plasma Gasification The catalytic process of mixed alcohol synthesis (MAS) from syngas is one of the challenging and attractive subjects in the field of chemistry. The resultant mixed alcohols obtained from this process can be used as fuels, fuel additives for octane or cetane enhancement, and intermediates for value-added chemicals such as pharmaceuticals, cosmetics and polyester. When this conversion of syngas is developed to an efficient pathway for the production of chemicals, then the mixed alcohol technology is expected to become one of the attractive routes for lowering the petroleum dependency. In this process, the major reaction is the alcohol formation (Reaction 2.17), while hydrocarbon formation and water-gasshift reaction are side-reactions. nCO + 2nH2 → Cn H2n+1 OH + (n-1)H2 O
(2.17)
MAS is similar to methanol synthesis, Fischer-Tropsch synthesis and ammonia synthesis, but the difference is the catalyst. The above MAS reaction takes place over the catalysts with the function of hydrogenation, C-O bond breaking and CO insertion [54].
2.5.2
Slag
In some configurations, the plasma gasification of waste material can yield a vitrified slag from the inorganic components (ash and metals). The melting of bottom ash residues from gasifiers and incinerators is commonly subject to heavy metal leaching, therefore dedicated plasma vitrification facilities are already commercially operational to offset this potential liability. Generally, the results of compliance leaching and chemical testing of the vitreous slag from a plasma gasification process indicate that it is non-leaching and can be assumed as readily and completely recyclable [121]. The resulting by-product can be used as supplementary asphalt or road paving material and as ballast for railways, roads and airports tracks. Alternatively, it can replace granulates in special concrete applications (e.g. oil well cement). In addition to the use as an aggregate material, it also has potential for use in other applications where technological specifications require some combination of strength and/or particle size, such as pipe bedding and fill materials. Furthermore, it can be a raw material source for more technically demanding applications, such as insulation wool manufacture where the molten state of the slag at point of generation could be spun on high speed spinning wheels generating a mass of fine, intertwined fire resistant fibres. Other applications such as alumino-silicate geopolymers would utilize the alkalirich activated alumino-silicate content of the slag. Geopolymer binder technology 44
State of the Art based on the by-product of a plasma gasification system can offer a ‘green’ replacement to Portland cement [180].
2.6
State of the Art
It is clear that prudent use of plasmas through controlled gasification processes can offer distinct advantages in waste treatment and for future use of the syngas. Utilization of thermal plasmas for destruction of waste materials has been in the focus of interest of scientists as well as industrial companies in the recent decades. There exists only a couple of industrial-scale plasma waste treatment installations which have been in operation for some years and the number of plasma gasification developments is further increasing all over the world.
A
limited number of the plasma gasification facilities are for research and/or demonstration purposes. The configuration of these installations differs in the type of gasifier, the type of thermal plasma used (AC or DC, transferred or non-transferred and water-stabilized or gas-stabilized torches), in the position and purpose of the plasma unit (single- or two-stage systems), the material treated and the oxidizing medium.
2.6.1
Industry
The published information about industrial-scale commercial plasma gasification facilities is often very scarce. Therefore, most of the available data about these plants are based on their reported design criteria, keeping in mind that the actual operational results can possibly deviate somewhat from these numbers. The listed facilities are sorted according to the technology provider and do not include any ash vitrification or metal melting plants. An overview of the current existing industry-oriented plasma gasification facilities can be found in Table 2.1
Westinghouse Plasma Corporation (WPC) is a company which has a long track record in the plasma industry. As a wholly owned subsidiary of Alter NRG, they progressed from their know-how of plasma torches to the development of plasma gasification systems. The different generations of their gasification system are displayed in Figure 2.6. Their gasifiers are equipped with non-transferred plasma torches to provide part of the heat. The rest of the required energy for the waste processing is obtained from the chemical energy of the waste and typically by addition of coke (about 4 % of the total load) [202]. 45
2. Plasma Gasification The Waltz Mill plasma gasification pilot plant of Westinghouse Plasma Corporation which has tested a wide variety of material feedstock is located in Madison (USA). This reactor was built in 1984 with a design capacity of 48 tonnes per day (tpd) and serves as a testing unit prior to new project developments [204]. In addition to this pilot facility, Alter NRG’s WPC has a number of commercially operating reference sites with plasma assisted gasifiers using the WPC plasma torch technology [47, 158, 189, 202–206]:
• One of the first installations was the pilot-scale plasma gasification plant located in Yoshii (Japan) and operated by Hitachi Metals Ltd. It was commissioned in 1999 and could treat 24 tonnes per day (tpd) of unprocessed municipal solid waste (MSW). The plasma energy supplied to this Plasma Direct Melting Reactor (PDMR) was 100 kWh/ton of MSW, which is reportedly about 5 % of the MSW heating value. After it was demonstrated to the Japanese government that the Yoshii Waste-to-Energy facility was capable of using plasma energy to reliably and economically gasify waste materials for energy production, it was decommissioned in 2004. The lessons learned from this unit were applied to other full-scale facilities of Hitachi Metals in collaboration with Westinghouse Plasma Corporation in Japan. • The one in Utashinai uses two 83 tpd trains of primarily automobile shredder residue (ASR) as fuel but has been designed to run with a 50 % mixture of MSW. Each train can also process approximately 110 tpd of 100 % MSW. Each reactor has four WPC Marc 3a plasma torches (which can operate between 80 and 300 kW) arranged at 90° intervals around the circumference of the cylindrical reactor. When operating at capacity, the facility exports 1.5 MW of electricity to the grid [210]. • The other facility, which is located between the two cities of Mihama and Mikata, processes 17.2 tpd of MSW and 4.8 tpd of sewage sludge and became operational in December of 2002. The MSW is shredded on-site and the sewage sludge is partially dried to 50 % moisture content by the heat released from combustion of the produced syngas. Because of its smaller capacity, the reactor has only two plasma torches arranged opposite of each other. The produced slag (at 1.5 tpd) is locally used in road construction [97]. • In Ranjangaon, Pune (India) Westinghouse Plasma Corporation has teamed up with SMS Envocare LTD (a group company of SMS Infrastructure Ltd.) to build the Maharashtra Enviro Power Ltd. (MEPL) plant, which has been in operation since 2009. The plant can process up to 72 tpd of hazardous 46
State of the Art wastes (with a calorific value of 3000 MJ m−3 ), generating 1.6 MW of net electricity. The gasifier consists of two stages, with a coke bed reactor (at 1500 ◦C) as a first step and a second chamber for oxidation reactions at 1100 ◦C. Four plasma torches of 300 kW are installed of which two are in continuous operation and the other two operate one hour before lancing (molten slag removal), which is carried out two times in an eight hour shift. A similar 72 tpd of hazardous waste to energy facility (called Vidharbha Enviro Protection Limited) is also constructed in Mandwa, Nagpur (India), but no further information about this plant has been made public. • The WPC technology is also applied in an integrated biorefinery, operated by Coskata in Madison (USA). In this system, the plasma gasifier converts biomass and waste to syngas on the front end and Coskata’s syngas-tobiofuels conversion process on the back end produces bio-ethanol [23]. • In Hubei (China), the Chinese company Wuhan Kaidi converts the produced syngas from plasma gasification with biomass waste as feedstock to liquid fuels via their patented Fischer-Tropsch process. This demonstration facility has a WPC gasifier with a capacity of 150 tpd and was commissioned in 2013. • The latest project of Westinghouse Plasma Corporation is at Tees Valley, Teesside (UK). The development of this site by Air Products includes two plasma gasification units treating non-recyclable residual waste at 950 tpd. The first stage of this project is currently in commissioning. The output per unit is expected to be about 50 MW of electricity, generated from 65 000 Nm3 per hour of syngas by a combined power cycle. This plasma gasifier is the largest one in the world and is equipped with a number of Westinghouse Marc 4.5 plasma torches (550 kW per torch) [25]. Europlasma is another company that provides industrial plasma-based solutions for waste recycling. Through its subsidiary company, Inertam, it has been operating a plasma vitrification facility for the conditioning of asbestos-containing material in Morcenx (France) since 2001 with a capacity of 8000 tonnes per year (tpy). In June 2014, a new plasma gasification facility next to this one was commissioned by CHO Power. It is designed to convert 37 000 tpy of local ordinary industrial waste and 15 000 tpy of wood chips in the patented gasification technology Turboplasma. The produced syngas is generating a gross 12 MW of electricity and 18 MW of hot water which is valorized on site in the wood dryer. The gasifier includes two plasma torches, a first one to refine the raw synthesis gas produced during gasification, and a second one to vitrify metals and minerals.
47
2. Plasma Gasification
Figure 2.6: Gasifier evolution of Westinghouse Plasma Corporation [205]
Figure 2.7: Illustration of the Europlasma gasification system including Turboplasma unit
48
State of the Art The Canadian company PyroGenesis Inc. developed the Plasma Arc Waste Destruction System (PAWDS) to destroy combustible waste aboard ships. The system was installed in 2003 on the Carnival Cruise Lines M/S Fantasy ship and is able to treat ship waste such as food, paper, cardboard, plastics, wood and textiles. The typical feed rate of solid waste is 180-200 kg h−1 . The key part of this gasifier is the patented Plasma Fired Eductor which uses a 300 kW non-transferred DC plasma torch [4, 5]. Since the focus of this system is waste elimination rather than energy generation, the syngas is simply combusted. PAWDS has been specified into all of the Gerald R. Ford Class air craft supercarriers, and has been ordered by their contracted shipyard for the first two ships in this class: the CVN-78 USS Gerald R. Ford and the CVN-79 USS John F. Kennedy [30, 98]. On land, the Plasma Resource Recovery System (PRRS) of PyroGenesis Inc. was commissioned in 2011 at Hurlburt Field, Florida (USA). The system at this US air force base can process up to 3100 metric tons per year (or 10.5 tpd) of municipal, industrial, hazardous and biomedical waste [161]. In this two-stage reactor, the material is first gasified in the plasma arc furnace by means of transferred DC graphite electrodes, after which the syngas is further treated in the second gasifier chamber by a plasma torch [157]. The output is electricity from a syngas-fueled internal combustion engine (420 kW) which is used internally. The unit was sold at a government liquidation auction in May 2013 [152]. Evolving from the plasma platform developed for the US Military, PyroGenesis developed the patented SPARC process for the complete destruction of ozone depleting substances (ODS), refrigerants and other hazardous gases. The steam plasma hydrolysis reaction breaks down the waste into CO2 and H2 O with a destruction efficiency of 99.99999%. A unit capable of processing up to 50 kg h−1 of R11, R12, R134a and R141 was purchased in 2013 by Recyclage EcoSolutions (RES) located in Laval (Canada). PyroGenesis also designed and built a pilot demonstration system for the treatment of up to 50 kg h−1 hazardous waste at the National Technical University of Athens (Greece) in 2002 [153].
Plasco Energy Group has installed a pilot-scale plasma gasification plant in collaboration with Hera Plasma in Castellgali (Spain) [76]. This unit can process non-recyclable municipal and industrial solid waste at feed rates ranging from 34 to 86 kg h−1 . The purpose of the 125 kW plasma torch is syngas refining by breaking down the tars after the gasification process [43]. The plasma gasification technology of Plasco Energy Group has been showcased in Ottawa (Canada) since 2008 by the Plasco’s Trail Road (PTR) plant. At this commercial-scale demonstration facility up to 85 tpd of post-recycled MSW can be converted to 49
2. Plasma Gasification syngas which then generates 4 MW of electricity. The plasma torches are utilized to clean the syngas and to vitrify the non-gasified material. On February 12, 2015, Plasco Energy Group announced that it has obtained a court order approving the company’s application under the Companies’ Creditors Arrangement to enter bankruptcy protection [29].
A company that has published reliable experimental results from their plasma gasification demonstration unit is Advanced Plasma Power. The company was founded in 2005 to commercialize the patented Gasplasma technology initially developed by Tetronics and demonstrated at the first test facility in Farringdon (UK). Since 2007, APP is based in Swindon (United Kingdom) where they have performed several plasma gasification experiments with municipal solid waste, mined landfill RDF, contaminated wood and auto-shredder residue with maximum design material feed rate of 100 kg h−1 . The technology relies on a separated oxy-steam gasification process followed by gas treatment by DC plasma torch and vitrification of the inorganic material into a vitrified slag under the trademark PlasmaRok [45].
Another patented plasma gasification technology, called Plasma Enhanced Melter (PEM), was developed by Integrated Environmental Technologies (InEnTec). The primary power supply for the process is introduced by the DC plasma torch as plasma energy and by the AC joule heating system (see Figure 2.8). The plasma arc provides most of the energy for the gasification reactions, while the independent AC power heats and maintains the temperature of the molten glass bath. The demonstration unit (PEM model G100P) at the Columbia Ridge Facility in Arlington (Oregon, USA) owned by InEnTec (incl. S4 Energy Solutions) can convert up to 25 tpd of high carbon waste (medical, ASR, high plastic MSW, etc.) into syngas since 2011 [179]. InEnTec owns an identical installation in Richland (USA) where tests using various feedstock are being performed for treatability studies. Since 2010, a PEM model G500 owned by Dow Corning (in Midland, Michigan USA) has been transforming hazardous chlorinated organic liquids into aqueous hydrochloric acid (HCl) and syngas. This plant converts 6600 tpy of feedstock and produces syngas at a rate of 3 MW in terms of chemical energy content and 5500 tpy of HCl. Older versions of the PEM technology have been installed in Japan, Taiwan, Honolulu and Malaysia but were decommissioned after some period of time either after completion of the predetermined test campaign or prematurely because of financial reasons from the 50
State of the Art customer-side [93]. In 2007, InEnTec constructed a fully contained, self-sufficient transportable model G30 PEM on two flat-bed trailers. The system was demonstrated in March 2007 at Fort Riley Army Base in Kansas, processing municipal solid waste. The syngas produced by the system was used as fuel in a dual-fired diesel engine mounted on the second trailer.
Figure 2.8: Illustration of the PEM reactor system [178]
After a proof of concept test campaign in Monterrey (Mexico) in 2006, AdaptiveARC has installed its patented CoolPlasma technology at two locations. In 2010, a commercial prototype (second generation) began operation in Mexico City. This unit can process 60 tpd of post-recycling mixed MSW and generates electricity from the syngas through a Caterpillar engine-generator (genset). In 2012 AdaptiveARC opened a third generation facility at the University of California at Riverside together with strategic partner NRG Energy. This system is aimed at commercial acceptance testing [3, 172].
A demonstration plant was constructed by Envrionmental Energy Resources Ltd. (EER) in Yblin (Israel) in 2007 with a designed capacity of 20 tpd of MSW. 51
2. Plasma Gasification In the fixed-bed updraft gasifier of their Plasma Gasification Melting (PGM) technology an electric arc with plasma power of 240 kW is maintained in an air/steam environment [215] (Figure 2.9). This facility is also used for academic research by the Royal Institute of Technology (Stockholm, Sweden) [216]. In 2002, another PGM reactor (‘Pluton plant’) was designed and built under EER’s supervision at State Unitary Enterprise Scientific & Industrial Association ‘Radon’ (SIA Radon) for the treatment of low and intermediate-level radioactive waste (LILRW) with a capacity of 250 kg h−1 [94, 140, 151, 173].
Figure 2.9: Illustration of the PGM reactor system with 1: feed loading, 2: reactor shaft, 3: molten slag bath, 4: slag reception, 5: plasma torch, 6: gas supply and 7: syngas outlet [140]
In 1992, Plasma Energy Applied Technology (PEAT), Inc. opened their research & development facility in Huntsville (Alabama, USA) using their plasma technology in a 50-100 kg h−1 plant. The company’s Plasma Thermal Destruction & Recovery (PTDR) technology utilizes DC-powered graphite electrodes to create 52
State of the Art the plasma arc and uses pure oxygen or steam as oxidizing media. The current installations of PEAT International are listed below [126]. • A PTDR-100 system with a capacity of 60 kg h−1 was commissioned in Northern China to treat mainly petroleum sludge in 2010 and is since 2013 permanently installed in Shanghai (China) to treat medical waste for Abada Plasma Technology Holdings. • The same model was commissioned in 2010 at the commercial research and development foundry Technikon in Sacramento (California, USA). This PTDR-100 model uses a plasma heating system of 100 kW. • In 2004, a 3 to 5 tpd facility began operation at the National Cheng Kung University in Tainan City (Taiwan). The processed materials include medical waste, fly ash and organic hazardous waste. A second system installed in Taiwan by PEAT International is at the Fooyin University in Kaohsiung wich has been treating a variety of hazardous and industrial waste streams at maximum 20 kg h−1 . • A 350 kg h−1 or 6 to 8 tpd demonstration plasma gasification system was built for the US Army in Lorton (Virginia, USA) in 1999 to process agricultural blast media and medical waste. This unit was dismantled in 2001 and reallocated to Georgia Tech Research Institute. Additionally, according to their website a PTDR-100 model which was previously commissioned in Gujarat (India) in 2008, was re-commissioned in 2011 in Taichung (Taiwan), but no further information was found on this facility [150].
International Environmental Solutions (IES) Corp.
delivered their
proprietary pyrolysis system, the Advanced Pyrolytic System to Technikon [41]. The system has a capacity of 8 tpd and can treat MSW, tires, food wastes and biomass. The company filed for bankruptcy in 2012.
A plasma ordnance demilitarization system (PODS) was designed by MSE Technology Associates, Inc., ordered by the US Department of Energy and Military, and was built at the facility at Hawthorne Army Depot (Nevada, USA) in 2006 [58]. The treated material includes small, fully assembled, smoke and pyrotechnic ordnance at a design capacity of 225 kg h−1 [127].
The furnace
operates in an oxygen-enriched environment and contains a 1 MW plasma arc torch (which can operate in both transferred/non-transferred mode) and a 53
2. Plasma Gasification 500 kW non-transferred torch. The mobile version, or Mobile Plasma Treatment System (MPTS) was implemented at Talon Manufacturing Company in Herndon (WV, USA). The furnace of the MPTS operates in an oxygen-deficient (reducing) environment and contains a 500 kW non-transferred plasma arc torch.
This
system was designed to process fuses and related components at feed rates of 140 kg h−1 and was entirely skid-mounted and transportable on eight flatbed trailers [208]. These technologies were included in an exclusive distribution and reseller agreement with Global Technologies Group Inc. in 2010 [187].
A plasma arc centrifugal furnace was developed by Retech Systems LLC at the US Department of Energy’s Component Development and Integration Facility in Butte (Montana, USA) in 1991 [159]. The technology involves a centrifugal reactor volume equipped with two non-transferred plasma torches of 0.3 MW and 1.2 MW by Phoenix Solutions Co [102]. The feed rate during tests with metal-bearing soil at this site was approximately 55 kg h−1 . A full-scale facility for the treatment of hazardous and toxic waste utilizing the plasma centrifugal furnace technology of Retech was operational in Muttenz (Switzerland) in 1991. This PLASMOX facility, designed to operate at a feed rate of 1 tonne per hour (tph) was owned and operated by MGC-Plasma AG (subsidiary of Burns and Roe Group). In 1994, MGC-Plasma AG in collaboration with Retech developed also a portable PLASMOX unit model RIF2 which could be moved by four standard tractor-trailers. Under a contract issued by the Naval Research Laboratory, Retech designed and constructed the Plasma Arc Hazardous Waste Treatment System (PAHWTS) at the US naval base in Norfolk. Successful tests were performed with soil, epoxy paint, latex paint, mixture of methanol with 1,1,1 trichloroethane (TCA) at 135225 kg h−1 and oily rags at 91 kg h−1 [166]. This plasma treatment system was sold through government auction in 2007 [69].
Another company specialized in plasma-based hazardous waste destruction is SRL Plasma Pty Ltd which operates, manufactures and markets the PLASCON process.
The technology has been operating commercially since
1992 and has nine commercial plants operating. Four 150 kW Plascon units in Australia, two units which treat the liquid waste stream from 2,4 D manufacture, four plants in Japan for PCB destruction and 1 plant in United Kingdom for fire retardants and ODS [195]. Because of the lack of information on the location and details of these systems, they are not included in Table 2.1.
54
State of the Art
Figure 2.10: Illustration of the Retech gasification system Enersol Technologies Inc.
developed and demonstrated their stationary
Plasma Energy Pyrolysis System (PEPS) in cooperation with the US Army at a 10 tpd test facility located in Springfield (Virginia, USA) in 1999. The plasma torch technology used in their system is supplied by Phoenix Solutions Co. Enersol also developed a mobile PEPS unit capable of processing 3 to 5 tpd of a variety of waste streams which can be mounted on six trailers [35].
It is clear that plasma gasification was originally employed for the destruction of hazardous waste. In these type of installations, such as the PGM reactor system by EER (Figure 2.9), the torches are almost exclusively positioned at the bottom of the reactor and are operated in batch mode. The evolution in plasma gasification projects shows that the focus in the last decade has shifted towards converting a wider variety of waste (incl. municipal and industrial waste) to useful secondary resources. With the focus on resource recovery, the quality of the syngas has become more important. Therefore, the plasma aspect is incorporated in such a way that it contributes to a cleaner syngas. The plasma gasification industry is fast-growing and a lot of interesting projects 55
2. Plasma Gasification are currently being developed, which demonstrate that the emphasis lies on resource recovery: • The plasma gasification unit of futureNrg is being constructed at the Sendayan Tech Valley (Serembam, Malaysia) to convert medical waste and waste pharmaceuticals. The produced syngas will be used to generate electrical power for the plant and thermal energy through combined heat and power [60]. • A 650 tpd energy from waste facility is being developed in Barbados by Cahill Energy. The company has selected Alter NRG to supply the plasma gasification technology. The start date is scheduled in 2019 [26]. • In Bijie (China), the WPC gasification technology is part of a plan by Green World Energy Solutions to construct a waste-to-energy facility. The first phase will have the capacity to process 600 tpd of MSW and 200 tpd of other waste. The vitrified slag by-product will be converted into useful foam insulation. Full commercial operation is expected to start in 2017 [147]. • Group Machiels has launched an ambitious project in 2008 to divert (incl. recycling) 16 million tonnes of landfill waste over a period of 20 years. The non-recycled excavated waste from the Remo site in Houthalen-Helchteren (Belgium) will be treated by plasma gasification technology supplied by Advanced Plasma Power. The required throughput is 450 000 tpy, which will generate in excess of 100 MW of net electricity [182]. • Another project being developed by APP is planned at Port of Hamilton in Ontario (Canada). The Gasplasma technology will be used to process up to 170 000 tpy of commercial and municipal waste, which will generate 20 MW of net electricity from syngas. • Solena Fuels has committed to build a facility which will convert landfill waste to jet fuel at Thames Enterprise Park in Essex (UK). According to their website, Solena’s Integrated Biomass-Gas to Liquid solution is based on an industry-proven Fischer-Tropsch platform coupled with Solena’s proprietary high temperature plasma gasification [174]. As the plasma gasification technology is maturing, it is to be expected that future projects will opt for integrated plasma gasification processes (e.g. integrated plasma gasification combined cycle).
Besides the established plasma gasification facilities, there exists also a long list of launched projects which have been cancelled in the past. The reasons 56
State of the Art these projects were scrapped are often financial when failing to secure the large investments needed for commercial plasma gasification developments. A second common reason is the intensive process of obtaining the necessary environmental permits. One of the important elements of a project to become successful projects is the location of the plasma gasification unit. The location is crucial in securing a constant availability of waste for the plant. The development of a plasma treatment facility is therefore often a cooperative effort between local private and/or intercommunal (waste) syndicates, the technology providing company and possibly a company for the downstream use the gasification products. Similar to the availability of the input, there should also be a stable market for the output of the plant, whether it is electricity and/or heat, or chemicals. It is clear that a well-defined structure and direction for the purpose of the plasma gasification unit from the input to the output is needed.
Not only financial, organisational and planning mistakes have failed some of the launched plasma gasification projects, there are also a number of technological bottlenecks which proved to be insurmountable in some cases. Plasma gasification reactors need to be able to handle multiple tonnes of waste per hour in order to be financially viable. Because the technology is relatively new, many of the technology providers only have a pilot-scale installation capable of processing a couple of tonnes per day. This means that the capacity of the proposed reactor systems are often up to two orders of magnitude larger than the proven demonstration unit. One of the consequences of design flaws due to overambitious up-scaling are cold spots leading to incomplete gasification. Other technological problems can include the material for refractory lining and particulates build-up and clogging of piping and the afterburner. Adding these challenges to the technological barriers inherent to plasma torches (such as torch efficiencies and electrode lifetime), it becomes evident that a plasma gasification project needs to be very-well engineered in order to benefit from the potential of the technology.
2.6.2
Academic
Besides the previously listed reactors from PEAT International at the National Cheng Kun University in Taiwan and at Georgia Tech Research Institute (USA) [122], from Pyrogenesis at the National Technical University of Athens (Greece) [1] and from AdaptiveARC at the University of California (USA) there
57
2. Plasma Gasification exists a number of additional plasma gasification unit for academic research purposes. • A lab-scale plasma gasifier equipped with a steam plasma torch has been constructed and used for gasification experiments since 2005 by the Institute of Nuclear Energy Research (INER) in Taipei (Taiwan) in addition to their plasma melter facility for low-level radioactive waste [186]. The unit is equipped with a 100 kW non-transferred plasma torch and has a maximum material throughput of 10 kg h−1 . Since 2009, a second 500 kW pilot-scale plasma gasification plant is operational and generates syngas from biomass for the production of DME [32]. • The pilot-scale installation at the Institute of Plasma Physics, Academy of Sciences of the Czech Republic (IPP-ASCR) in Prague was constructed in 2005. This realization was made possible by the financing of Envitech (Belgium) and via the collaboration with Ghent University (Belgium). Research on this plasma gasification system is presented in this work and the details of this configuration are discussed in Paragraph 5.2.1. • The Institute of Electrophysics of the Russian Academy of Sciences (St. Petersburg) owns a shaft reactor with a 50 kW DC torch mounted on top. It can process up to 50 kg h−1 of solid industrial waste [21], low radioactive waste and medical waste. • The Institute of Mechanics, Chinese Academy of Sciences (CAS-IMECH) in Beijing (China) developed a 150 kW DC plasma pyrolysis installation and a smaller laboratory-scale 30 kW DC plasma arc reactor for the destruction of chemical wastes [113].
2.7
Conclusions
Compared to the four main types of conventional gasifier design, the configuration of plasma gasification reactors is much more varied. The integration of a plasma element in a plasma gasification system is clearly strongly dependent on the type of material treated and the desired specifications of the end-products. Some general design features which can be distinguished among the variety of plasma gasifier configurations are: • Single-stage or two-stage. As mentioned previously, either the plasma jet enters in the same volume where the gasification process occurs (singlestage) or the plasma treatment can be a separate step for cleaning the syn58
Conclusions gas and/or melting the inorganic residues downstream from the gasification chamber (two-stage). • Continuous or batch material feeding. Most of the plasma gasification systems have a continuous material feeding mechanism. Hazardous material which needs to be well-contained during transport and/or pre-handling is most-likely loaded in batch-mode into the reactor. • Position and type of plasma torch. In almost all of the plasma gasifiers, the plasma flow is positioned near the bottom of the reactor volume. Fresh material is gradually passing through the high-temperature region created by the plasma jet(s), where the gasification of the material is taking place. A shaft reactor is the matching gasifier shape for this torch configuration, in which the stack of material is slowly moving down as the bottom of the pile is being converted to syngas (see Figure 2.6). An exception to this set-up is the in-flight plasma gasification system. The exit of the plasma torch is located at the top of the reactor, next to the point-of-entry of the treated material. The waste stream falls freely under gravitational force into the volume, where it immediately passes the plasma jet region and is assumed to be instantaneously gasified. This type of plasma gasification system is operational at the Institute of Plasma Physics in Prague (Czech Republic) and has been proven successful for the treatment of fine homogeneous biomass particles. The material of interest in the experimental part of this thesis is refuse-derived fuel (RDF). In a traditional gasification system, a fluidized bed or downdraft configuration would be selected to process this type of waste, because of their capability of handling coarse heterogeneous material and the higher operating temperatures. Some plasma gasification facilities were listed in this chapter that are treating municipal solid waste (somewhat similar to RDF). Either their configuration is similar to a downdraft gasifier or they are two-stage systems, but no single-stage in-flight plasma gasification system. Therefore, it would be interesting to test the performance of the single-stage research unit at the IPP for gasifying material with a high inorganic content, such as RDF.
59
Table 2.1: List of existing plasma gasification facilities Country
USA
60 Japan
India
City
Company
Feedstock
Technology provider
Year
Downstream processing
Output
Madison, Wisconsin Carnival cruise ship USS Gerald carrier Hurlburt Field, Florida
Coskata
biomass and waste
WPC
2009
fermentation
bio-ethanol
Carnaval Cruise Lines US Navy
Pyrogenesis
2003
combustor
Pyrogenesis
2012
combustor
Pyrogenesis
2011
gas engine
WPC
200 kg h−1 of shipboard waste 200 kg h−1 of shipboard waste 3100 tpy of MSW, IW, hazardous & biomedical waste 48 tpd of various waste
WPC
1984
combustor
InEnTec
25 tpd of high carbon waste
InEnTec
2011
Dow Corning Corporation InEnTec
6600 tpy of hazardous chlorinated organic liquids 25 tpd of various waste
InEnTec
2010
InEnTec
2009
NRG Energy
MSW, biomass, construction debris 8 tpd of biomass and waste
AdaptiveARC
2012
Madison, Wisconsin Arlington, Oregon Midland, Michigan Richland, Washington Riverside, California Sacramento, California Sacramento, California Atlanta, Georgia Mihama Mikata Utashinai Pune Nagpur
UK
Teesside
US military
Technikon Technikon
60 kg h
Georgia Insitute of Technology Hitachi Metals Hitachi Metals SMS Envocare Ltd. SMS Envocare Ltd. Air Products
−1
of various waste
electricity intern
HCl + syngas
Caterpillar genset
electricity
heat to dry sewage sludge 1.5 MW net electricity 1.6 MW net electricity 1.6 MW net electricity 45 MW net electricity
IES PEAT
2010
6-8 tpd of various waste
PEAT
2001
17.2 tpd of MSW and 4.8 tpd of sewage sludge 2 trains of 83 tpd of ASR or 110 tpd of MSW 72 tpd of hazardous waste
WPC
2002
boiler
WPC
2003
steam turbine
WPC
2009
steam turbine
72 tpd of hazardous waste
WPC
2011
steam turbine
950 tpd of non-recyclable residaul waste
WPC
2014
combined cycle
Table 2.1: List of existing plasma gasification facilities (continued) Country
Canada
China
City
Company
Feedstock
Technology provider
Year
Downstream processing
Output
Swindon
APP
100 kg h−1 of various waste
APP
2007
60 kW electricity
Ottawa, Ontario Laval, Quebec
Plasco
85 tpd of post-recycle MSW
Plasco
2008
Liebher gas engine gas engine
Recyclage EcoSolutions Abada Plasma Technology Holdings Wuhan Kaidi
50 kg h−1 of R11, R12, R134a and R141 60 kg h−1 of medical waste
Pyrogenesis
2013
PEAT
2013
150 tpd of biomass
WPC
2013
Biosistemas Sustentables National Cheng Kung University (NCKU)
60 tpd of post-recycling mixed MSW 3-5 tpd of industrial waste and toxic waste (incinerator fly ash, medical waste and inorganic sludge) 50 kg h−1 of hazardous waste
AdaptiveARC
2010
PEAT
2004
Pyrogenesis
2002
37 000 tpy of IW and 15 000 tpy wood chips
Europlasma
85 kg h−1 of non-recyclable MSW and IW 250 kg h−1 of LILRW 20 tpd of MSW
Shanghai
Hubei Mexico City
Taiwan
Tainan
Greece
Athens
France
Morcenx
National Technical University of Athens CHO Power
Spain
Castellgali
Hera Plasma
Russia Israel
Moscow Yblin
Sia Radon Environmental Energy Resources
61
Mexico
4 MW net electricity CO2 + H2 O
Fischer Tropsch Caterpillar genset
liquid fuels
2014
gas engine + steam turbine
12 MW net electricity + heat for wood dryer
Plasco
2007
combustor
EERE EER
2002 2007
420 kW electricity intern
Chapter
3
Plasma Modelling
3.1
Background
Thermal plasmas provide opportunities for materials processing due to their high energy content and high energy density. Thermal plasma processing techniques of current interest include spraying, cutting, coating, synthesis, sintering, extractive metallurgy and waste treatment, among others (see Fauchais and Vardelle [56] for a detailed list of thermal plasma applications). The plasma system of choice for these processes is primarily a DC arc plasma torch. The apparent simplicity of this type of plasma torch is in contrast with the highly complex plasma flow phenomena. To gain a better understanding of the physical phenomena (electrical, chemical and thermal) and to drive the continuous development and improvement of thermal plasma based technologies, a large amount of computational fluid dynamics (CFD) modelling has already been done. The overall goal of these numerical studies is to develop models that can correctly predict the plasma flow characteristics (temperature, velocity and concentration fields) and consequently the interaction of the flow with solid or liquid materials in plasma processes (e.g. plasma gasification). In all plasma jet simulations described in literature, independent of the specific case set-up, the same physical mechanisms and model aspects are included. The approach and assumptions used in their implementation strongly influences the accuracy of the simulation results. A short description of the main elements in63
3. Plasma Modelling volved in the CFD modelling of thermal plasma is given here. A full description of these elements can be found in the review by Trelles et al. [183].
3.2
Physical Phenomena
Several physical phenomena specific to thermal plasma problems need to be accurately accounted for in the CFD modelling.
3.2.1
Fluid Models
The thermal plasma flow can be assimilated to a fluid with Navier-Stokes equations describing its hydrodynamic movements. The conservation or continuity equations for an incompressible plasma, assuming negligible temporal and spatial pressure variations, are [136]: The equation of mass continuity: ∂ρ + ∇ · (ρv) = 0 ∂t The equation of momentum conservation: ∂ (ρv) + ∇ · (ρvv) = −∇p + ∇ · τ + ρg + j × B ∂t The energy conservation equation: ∂ (ρh) + ∇ · (ρvh) = − ∇ · ∂t
q X
! hi J i
−R+∇·
i=1
�
k ∇h Cp
� −∇·
(3.1)
(3.2) q k X hi ∇Yi Cp i=1
j2 5kB + + j · ∇h (3.3) σ 2eCp in which the first four terms on the right-hand side describe respectively changes in enthalpy due to diffusion, net radiative emission and two thermal conduction terms. The mass continuity equation of species i: ∂ (ρYi ) + ∇ · (ρvYi ) = −∇ · Ji + ri (3.4) ∂t with ri the net rate of production of species i due to chemical reactions if applicable. If electromagnetic effects are rigorously included in the calculations, besides adding the Lorentz force to the momentum equation and the Joule heating and electron enthalpy flux terms to the energy equation (coloured blue in the equations 3.2 and 3.3), two additional equations are required to describe the flow of charge, i.e. the current continuity equation and the Maxwell’s equations:
64
∇·j =0
(3.5)
∇ × B = µ0 j
(3.6)
!
Physical Phenomena In the above equations, v is the mass-average velocity of the gas, p is the pressure, h is the plasma enthalpy per unit mass, j is the current density, Ji is the mass flux of species i relative to the mass-average velocity, Yi is the mass fraction of species i, B is the magnetic field induced by the current, τ is the stress tensor, R is the net energy loss by radiation, g is the gravity, kB is the Boltzmann’s constant, e is the electronic charge and µ0 the permeability of free space. The gas properties are mass density ρ, thermal conductivity k, electrical conductivity σ and specific heat at constant pressure Cp .
The approach to solving the flow governing equations depends on the fluid description of plasma. The most frequently used thermal plasma models rely on the assumption of Local Thermodynamic Equilibrium (LTE). This requires that the velocity distribution function and population density of excited states for each species are described by a Maxwellian distribution, that the concentration of the species present can be calculated assuming chemical equilibrium and that the translational, excitation and the reaction temperatures are equal. This means that the plasma flow can be described as a reactive fluid in chemical equilibrium in which the internal energy of the fluid is characterized by a single temperature T [136, 183]. Departures from thermal equilibrium can be taken into account by solving two energy equations, one for the heavy particles at temperature TH and the other for the electrons at temperature Te . Hence, such thermodynamic non-equilibrium thermal plasma models (NLTE) are also known as two-temperature models. An even more fundamental approach to the description of thermal plasma flow is to represent plasma as a multicomponent, chemically reacting ideal gas. In such chemical non-equilibrium models, neutrals, ions and electrons are considered as separate components or species of the plasma among which arbitrary numbers of kinetic and equilibrium chemical reactions can occur [155].
3.2.2
Turbulence
The plasma jets encountered in most thermal plasma applications are characterized by a turbulent flow state. The large velocity and temperature gradients together with electromagnetic effects cause the flow to become unstable and turbulent. One of the physical phenomena which causes turbulent instabilities is the changing anode attachment position of the arc caused by the interplay among thermal, magnetic and electrochemical forces within the plasma column. The resulting turbulent plasma jets are usually accompanied by strong entrainment 65
3. Plasma Modelling of ambient gas into the jet and with short high-temperature region lengths. In some materials processing techniques, these features are not desirable, which has triggered the development of (DC) laminar plasma jets [213]. Cheng et al. [28] compared the flow field characteristics of simulations of laminar and turbulent argon plasma jet issuing into ambient air. It was found that significant differences exist in the entrainment mechanisms, spreading angle of the jet and in the influence of parameters of the plasma boundary conditions. In the majority of the plasma models in literature, the flow regime is turbulent. The modelling of turbulence can be done by several different approaches. The use of turbulence models in thermal plasma flows is significantly more involved than for most other industrial applications due to their inherent characteristics (mainly large property variations) [183]. The most accurate numerical description of turbulent flows is direct numerical simulation (DNS), in which no approximations for solving the flow equations are included. Due to the high computational cost of this technique for resolving the whole range of flow length scales, no DNS of a thermal plasma has been performed yet. Large Eddy Simulation (LES) is an alternative approach to DNS which resolves the large scale turbulent perturbations in the flow and models only the smaller scales. Accurate simulations with LES require accurate spatial and temporal discretization. The use of LES as turbulence model is gradually gaining popularity [12, 33, 128], but the most widely used methods for modelling turbulence are still the Reynolds-averaged Navier-Stokes (RANS) models. These models seek the solution of approximations of the time-averaged Navier-Stokes equations [183]. Many different types of models exist in this group, but the most popular RANS turbulence model is the k-� model, where k stands for the turbulent kinetic energy and � its rate of dissipation. This approach to modelling turbulence may provide an adequate description of the flow for transferred torches, whereas the LES approach is more appropriate for the highly unsteady non-transferred torches.
3.2.3
Radiation
Radiation is an important phenomenon in thermal plasmas as it represents the largest energy loss term in the hottest regions. The total radiative flux source term in the energy equation is a function of the spectral intensity, which is found by solving the radiative transfer equation (RTE). Because of the very complicated and exceedingly expensive computation, it is not possible to rigorously solve the RTE. Therefore, several types of simplified models are often employed to account for the radiative transport in thermal plasmas. The most frequently used methods are the Discrete Ordinates Methods (DOMs), 66
Physical Phenomena the P-1 method (simplest case of the P-N method, which is based on the expansion of the radiation intensity into an orthogonal series of spherical harmonies [129]) and the Net Emission Coefficient (NEC) method [114]. The latter approach directly estimates the net radiation (i.e. the difference between emission and absorption) through the net emission coefficient, which for a given plasma forming gas can be expressed as function of temperature and an effective absorption radius Rp of an isothermal sphere in which re-absorption occurs. A more elaborate discussion on radiative transport in plasmas can be found in Trelles et al. [183].
3.2.4
Diffusion
The process of diffusion between different species (or group of species) can occur due to species concentration gradients, pressure gradients, temperature gradients and external forces. An example of the latter driver of diffusion is ambipolar diffusion, which is manifested between charged particles by an externally applied electric field and the electric field that arises because of the tendency of electrons to diffuse more rapidly than ions. In this paragraph the diffusion due to difference in concentration is briefly touched upon. The most accurate way to model diffusion is to treat each species (molecular, atomic or ionic), derived from a given atomic or molecular gas, separately. The calculation of the diffusion flux then relies on multicomponent diffusion coefficients, dependent on the mole fractions and masses of all the species present and on the collision cross sections for interactions between all the species. This approach has the advantage that it does not require the assumption of local chemical equilibrium (LCE) and that chemical reactions between the species derived from the different gases can be treated. However, the complexity of implementation of this rigorous method for a large number of species (typical for plasma flows) has created the development of several different approximations to model diffusion. These approximations treat diffusion in terms of the binary diffusion coefficients Dij which depend only on the properties of species i and j. As mentioned above, in most plasma modelling problems, LCE is assumed. For these cases, the species derived from each gas are grouped together and the diffusion is described between the gases involved. The different approximations for the estimation of the diffusion coefficients for a mixture of two gases are comprehensively described by Murphy [133]. The expressions which are discussed are the binary diffusion coefficient approximation, the first and second viscosity approximation, the quasi-binary diffusion coefficient approximation and the combined diffusion coefficient method. In the same publication by Murphy [133], a number of sample calculations were 67
3. Plasma Modelling performed to evaluate the accuracy of the diffusion coefficients calculated using each of the previously mentioned methods. It was concluded that the combined diffusion coefficient treatment is required for an acceptably accurate treatment of diffusion phenomena in plasmas in LCE [135].
3.3
Modelling Aspects
Besides the physical phenomena within the flow, there are also some aspects in plasma modelling which are inherent to the specific case set-up. These aspects are further elaborated upon.
3.3.1
Dimension of Space
One-dimensional (1D) stationary plasmas, corresponding to wall-stabilized arcs, are the simplest cases of thermal plasma models. In such models, the plasma is characterized by the temperature T , which depends only on the radial position r and can be calculated by solving the energy conservation equation [67]. For transient 1D plasma models, the cooling of the plasma is assumed to be instantaneously compensated by radial convection. For this type of model, two time-dependent conservation equations (mass and energy) are solved with temperature T (r, t) and radial velocity v(r, t) as unknowns. More common is the development of two-dimensional (2D) plasma models. The two-dimensional formulation allows calculation of either planar or axisymmetric plasma flows [155]. Flows having axial symmetry are described by 2D cylindrical coordinates and its axisymmetric formulation permits the calculation of an azimuthal velocity component (or swirl). A lot of plasma phenomena are inherently three-dimensional (3D) and are thus ignored by a 2D approach. This necessitates the use of 3D plasma models which can account more accurately for anode attachment fluctuations, three-dimensional turbulent structures, etc. The difference in results between a 2D and 3D approach when modelling a nontransferred DC plasma torch was described by Bhuyan and Goswami [14]. They reported significant differences between the control parameters, caused by the inability of the 2D model to realistically simulate the arc which exhibits local attachments in the circumferential direction.
3.3.2
Computational Domain
First, the dimensions of the computational domain should be selected sufficiently large around the area of interest. The size of the domain can determine the sensitivity of the simulation results to the choice of boundary conditions. Furthermore, 68
Modelling Aspects the discretization of the domain into a computational grid allows to solve the set of partial differential equations. The mesh size should be sufficiently fine in order to obtain a solution which is invariant with finer mesh sizes. The correct grid size is evaluated through a grid independence study [209]. Besides the size of the mesh, the quality of the cells can also influence the convergence of the simulation and the final result. The choice of geometry also strongly determines the boundary conditions of the calculation. This is well illustrated by Selvan and Ramachandran [168], who compared two three-dimensional arc plasma torch simulations with different geometries. In plasma modelling, the choice of the computational domain is dependent on the plasma area of interest. An important distinction is made between plasma arc models and plasma jet models. In the former type of models, the computational domain is predominantly the inner volume of the torch chamber in which the electromagnetic effects of the plasma column and the interaction with the stabilizing medium are often investigated. In plasma jet models, the computational domain is the area outside of the torch and the inlet boundary conditions for the plasma are imposed on the exit nozzle of the plasma torch.
3.3.3
CFD Software
A limited number of research groups has developed their own in-house fluid dynamics software for modelling plasma flows. One of the most complete and welltested computational models is the computer code LAVA, developed by Ramshaw and Chang [155]. In this software, the governing equations for a multicomponent chemically reacting ideal gas are solved using standard finite-difference techniques with explicit temporal differencing. In Williamson et al. [209], the capability of reproducing the general features of the interaction of a plasma jet with its surrounding environment using the LAVA environment was demonstrated. Most research efforts in the thermal plasma community are being performed using commercial software packages, such as FLUENT, COMSOL, PHOENICS, ESTET, etc. Boussagol et al. [19] presented a comparison of numerical simulations of a DC plasma jet flowing in air using two commercial three-dimensional computational fluid dynamics codes, ESTET and FLUENT. The flow fields computed by both codes exhibited significant differences despite using the same model setup. This shows that the numerical algorithms and the approach in modelling turbulence used by the commercial codes, which are not specialized for plasma problems, can affect the flow field.
69
3. Plasma Modelling
3.3.4
Time Dependency
The CFD simulations of a plasma flow can be done assuming steady-state conditions or by a transient (unsteady/time-dependent) approach. Two successive sets of numerical simulations were performed by Mariaux and Vardelle [118] to investigate the effect of time-dependency on the flow field. The first calculations were done at steady-state conditions and the second set of calculations was dedicated to the unsteady-state calculations of the plasma flow. The results show that the flow fields are subjected to important time-variations close to the exit nozzle, which require accurate time-dependent boundary conditions. This is especially the case if the objective of the modelling is to study the turbulent behaviour of the plasma flow.
3.4
Thermophysical Properties
Thermodynamic and transport properties of the plasma are important inputs for the fluid dynamic modelling of plasma jets. In this paragraph, the description of the calculation of these properties (applicable to plasma systems in LTE) is presented. Obtaining the equilibrium composition of the gas system is the first prerequisite step in the calculation of thermodynamic and transport properties. The local composition of a plasma in LTE is determined only by the local temperature, pressure and concentrations of the constituent chemical elements. The standard technique for calculating the composition is the Gibbs free energy minimization approach assuming the plasma is an ideal gas. The required thermodynamic data for the individual species are available in tables, such as the JANAF tables [27]. The main processes which occur in the temperature range from room temperature to 20 000 K are dissociation of molecules at low or intermediate temperatures, followed by partial ionization with the formation of ions and electrons and the disappearance of the molecules and finally, at high temperatures (T>15 000 K) the gas is almost totally ionized. Once the species composition is known, the thermodynamic properties (enthalpy (H), density (ρ), molecular weight (M ), speed of sound (c) and specific heat capacity (Cp )) of a closed gaseous system in thermodynamic equilibrium at constant pressure and temperature can be directly calculated from particle number densities (from the equilibrium composition) and internal partition functions [37, 38]. The calculation of the transport properties (thermal conductivity (k), viscosity (µ), etc.) is based on solving the Boltzmann integral-differential equation describing the evolution of the electron energy distribution function 70
Thermophysical Properties by the well-known Chapman-Enskog method [104]. The transport coefficients are approximated using Sonine polynomials.
The data necessary for these
calculations are the particle number densities and the collision integrals [67]. Detailed information about the methods used for the equilibrium and transport properties calculation can be found in Murphy and Arundell [139].
In the modelling of plasma processes, the plasma gas from the torch is represented by either a pure gas, such as argon [48, 91, 110, 111, 201] or a gas mixture with fixed composition (e.g. 50 %Ar–50 %H2 ) [12, 13, 49, 71, 118, 124, 125, 196]. LTE thermodynamic and transport properties are available for most of these plasma gases (either pure gases or gas mixtures with fixed composition) as a function of temperature and pressure [183]. In many thermal plasma problems, the medium rarely consists of a single gas, but is made up of a mixture of gases. The plasma gas can be defined as a variable mixture of different gases and additionally, the plasma gas can mix with other surrounding gases. For these multicomponent mixtures, the local gas composition cannot be known a priori and therefore it is necessary to solve the species conservation equation(s) in the CFD simulations. The properties of the gas mixture are then determined from the local species concentrations, temperature and pressure. There are two general methods of doing this. In the rigorous method, the equilibrium composition is first determined considering the complete system of all gases considered, after which the thermodynamic and transport properties are calculated and stored in a multidimensional matrix as a function of gas concentrations and temperature (and pressure if applicable). This way, not only the products of ionization and dissociation of the pure gases, but also combined ions and molecules from the interactions between different gases are considered. The accurate thermodynamic and transport properties are then directly assigned to the gas mixture through interpolation of this pre-calculated matrix during flow calculations. Because all possible species, formed from the different gases are included in the calculation of the species composition of the complete system, this method is often referred to as the full multicomponent approach. This approach was applied by Vincent et al. [196], Trelles et al. [184] and Colombo et al. [34] in their plasma flow simulations. In the second approach for calculating thermophysical properties of a gas mixture, first the equilibrium composition and the physical properties of each gas are determined separately. Consequently, these temperature-dependent properties of the pure gases are used with mixing rules to estimate the gas mixture properties. This method cannot take into account possible chemical reactions between the 71
3. Plasma Modelling various gases and therefore only the effect of dissociation and ionization of each individual gas is included in the properties of the gas mixture. Details of these mixing rules are discussed in the next paragraph.
3.4.1
Different Mixing Rules
The development of reliable mixing rules, which would allow the transport coefficients of gas mixtures to be determined from those of pure gases, has been a topic of interest for more than 50 years [137]. Several authors tend to use mixing rules because of the accessibility of the necessary data and because of the simple implementation and fast execution. Mixing rules based on simple species proportionality in terms of mass fractions or molar fractions are generally used for non-reactive mixture components and at low temperatures. For some of the thermodynamic and transport properties, the application of these rules at high temperatures is acceptable, while for other properties, the effects of dissociation and ionization at elevated temperatures cause significant deviations from the exact values. An analysis of the influence of using mixing rules on the mixture properties has been published by Gleizes et al. [66], who identified large variations in properties of gas mixtures with metallic vapours depending on the chosen mixing rules. In the majority of CFD simulations, the gas concentrations are expressed in mass fractions. Since some mixing rules rely on molar proportions, considering a binary gas mixture, these can be calculated as: yi M
xi = X i
(3.7)
yi Mi
i
in which x1 and x2 are the molar fractions of the gases in the mixture, y1 and y2 are the mass fractions and M1 and M2 the molecular weights. 3.4.1.1
Density
The mass density (ρ in kg m−3 ) can be calculated from the plasma composition (expressed in number density ni in mol m−3 ) and the molecular weights of the components: ρ=
X
ni Mi
(3.8)
i
By constructing a set of equations which describe the total number densities of the heavy species in terms of the molar fractions of the mixture elements, the density can be eventually calculated from the electron number density (ne ), which relates to the total number density (N ) as: N= 72
p − ne kB T
(3.9)
Thermophysical Properties A good agreement between the exact values and this approximation via the electron number density was found [66]. However, it is generally not necessary to use this method as a simple molar interpolation (Equation 3.10) between the mass densities of the gases only leads to small departures from the exact solution. ρ=
X
(3.10)
xi ρ i
i
3.4.1.2
Specific Heat
The specific heat at constant pressure (Cp in J kg−1 K−1 ) is derived from enthalpy. For a non-reacting gas mixture, the difference in enthalpy values between rigorous calculation and mass interpolation between the individual gases is small. However, the use of mixing rules for a reacting gas mixture omits the contribution of species combined from the constituent elements of the gases in the enthalpy calculation. Hence, the calculation of heat capacity via mass interpolation between the individual gas properties can lead to erroneous results. The mixing rules for specific heat should be evidentially expressed in mass proportions because Cp is defined in mass units. Cp =
X
(3.11)
yi Cp,i
i
3.4.1.3
Viscosity
The mixing rules developed by Wilke [207] are perhaps the best known formulas for the estimation of dynamic viscosity (µ in kg m−1 s−1 ) of a gas mixture. µ= with φij
1 = √ 8
�
Mi 1+ Mj
X
Pxi µi
i
j
� 12 "
(3.12)
xj φ j
1+
�
µi µj
� 12 �
Mj Mi
� 14
#2 (3.13)
Comparison of the mixing rule of Wilke with adapted formulas by Vanderslice et al. and Yun et al. [214] and molar and mass proportionality rules was done by Gleizes et al. [66], which revealed the best fit for the mixing rule of Yun et al. (Equation 3.14) and showed an inaccurate approximation by the Wilke’s mixing rule.
µ1 µ2 + (3.14) 15Rµ1 15Rµ2 1+ 1+ 4Λ12 M1 4Λ12 M2 where (R/Λ12 ) is a parameter function of temperature depending on the viscosity µ=
of the equimolar mixture.
73
3. Plasma Modelling Similar results were obtained by Murphy [137] who compared the exact values for the temperature-dependent viscosity for a mixture of 25 % nitrogen and 75 % with the results obtained from the mixing rules of Yun et al. [214], Wilke [207] as well as with a mole-fraction-weighted average. Palmer and Wright [148] also reviewed the performance and accuracy of four commonly used mixing rules (full multicomponent approach versus mixing rules of Gupta-Yos, Armaly-Sutton and Wilke) for determining viscosity of 11-species air and hydrogen-helium gas mixtures at high temperatures and found that the Gupta-Yos mixing rule gives acceptable results for weakly or non-ionized flows, while the Armaly-Sutton mixing rule is applicable to higher temperature, more strongly ionized flows by adequately tuning the parameters of the method. 3.4.1.4
Thermal Conductivity
The most popular mixing rule for thermal conductivity (k in W m−1 K−1 ) is the one proposed by Mason and Saxena [120]. Their method is an approximation to a more accurate method given by Hirschfelder [78]. This mixing rule is analogous to the mixing rule of Wilke, proposed for viscosity (Equation 3.12) with an additional empirical factor 1.065 to establish self-consistency for mixtures of identical species.
" k=
X
X
1+
i
k=1,k6=1
with Gik
1.065 Mi = √ 1+ Mk 2 2
�
�− 12
" 1+
xk Gik xi
�
#−1
µ i Mk µk Mi
(3.15)
� 12 �
Mi Mk
� 14
#2 (3.16)
Similar to the mixing rule of Wilke for viscosity, the mixing rule for thermal conductivity by Mason and Saxena was derived for mixtures of non-ionized gases, considering only elastic collisions. They assume that the off-diagonal terms in the matrix that is inverted in calculating the respective transport properties is zero, and that all interactions between species belonging to different gases have the same cross-section [148]. They give reasonable results at lower temperatures, before dissociation and ionization occur, but are generally inaccurate at higher temperatures [66, 137, 148]. The dissociation peaks in the evolution of thermal conductivity as a function of temperature are caused by the contribution of inelastic collisions (called reactive thermal conductivity), which are not taken into account by the mixing rules. Another mixing rule for thermal conductivity is the Wassiljewa approximation [149] which limitations were discussed by Fauchais et al. [50].
74
Conclusions
3.5
Conclusions
As mentioned in Section 1.4.4.3, the development and application of the previously described hybrid water/gas stabilized DC plasma torch would benefit significantly from a CFD model capable of correctly describing the plasma jet. Because of the combined stabilization effect of this unique torch, the physical properties of the plasma flow are distinctively different than a plasma generated by water or gas-stabilized torches. In order to adequately simulate the flow field and the entrainment processes at the fringes of the jet, extra attention needs to be given to the calculation of the thermodynamic and transport properties of the resulting plasma gas mixture. Since the goal is eventually to incorporate the CFD description of this plasma jet into a larger model where the plasma interacts with other gases and/or material, it is very likely that the mixing rules which are fastest and easiest to implement will be used. The most common choices for the estimation of transport properties of a gas mixture are therefore the mixing rules of Wilke (Equation 3.12) and Mason and Saxena (Equation 3.15). Despite their advantages in simplicity, however, it is not clear how their inaccuracy might affect the simulated flow field of a plasma jet.
75
Two CFD Modelling of Plasma Jet - Effect of Mixing Rules
Chapter
4
Numerical Modelling of Ar/H2 O Plasma Jet with Different Mixing Models
4.1
Introduction
The setting of thermal plasma applications is often in an environment containing a lot of different gases. A perfect example is the use of a non-transferred plasma torch in plasma gasification. In such a system, the plasma gases interact with gasifying agents, as well as with product gases from the gasification reactions. When modelling the entrainment of surrounding gas(es) into a plasma jet, the thermophysical properties of the resulting gas mixture need to be determined in each node of the computational grid. The rigorous approach to the calculation of thermodynamic and transport properties of the gas mixture, in which they are interpolated from a pre-calculated multidimensional matrix in terms of temperature and mass fractions of all gases involved (and possibly pressure) can become overly cumbersome due to the complexity of the calculation routines and the computational expense. Also, the large dataset needed to calculate the properties according to the full multicomponent approach is not always readily available. Therefore, it is necessary to use mixing rules for the calculation of the thermodynamic and transport properties of the gas mixture in complex multi-gas systems at high temperatures. The importance of the accuracy of the mixing rules was emphasized by Murphy [139] who stated that accurate values of the transport 79
4. Numerical Modelling of Ar/H2 O Plasma Jet with Different Mixing Models coefficients and the thermodynamic properties of high-temperature gases and gas mixtures are indispensable inputs in the CFD modelling of thermal plasma processes. Also Trelles [183] pointed out that the accuracy of results strongly depends on the use of suitable thermodynamic and transport properties. Hence, the accuracy of different mixing rules (especially for transport properties) has already been compared in literature, as presented in Paragraph 3.4.1. From these comparative analyses of the mixing rules for transport properties, it was concluded that the expressions formulated by Wilke and Mason and Saxena are lacking in accuracy. Nevertheless, they are perhaps the best-known formulas and they continue to be used very frequently in plasma jet simulations [12, 19, 71, 124]. Their simplicity of implementation is often preferred over improved accuracy. The previous discussion about the mixing rules was strictly limited to the stand-alone evaluation of their accuracy compared to the exact values without a link to the implications on the simulated flow field. In the literature, the possible effect of the errors introduced on the flow field from inaccurate values for viscosity and thermal conductivity (calculated with mixing rules) are frequently ignored by assuming that their contribution is negligible in relation to their turbulent counterparts [50, 209]. This might be the case in the main part of the computational domain where the flow field is characterized by a turbulent regime, but not necessarily in the region close to the torch exit. The onset of turbulence only occurs from roughly 20 mm downstream of the exit nozzle [55], so the molecular properties determine the flow field to a great extent in the high-temperature core and at the fringes of the plasma column in the laminar region of the plasma jet close to the exit nozzle. It is therefore relevant to investigate the effect of the method for calculating thermodynamic and transport properties of a gas mixture on the simulated flow field of a plasma jet. The influence of using mixing rules on the accuracy of the simulation results has not yet been the subject of a quantitative study. To that purpose, three plasma jet simulations were performed, which differ in the extent to which mixing rules are used for the calculation of the thermophysical properties of a gas mixture. The first model approach (model 1) uses mixing rules among all individual gases. The second model approach (model 2) uses mixing rules among a collection of gases (for which the properties are calculated rigorously) and the remaining individual gases. In the third model approach, without mixing rules, the thermodynamic and transport properties of the gas mixture are calculated rigorously.
The influence of the mixing rules in the
calculation of the thermophysical properties is evaluated via comparison of the resulting flow field between the three different simulations. These three mixing 80
Model Set-Up model approaches or ‘mixing models’ are not to be confused with the previously discussed ‘mixing rules’ which they either incorporate or not.
In this chapter, first, the specifics of the plasma jet which serves as the case set-up for the comparative analysis of the different mixing models is presented. The development of this particular case model was performed in the framework of modelling a plasma gasification system. The model geometry, the boundary conditions, model assumptions and model equations are discussed. Secondly, the details of the three different mixing models are explained. Then the results of the simulations are presented and discussed.
4.2
Model Set-Up
The case set-up for the investigation of the effect of mixing laws in the calculation of thermodynamic and transport properties is based on the hybrid water/gas stabilized torch system developed at the IPP (described in detail by Hrabovský et al. [90]). The combined stabilization mechanisms of argon flow and water vortex create a low-density, high-velocity plasma jet. The substantially different characteristics of the resulting plasma flow (as mentioned in Paragraph 1.4.4.3) make it ideally suited for plasma spraying and waste treatment purposes. In these applications, the Ar/H2 O jet exiting the plasma torch mixes with the surrounding atmosphere, e.g. with air in plasma spraying applications. This situation serves as the baseline for the model case set-up, in which nitrogen gas was selected as the model substance for the ambient gas (closely resembling air). Thanks to this simplification, all chemical elements can be attributed to a single gas and an unambiguous comparison can be made between the different mixing models. The selection of nitrogen to resemble a surrounding atmosphere of air is acceptable since it makes up 79 % of the composition of air and since the collision integrals for oxygen and nitrogen species are similar, leading to similar diffusion rates for nitrogen and air. The interaction of the H2 O/Ar plasma jet with surrounding nitrogen gas at atmospheric pressure was simulated with three different models. In the following sections, the details of the case set-up are explained, i.e. the computational domain and boundary conditions, the different mixing models, boundary conditions and model assumptions and model equations.
81
4. Numerical Modelling of Ar/H2 O Plasma Jet with Different Mixing Models
4.2.1
Computational Domain
The domain considered in the calculations represents the plasma jet region outside the plasma torch. The 3D geometry linked to the actual plasma torch structure is shown in Figure 4.1. The computational domain is cylindrical with a diameter of 10 cm and a length of 20 cm. These dimensions correspond well with the area of interest for plasma spraying and for interaction of plasma with biomass and/or waste in plasma gasification. The exit nozzle of the plasma torch is located at the top of the domain with a radius of 3 mm (marked in red in Figure 4.2(a)). Around the plasma exit, a ring of 2 mm width marks the edge of the copper torch nozzle (marked in light blue in Figure 4.2(a)). The grid consists of 453 375 hexahedral cells and is more refined near the central axis and closer to the torch nozzle, especially at the interface between the plasma column and the surrounding environment (i.e. at the edge of the nozzle exit). The more refined mesh at the edge of the plasma outlet is put in evidence in Figure 4.2(b), which shows a zoom of the nozzle surface and the surrounding mesh. This grid size was proven to be sufficiently fine using a grid independence study
Figure 4.1: Geometry of the case set-up with outlining of the computational domain between 135 000 (coarse), 453 375 (fine) and 1 881 000 (finest) cells. An extract of this study is shown in Figure 4.3, in which the time-averaged temperature profiles (over 7.5×10⁻⁴ s) at the position 5 mm downstream of the nozzle exit for the three different grid sizes were compared. The time step size was adapted so the Courant-Friedrichs-Lewy (CFL) number remained the same for the three grid sizes. Although there is still a small difference between the fine grid and the finest grid, the fine grid with 453 375 cells was selected because of computational time 82
Model Set-Up
(a) Structured hexahedral mesh of the computational do- (b) Mesh on nozzle exit surface (yelmain low) and surrounding copper ring (light blue)
Figure 4.2: Mesh considerations.
4
x 10 2
finest fine coarse
1.8 1.6 1.4
T (K)
1.2 1 0.8 0.6 0.4 0.2 0.04 0
0.2
0.4
0.6
r (m)
0.8
1 x 10⁻²
Figure 4.3: Extract of LES grid independence study of time-averaged radial temperature profiles at 5 mm downstream of the torch exit
4.2.2
Boundary Conditions
On the top surface, the copper back wall of the torch chamber is replaced by a pressure boundary with nitrogen gas at Pstatic = 1 atm and T = 400 K. The reason for this is the objective of the simulations, which is to identify the differences in mixing of the plasma with surrounding gas brought about by the 83
4. Numerical Modelling of Ar/H2 O Plasma Jet with Different Mixing Models use of mixing rules in the calculation of the thermophysical properties of the gas mixture. It was believed that including the solid boundary condition for the back wall would limit the entrainment of the atmospheric gas. The solid structure of the torch wall was therefore reduced to the ring with an inner diameter of 3 mm and outer diameter of 5 mm, which has a wall boundary condition at a fixed temperature of 1300 K, which is close to the melting point of copper. This area is marked by the small blue line in Figure 4.4. Also the part of the anode copper disk (visible in Figure 4.1) is omitted. Except for the torch nozzle surface, all the other borders of the computational domain were defined as pressure boundaries with nitrogen at Pstatic = 1 atm and T = 400 K, drawn by a black line in Figure 4.4. The flow of plasma from the nozzle exit was defined by means of temperature,
Figure 4.4: Cross section of the cylindrical domain in-plane through the central axis velocity and concentration profiles (red line in Figure 4.4). These profiles were derived from previous measurements on the torch, which were published by Hrabovský et al. [90]. The selected results were those from torch operation at arc current (I) of 400 A and with an argon flow rate of 22 slm (i.e. 3.67×10⁻⁴ Nm3 /s). The plasma temperature and composition profile were determined by emission spectroscopy at position 2 mm downstream of the nozzle exit. The specifics of the diagnostic method and the procedure to derive the profiles from the emission spectra are explained in detail in the publication [90]. The species molar distribution over the nozzle radius was converted to a mass fraction profile of argon in the argon/steam mixture with the molecular weight of the gas mixture (Mmix ) at each radial position as YAr = xAr MAr /Mmix . This profile was approximated by a fourth order polynomial function (Figure 4.5(b)). 84
Model Set-Up The temperature (Figure 4.5(a)) was expressed with the frequently used function [19, 28, 116, 209]: 4
2
x 10
0.7
1.8 0.65
1.6
mass fraction
1.4
T (K)
1.2 1 0.8 0.6 0.4
0.55 0.5 0.45
0.2 0
0.6
0
0.5
1
1.5
r (m)
2
2.5
3
x 10−3
0.4
0
(a) Temperature
0.5
1
1.5
r (m)
2
2.5
3
x 10−3
(b) Argon mass fraction
Figure 4.5: Plasma inlet profiles
Temperature:
h
Tin = (T0 − Tw ) 1 −
�
r Rin
� nT i
+ Tw
(4.1) (4.2)
In this equation, the torch radius Rin is 0.003 m and Tw , the torch wall temperature, is set at 1300 K (i.e. the melting temperature of copper). The centreline temperature T0 was 19 140 K and the parameter nT = 2.737 to achieve the best fit with the experimental profile [90].
A remark about using these profiles is that they were measured at 0.002 m downstream of the exit nozzle (since it is not possible to perform these measurements closer to the exit nozzle), therefore, some assumptions need to be made in order to use these profiles at the nozzle surface: • The temperature profile at 0.002 m downstream of the exit nozzle corresponds to the temperature profile at the nozzle surface. To argument this assumption it is important to know that the energy balance equation at the arc centre is dominated by a balance between radiation losses and ohmic heating [112]. The magnitude of both energy terms was evaluated:
85
4. Numerical Modelling of Ar/H2 O Plasma Jet with Different Mixing Models – Radiation losses were calculated using the Net Emission Coefficient (NEC) approach, initially proposed by Lowke [117]. In this method, the net emission means the emission minus absorption, which is mathematically represented by the divergence of the radiative flux. The integration of this net emission over the whole spectrum (VUV, UV, visible and IR parts) is previously calculated for an isothermal spherical plasma with Rp is taken as the radius of the sphere. In practical applications, a cylindrical plasma is often assumed and the conducting radius Rp as the distance from the axis where the temperature is 7080 % of the axis temperature [156]. For the fitted temperature profile, the estimated Rp was 0.0018 m. For this value of Rp , the net emission coefficients (with unit W m−3 sr−1 ) as a function of temperature for an Ar/H2 O gas mixture with 30 % argon molar content at 1 atm were calculated by Vladimir Aubrecht [8]. A surface-weighted average of the net emission coefficient over the cross section of the torch nozzle was calculated: �¯N =
1 πR2
Z
R
2πr�N (T (r)) dr
(4.3)
0
The total energy loss by radiation over the length l of 0.002 m from the exit nozzle was calculated as: PR = 4π �¯N Al
(4.4)
with A the surface of the plasma column cross section. The calculated value for this energy term was 4.334 kW. – The Joule heating (PJH ) between the exit of the nozzle and the position 0.002 m downstream can be calculated as: U2 U 2 σA PJH = IU = = U 2G = (4.5) R l with I the arc current, U the potential difference over the length l, R the resistance, G the conductance and σ the electric conductivity. For the selected operating conditions of the torch, the voltage between the nozzle and the arc attachment point at the anode (which is on average 0.0132 m downstream from the nozzle [31]) is 75 V [90]. About 20 V is produced in the region from the anode surface to the centre of the arc, so the voltage over the length l of 0.002 m from the torch exit is estimated to be: U =
0.002 0.0132
(75 − 20).
For each radial position r along the radius of the plasma column cross section, the electrical conductivity was interpolated from pre-calculated tables as a function of temperature T and argon mass fraction YAr . 86
Model Set-Up The surface-weighted average of the electrical conductivity over the cross section is then determined as: 1 σ ¯= πR2
Z
R
2πrσ (T (r) , YAr (r)) dr
(4.6)
0
Finally, the calculated value for the Joule heating (Equation 4.5) was 4.349 kW. The radiation loss of 4.334 kW is almost exactly compensated by the Joule heating of 4.349 kW in the plasma volume till 0.002 m, which justifies the assumption that the temperature profile measured at 0.002 m can be imposed as the boundary condition at the torch exit. • The mass fraction profile of argon at the nozzle surface is the same as the profile at 0.002 m downstream of the torch exit. It is assumed that in this high-temperature, high-velocity region, the de-mixing of argon and water species by diffusion in the radial direction is negligible. The velocity profile at the plasma inlet is assumed to follow a similar expression as the temperature profile: Velocity:
h
vin = v0 1 −
�
r Rin
� nv i
(4.7)
The centreline velocity v0 in this equation was chosen as 4300 m s−1 from measurements of speed of propagation of disturbances in the plasma jet [89]. The parameter nv can be determined from the energy balance over the torch nozzle. The potentials of the cathode nozzle and the exit nozzle were measured by highresistance voltage dividers and the energy losses were determined from calorimetric measurements on cooling loops of the cathode and of the water stabilizing system. The total energy exiting the torch can then be calculated from volt-ampere characteristics and power losses in the torch chamber. The energy loss to the cooling water is taken into account by an efficiency factor η (61 %). This net energy should correspond to the enthalpy flux of the plasma at the exit nozzle: ηIU =
R
Z
2πρ (YAr (r) , T (r)) H (YAr (r) , T (r)) v (r) dr
(4.8)
0
− H°Ar (T0 )
Z
R
2πYAr (r) ρ (YAr (r) , T (r)) v (r) dr
0
Z − 0
R
2π (1 − YAr (r)) ρ (YAr (r) , T (r)) v (r) dr[H°H2 O( g) (Tb )
− Cp,H2 O(l) (Tb − T0 ) − λw ] ρ(YAr , T ) and H(YAr , T ) are respectively the density and enthalpy for the plasma mixture (Ar/H2 O) as a function of mass fraction of argon and temperature. 87
4. Numerical Modelling of Ar/H2 O Plasma Jet with Different Mixing Models The latter two variables are function of radial position (r) (see Figures 4.5(a) and 4.5(b)). The enthalpy values of the plasma mixture were calculated as: H (T ) =
1 Mmix
n X
xi (H°i (T ) − H°i (0))
(4.9)
i
with i one of the n species in the gas composition from water vapour and argon at temperature T. xi is the molar fraction of species i, Hi° the standard enthalpy in kJ/mol and Mmix is the molecular weight of the gas mixture in kg/mol. Because only the sensible heat supplied to the carrier gas should be used in this equation, the following energy terms should be taken into account: • Since argon and water vapour, which make up the plasma gas were fed to the torch at temperature T0 (300 K), their enthalpies should be subtracted from the energy balance. The second term on the right-hand side of the balance (Equation 4.8) is this energy term from argon. • Water vapour is originally supplied as liquid water, therefore the enthalpy of water vapour at boiling temperature Tb (373.15 K) should be subtracted from the balance (first term in square brackets). • The second and third term in the square brackets in Equation 4.8 are the sensible heat of the liquid water from inlet temperature till boiling temperature and the latent heat of evaporation respectively to correct for the excess energy subtracted by the first in brackets. After taking all these elements into consideration, the energy balance equation 4.8 can be solved for v(r), which gives a value of 1.688 for the parameter nv . The resulting velocity profile is shown in Figure 4.6.
88
4500 4000 3500
v (m/s)
3000 2500 2000 1500 1000 500 0
0
0.5
1
1.5
r (m)
2
2.5
3
x 10−3
Figure 4.6: Velocity profile
4.3
Description of the Mixing Models
Three different methods for calculating thermodynamic and transport properties of the gas mixture were compared to investigate the influence on the flow field of using mixing rules. The formulas for the mixture density (in kg m−3 ) and speed of sound (in m s−1 ) were expressed in terms of molar fraction, for enthalpy (in kJ kg−1 ) in terms of mass fraction and for dynamic viscosity (in kg m−1 s−1 ) and thermal conductivity (in W m−1 K−1 ) the respective mixing rules of Wilke [207] and of Mason and Saxena [120] were used. As mentioned previously, these mixing rules are often selected by researchers/authors because of their simplicity. The fact that these mixing rules are the least accurate ones, is advantageous to the study, since their effects on the flow field (if any) will be more pronounced. The specific heat (in J kg−1 K−1 ) was calculated as the numerical derivative of enthalpy over an interval of 0.2 K. The thermodynamic properties and transport coefficients of the different gases and gas mixtures were calculated using the methods presented by Murphy in previous publications [134, 137–139].
Pure gas data were tabulated as a function of temperature from 400 K to 20 000 K with intervals of 100 K. Properties of the plasma gas (Ar/H2 O) and the complete gas mixture (Ar/H2 O/N2 ) are also function of species mass fraction(s) and were stored in a multidimensional matrix with mass fraction step size(s) of 0.02. Except for enthalpy, for which 0.01 was used as the mass fraction step size. All properties were calculated at a pressure of 1 atm. The details of the three different models are now explained and are summarized in Table 4.1 (where x and y denote respectively mole fraction and mass fraction). 89
Table 4.1: Details of the three mixing models
Property
MODEL 1
n=3;
i=1: Ar, i=2: H2O, i=3: N2
MODEL 2
n
Density (ρ)
mix xi i
Enthalpy (H)
H mix yi H i
mix xi i
with ρi = f(T)
n
xC i
90
x M x C
n
mix i 1
Viscosity (μ)
i
p ,i
R
with Cp,i , Mi = f(T)
cmix RT
Cp
dH dT
n
1 M i i 1 1 with ij 8 M j j
1 2
Mj Mi 1 4
i 1
2
1.065 M i 1 2 2 M k
1 2 1 i M k M i k M i M k
i
p ,i
with Mpla , Cp,pla = f(yAr ,T)
1 4
c = f(yAr , yN2 , T)
MN2 , Cp,N2 = f(T)
xi i with μ , M = f(y ,T) pla pla Ar j x jij μN2 , MN2 = f(T)
1 1 1 1 M i 2 i 2 M j 4 1 1 with ij 8 M j j M i
1
1 2
i
R
i
mix
μ = f(yAr, yN2, T)
2
1
n x ki 1 Gik k with ki, μi , Mi = f(T) k 1 xi i 1 k i
n
i
with μi , Mi = f(T)
p ,i
x M x C i
xi i j x jij
with Gik
i
i n
i
1 2
k mix
xC
2
n
Thermal conductivity (k)
dH i dT
n
n
i
with C p ,i
i
p ,i
i n i
H = f(yAr , yN2 , T)
n
n
i
Hpla = f(yAr ,T) and HN2 = f(T)
C p ,mix yi C p ,i
dT
i
2
ρ = f(yAr , yN2 , T)
i
C p ,mix yi C p ,i with C p ,i dH i
cmix RT
ρpla = f(yAr ,T) and ρN2 = f(T)
n
H mix yi H i
with Hi = f(T)
i
Speed of sound (c)
MODEL 3
i
i
n
Heat capacity (cp)
n=2; i=1: plasma (Ar/H2O), i=2: N2
n
n x ki 1 Gik k with kpla, μpla , Mpla = f(yAr ,T) k 1 xi i 1 kN2, μN2 , MN2 = f(T) k i n
k mix 2
with Gik
1.065 M i 1 2 2 M k
1 2
1 1 2 4 1 i M k M i k M i M k
2
k = f(yAr, yN2, T)
Description of the Mixing Models
4.3.1
Model 1
The thermophysical properties of respectively Ar, H2 O and N2 were calculated by considering only the interactions of species within each individual gas (which includes hydrogen-oxygen interactions for water vapour) [134, 137–139]. At every iteration of the model, the properties in each point were approximated as a function of temperature by linear interpolation. The mixture properties were then calculated by using mixing rules. Consequently, only the dissociation and ionization products (ions, atoms and molecules) of each individual gas are considered: e− , Ar, Ar+ , Ar++ , Ar+++ , Ar++++ , H2 O(g) , H2 , O2 , O, O+ , O++ , O+++ , O− , + + + + − − − + − + − O+ 2 , O2 , O3 , O3 , O3 , H, H , H , H2 , H2 , H3 , OH, OH , OH , HO2 , HO2 , + + − − + + + ++ HO− , N+++ , N+ 2 , H2 O , H2 O2 , H2 O2 , H3 O , N2 , N , N 2 , N2 , N3 , N3 , N3 .
4.3.2
Model 2
The mixing rules were only applied between two gases, nitrogen and ‘plasma gas’. The properties of the plasma gas mixture of argon and steam were calculated rigorously (considering the argon-water vapour, argon-hydrogen, argon-oxygen and hydrogen-oxygen interactions) [134, 139]. At every iteration of the model, bilinear interpolation as a function of argon mass fraction and temperature from this pre-calculated table was performed. The same species as in model 1 were included in the property calculation, but the resulting properties of the Ar/H2 O mixture differ from the properties calculated using mixing rules because of additional interactions and consequently a change in Gibbs free energy of this binary system.
4.3.3
Model 3
In this full multicomponent model, no mixing rules were used to calculate the thermodynamic and transport properties of the ternary mixture of argon, steam and nitrogen. Thermodynamic and transport properties were interpolated from a pre-calculated matrix as a function of argon mass fraction, nitrogen mass fraction and temperature. In the calculation of these properties all possible interactions (i.e. argon-water vapour, argon-hydrogen, argon-oxygen and hydrogen-oxygen, nitrogen-water vapour, nitrogen-oxygen and nitrogen-hydrogen) were taken into account [132, 134, 137]. This means that the combined products of H2 O and N2 − + − (NO, NO+ , NO− , NO2 , NO+ 2 , NO2 , N2 O, N2 O , N2 O , N2 O3 , N2 O4 , NO3 ,
+ + − NO− 3 , NH , NH, NH , NH2 , NH3 , NH4 , N2 H2 , N2 H4 , HN3 , HNO, HNO2 ,
HNO3 , NH2 OH, NH2 NO2 ) were also included in the properties calculation together with the list of species listed for model 1. Although the concentration of these additional components is low, it can change the resulting thermophysical 91
4. Numerical Modelling of Ar/H2 O Plasma Jet with Different Mixing Models properties of the gas mixture.
The definitions of the different gas mixtures in all three models are illustrated in Figure 4.7. The blue sets of species correspond to the three gases in model 1, which properties were individually calculated and among which mixing rules were applied. The red circles show the approach for model 2 where the properties of the gas mixture Ar-H2 O were rigorously calculated and then combined with the properties of nitrogen through mixing rules to estimate the ternary gas mixture properties. For model 3 (the green circle), no subdivision was made and the properties of the gas mixture comprised of all species from the three gases was rigorously calculated in the full multicomponent approach. In model 2, the combination of two non-reacting gases (argon and water vapour)
Ar+ eAr Ar4+
Ar
Ar2+ Ar3+
NH2NO2 NH2OH e-H2O HNO3 H3O+ H - O - O3+ NH+ NH- NH 2 3 2 NH + N O N O e-N2 + + 2 2 H3 O O H2 NH3 O3 N2- N3 NO2- NO3 H2O+ O3+ NO + HO2 + HO + + N+ + N2 N2 O2+ + 2 O2 HNO+ NO2 NH4 N3 H2O2 O H NO N 3 2 H OH 3+ 3 NO- NO2 H+ HNO N2+ N + - N O O O N O + 2 3 HN 2 2 H2O2 N2O4 2 3 HO2N2H2 N2H4 OH OH+ HNO2
Figure 4.7: Illustration of the different mixing model approaches. blue for Model 1, red for Model 2 and green for Model 3 does not lead to additional combined species from the constituent elements of the two gases. Nevertheless the presence of the chemical species from both gases alters the outcome of the minimization of the Gibbs free energy of the system and leads to a different equilibrium conditions than when the equilibrium compositions of the individual gases are combined. This change in equilibrium composition can be seen in Figure 4.8(a), which shows the difference between the molar fractions of each species considering the complete system of a 50 wt% Ar-50 wt% H2 O gas mixture, and the molar fractions of each species when combining the separately determined equilibrium compositions of the individual gases as a function
92
Description of the Mixing Models of temperature:
xi xi +H O Ar 2 X X Ar H2 O xj Mj xj Mj (2)
∆xi = xi
j
−
j
1 Ar X
+
H2 O
X
xj M j
j
(4.10)
1 xj Mj
j
with i representing a species in the binary gas mixture of Ar and H2 O and j a species in the equilibrium composition of the individual gas (either argon or water vapour). The molar fraction of species i from the equilibrium composition (2)
calculation of the system comprising both gases is denoted by xi . 0.08
0.03
O
∆ molar fraction
0.01
O2
O
H2
O
H2O
Ar
H
Ar+
e−
H+
Ar2+
OH
+
0.06
+
2
O
N
H2
H
N+
N
+
0.04
0
2+
H
N
e−
OH
NO
O
H2O
2
∆ molar fraction
0.02
0.02
0
−0.01
−0.02
−0.02
−0.04
−0.06
−0.03 0
0.5
1
1.5
2
T (K)
(a) 50 wt% Ar–50 wt% H2 O
2.5 4
x 10
0
0.5
1
1.5
2
T (K)
2.5 4
x 10
(b) 50 wt% H2 O–50 wt% N2
Figure 4.8: The difference in molar composition as a function of temperature for a certain gas mixture The difference in composition is limited to 0.03 in terms of molar fraction of a certain gas species. The differences in molar fractions are distinctively noticeable in the dissociation region of H2 O and to a lesser extent in the ionization region (around 15 000 K).
In model 3, by definition, the full multicomponent approach takes into account all product species from the three gases. This includes the combination species between nitrogen and water vapour (i.e. the species outside of the red circles in 93
4. Numerical Modelling of Ar/H2 O Plasma Jet with Different Mixing Models Figure 4.7). It is obvious that the equilibrium composition which includes chemical reactions between the gases differs from the one combined from the separate equilibrium compositions of the individual gases. In Figure 4.8(b), the difference between the molar fractions of each species considering the complete system of a 50 wt% H2 O-50 wt% N2 gas mixture, and the molar fractions of each species by combining the separately calculated equilibrium compositions of the individual gases as a function of temperature. The formula for this expression is similar to Equation 4.10, but argon is interchanged by nitrogen gas. To avoid Figures 4.8(a) and 4.8(b) from becoming too cluttered, only the species at molar fractions higher than 0.01 were considered. The only significant product species from combination of elements from N2 and H2 O is nitrogen monoxide (NO). The biggest differences (up to almost 0.08) in terms of molar fraction were found in the temperature range of nitrogen dissociation.
4.4
Model Assumptions and Equations
Ansys FLUENT 14.0 was used as the CFD software, complemented with userdefined functions (UDF) for plasma inlet boundary conditions, thermodynamic and transport properties (including diffusion) and for post-processing purposes. Large Eddy Simulation (LES) was chosen as the turbulence model with Dynamic Smagorinsky-Lilly for the subgrid-scale model in combination with the pressurebased solver. The time-step size was 1.5×10⁻⁷ s, bounded central differencing was selected as the spatial discretization scheme and second order implicit scheme was selected for temporal discretization. The simulations presented in this study were based on the following main assumptions: • Effects of gravity and the effect of viscous dissipation on the temperature were neglected. • The system is assumed to be in LTE [18]. This assumption is generally accepted in the modelling of atmospheric plasma jets [118]. Effects from ionization, dissociation and chemical reactions of gas species are included in the calculation of the gas properties (see Paragraph 4.3). • No electromagnetic effects were taken into account. • Compressibility effects were neglected. This means the density did not change with pressure, but was only a function of gas composition and temperature. 94
Model Assumptions and Equations For this 3D time-dependent flow, the governing equations can be represented by mass continuity equation, the conservation equation of momentum, species conservation equation and energy conservation equation:
Mass continuity equation: ∂ρ + 5 · (ρv) = 0 (4.11) ∂t where ρ is the local density of the gas mixture and v the gas velocity vector.
Momentum conservation equation: ∂ (ρv) + ∇ · (ρvv) = −∇p + ∇ · τ (4.12) ∂t where p is the pressure and τ is the stress tensor, calculated from components with respectively molecular and turbulent viscosity.
Species:
∂ (ρYi ) + ∇ · (ρvYi ) = −∇ · Ji (4.13) ∂t The diffusion flux of species i, Ji , includes a laminar and a turbulent contribution
to diffusion. The laminar diffusion was described by the combined diffusion approach of Murphy [131]. This method describes the diffusion of high-temperature gases relative to one another. Combined diffusion coefficients allow the diffusion of one gas (e.g., argon) with respect to another (e.g., nitrogen) to be defined. A gas is defined as comprising all species derived from that gas; e.g. nitrogen gas comprises N2 , N, N+ , N+ 2 , etc., and electrons derived from the nitrogen species. The use of combined diffusion coefficients has the advantage that only one ‘gas’ conservation equation needs be solved, rather than N - 1 species conservation equations for a plasma containing N species [137]. They are linear combinations of the multicomponent diffusion coefficients. More details on the theory of the combined diffusion coefficient method can be found in publications by Murphy [131].
With some additional assumptions on this approach, the
expression for the diffusion flux in a three-component mixture could be written in terms of binary combined diffusion coefficients (see Appendix A).
The diffusion flux of species i could then be defined as: Ji =
n−1 � X ρ j
M
x mi mj Dij (xj , T )∇xj 2
−
T Dij (xj , T )∇ ln T
�
+
µt ∇Yi Sct
(4.14) 95
4. Numerical Modelling of Ar/H2 O Plasma Jet with Different Mixing Models The first term on the right-hand side describes the laminar diffusion by using the combined diffusion approach and was calculated with a user-defined function in FLUENT as a source term in the species conservation equation. M is the average mass of all species in the gas mixture, mi and mj are respectively the average masses of the heavy species of the gas i and j, xj is the sum of the mole fractions of the species of gas j and n = 3 is the number of gases in the mixture. The x combined ordinary diffusion coefficient Dij and combined temperature diffusion T coefficient Dij (as functions of the mole fraction of gas j and temperature)
describe, respectively, diffusion due to mole fraction gradients and temperature gradients. The second term on the right-hand side was calculated by the standard FLUENT code and describes turbulent diffusion with Sct the turbulent Schmidt number and µt the turbulent viscosity. The original expression for the diffusion flux (Equation 4.14) with combined diffusion coefficients introduced by Murphy also contains two additional terms. One term describing the diffusion due to pressure gradients (∇p) and a second term describing ambipolar diffusion due to an electric field (∇e). Both terms were neglected in the calculation because of the negligible pressure differences and because the electromagnetic effects were omitted.
Energy conservation equation: ∂ (ρE) + ∇ · (v (ρE + p)) = ∇ · ∂t
! kef f ∇T −
X
hi J i
−R
(4.15)
j
where kef f is the effective conductivity (k + kt , with k and kt the laminar and turbulent thermal conductivity respectively) and E the specific total energy (J kg−1 ) as E = h -
p ρ
+
v2 2
in which h is the enthalpy. The turbulent thermal conduct-
ivity is obtained with the constant turbulent Prandtl number hypothesis. The energy term for species diffusion was calculated through a user-defined function and added to the energy equation as a source term. The expression for the diffusion flux of species i, Ji is the same as for the species conservation equation (Equation 4.13). hi is the enthalpy of gas i, defined as the sum of the enthalpies of the species making up the respective gas. For model 2 and 3, hi was defined from the directly calculated enthalpy h of the binary and ternary mixture, respectively, so that: h(Yi , ..., Yn−1 , T ) =
Pn i
hi (Yi , ..., Yn−1 , T )Yi with
Pn i
Yi =1 and with n = 2 (Ar
and H2 O) for model 2 and n = 3 (Ar, H2 O and N2 ) for model 3. The contribution of the enthalpies of the combined ions and molecules from the interactions between 96
Results H2 O and N2 in model 3 were included in the enthalpy of N2 . Their contribution to the enthalpy value, however, is very small because of the low concentration of these species. The last term on the right-hand side of Equation 4.15 is the net radiation power R and represents the energy loss from the hot arc core by radiation. R was modelled with the net emission coefficient (NEC) approach by R = 4π�N where �N is the net emission coefficient (W m−3 sr−1 ). Approximate values for the net emission coefficients for an argon/water plasma mixture with 30 % argon molar content at a pressure of 1 atm and for a plasma radius of 0.0018 m were used, taken from Aubrecht et al. [8].
4.5
Results
The flow variables selected for comparing the three mixing models are temperature, velocity and nitrogen mole fraction. These variables were statistically averaged in time by taking the arithmetic mean over 130 000 time steps or 19.5 ms. Figure 4.9 shows the comparison between an instantaneous temperature profile and the time-averaged temperature profile along a cross section in the x-direction for Model 1. The unstable flow of the plasma jet illustrates the need for a sufficiently long period of averaging in order to obtain a reliable statistical average.
Figure 4.9: Temperature contours on a cross section at x=0 mm for Model 1 of a) the instantaneous flow field and b) the averaged flow field
97
4. Numerical Modelling of Ar/H2 O Plasma Jet with Different Mixing Models
Figure 4.10: Averaged temperature contour profiles of model 2 versus model 3 with mark-ups of the different downstream positions of sampling for the radial profiles
98
Results For comparison of the three mixing models, instead of comparing full contours along x- or z-direction cross sections, the data is sampled at particular cross sections in the y-directions downstream of the torch exit nozzle (5, 20, 40, 50, 60, 90 and 150 mm). This is well illustrated by Figure 4.10. In the plane at the marked positions, the variables are averaged in space along circles. The obtained average radial profiles for the different simulations were compared over a length of 1 cm radial from the jet centreline. The negative radius values were used to plot results of a chosen model against the output of a second model, plotted on the positive radius values. 20
M1
18
M2
5mm 20mm
16
40mm
14 50mm
T (kK)
12 10 8
60mm
6
90mm
4
150mm
2 0.4 −10
−8
−6
−4
−2
0
2
4
6
8
10
r (mm)
Figure 4.11: Temperature profiles of model 1 (black) versus model 2 (grey)
In Figure 4.11, the radial temperature profiles of model 1 versus model 2 are plotted.
The temperature values at every position are almost identical with
only small differences at the positions 40 mm, 50 mm and 60 mm where the temperatures from model 2 are smaller than those from model 1. Overall, there are no big differences in the temperature field between model 1 and model 2. A different trend can be seen in Figure 4.12, where for model 2 and model 3 only the temperatures in the high-temperature region of the plasma jet (dotted lines for 5 mm and 20 mm) are in good agreement. From 40 mm downwards, the radial temperature profiles of model 3 clearly show much higher temperatures than the profiles from model 2. The differences in centreline temperatures between model 2 and model 3 can be up to 55 % of the values calculated in model 2.
99
4. Numerical Modelling of Ar/H2 O Plasma Jet with Different Mixing Models
20
M2
M3
5mm
18
20mm
16
40mm
14
T (kK)
12
50mm
10 8
60mm
6
90mm
4
150mm
2 0.4 −10
−8
−6
−4
−2
0
2
4
6
8
10
r (mm)
Figure 4.12: Temperature profiles of model 2 (black) versus model 3 (grey) The comparison of axial velocity profiles from simulations with model 1 and model 2 is plotted in Figure 4.13. Similar to the comparison of the temperature field of 4.5 M2
M1
4 5mm
3.5
v (km/s)
3
20mm 40mm
2.5 2
50mm
1.5
60mm 90mm
1
150mm
0.5 0 −10
−8
−6
−4
−2
0
2
4
6
8
10
r (mm)
Figure 4.13: Velocity profiles of model 1 (black) versus model 2 (grey) these two models (Figure 4.11), there are some small differences in the velocity fields noticeable between 40 mm and 60 mm downstream of the torch exit. The velocities at these positions are slightly lower for model 2 compared to model 1. In Figure 4.14, it can be seen that the velocity profiles from the simulation with model 3 show significantly higher values than the velocity profiles from the simulation with model 2 starting at 40 mm downstream of the exit nozzle. These 100
Results differences increase further downstream and calculated velocities of the jet with model 3 can become more than twice as high as the ones with model 2 at the same positions (50, 60 and 90 mm). Finally, nitrogen mole fraction is the last variable evaluated to make the compar4.5 M2
M3
4 5mm
3.5 20mm
v (km/s)
3
40mm
2.5 2
50mm 60mm
1.5
90mm
1
150mm
0.5 0 −10
−8
−6
−4
−2
0
2
4
6
8
10
r (mm)
Figure 4.14: Velocity profiles of model 2 (black) versus model 3 (grey) ison between the three mixing models. This parameter characterizes the level of entrainment of surrounding gas into the plasma jet. The profiles of nitrogen mole fraction of model 1 and model 2 are plotted in Figure 4.15. The concentration profiles of nitrogen gas in the gas mixture are almost identical for both models. The comparison between model 2 and model 3 on the basis of nitrogen mole fraction in Figure 4.16 shows different results than those in Figure 4.15. In the high-temperature region (5 mm and 20 mm), the concentrations of nitrogen gas in the gas mixture are nearly identical for the two models, but at 40 mm and further downstream of the torch exit the profiles of nitrogen mole fraction from the simulation with model 2 are much higher than those from the simulation with model 3. As shown by the rapid increase in nitrogen concentration in the downstream direction in model 2, it is clear that the entrainment of the surrounding atmosphere occurred much faster (i.e. closer to the torch exit) with model 2 than with model 3.
101
4. Numerical Modelling of Ar/H2 O Plasma Jet with Different Mixing Models
1
150mm
0.9 90mm
0.8 60mm
0.7 50mm
0.6
xN
2
40mm
0.5
20mm
0.4 0.3 0.2
5mm
0.1 0 −10
M1
−8
−6
−4
M2
−2
0
2
4
6
8
10
r (mm)
Figure 4.15: Nitrogen mole fraction profiles of model 1 (black) versus model 2 (grey)
1
150mm
0.9 90mm
0.8 60mm
0.7 50mm
xN
2
0.6
40mm
0.5 0.4
20mm
0.3 0.2
5mm
0.1 0 −10
M3
M2
−8
−6
−4
−2
0
2
4
6
8
10
r (mm)
Figure 4.16: Nitrogen mole fraction profiles of model 2 (black) versus model 3 (grey)
4.6
Discussion
The comparison of model 1 with model 2 in Figures 4.11, 4.13 and 4.15 showed little difference in the temperature, velocity and nitrogen mole fraction profiles. This means that the correct calculation of the thermodynamic and transport properties of the plasma gas (Ar/H2 O) has only a limited influence on the flow characteristics. The full multicomponent approach (model 3), on the other hand, gave a significantly different flow field than model 2 (see Figures 4.12, 4.14 102
Discussion and 4.16). Up to 20 mm from the torch exit, the profiles of temperature, velocity and nitrogen concentration are quasi-identical with model 2 and model 3. The big differences start from 20 mm downwards, where a steep increase of nitrogen mole fraction at 40 mm for model 2 can be seen. This is caused by an intense entrainment of nitrogen into the jet, which indicates turbulent mixing of the jet with the surrounding atmosphere. This is accompanied by the sharp decrease of velocity and temperature (i.e. cooling with cold nitrogen) in the simulation with model 2 from 20 mm downwards. For model 3, the increase in nitrogen mole fraction in the jet occurs more gradually, suggesting a longer, more stable jet with a delayed onset of turbulence. The observation that the jet calculated with model 3 remains quasi-laminar for a longer time than the jet calculated with model 2 is confirmed by looking at the evolution of the root-mean-square (RMS) of the velocity fluctuations at different axial positions (Figure 4.17). This parameter is an indicator of the velocity fluctuations and stability of 1 M2
0.8
50mm
50mm
0.7
RMS v (km/s)
M3
40mm
0.9
0.6
60mm
60mm
0.5
90mm
0.4
90mm
0.3
20mm
0.2
5mm
40mm 20mm
5mm
0.1 0 −10
150mm
150mm
−8
−6
−4
−2
0
2
4
6
8
10
r (mm)
Figure 4.17: Root-mean-square velocity profiles of model 2 (black) versus model 3 (grey) the jet, or level of turbulence. The values of this variable are much higher at positions closer to the torch exit for model 2 than for model 3. The difference is especially large at 40 mm downstream of the torch exit, which corresponds to the region where the sharp increase in nitrogen mole fraction in the jet and the decrease in velocity and temperature with model 2 can be observed. Including all interactions of the ternary gas mixture in the calculation of thermodynamic and transport properties clearly has a large impact on the flow variables. In the following section, the significant differences in results and the difference in 103
4. Numerical Modelling of Ar/H2 O Plasma Jet with Different Mixing Models transition from laminar to turbulent flow between the different simulations will be explained by the differences in thermodynamic and/or transport properties of the mixing models .
The thermodynamic and transport properties of the gas mixture with composition 25 wt% argon, 25 wt% steam and 50 wt% nitrogen are plotted to examine which differences between the calculated values by the three models cause the differences in the resulting flow fields. Values of molecular weight and enthalpy of the selected mixture composition are displayed as a function of temperature in Figures 4.18 and 4.19 respectively. Density values are not reported because no significant differences were identified between the models. In these figures, the lines for model 1 and model 2 overlap (full lines), because no errors were introduced by using mixing rules for the calculation of thermodynamic properties of the plasma gas mixture. The properties calculated by model 3 are represented by the dotted lines. The molecular weights and enthalpies calculated with model 3 are respectively 27.5 16
Molecular Weight [g/mol]
25
15
22.5
14
20
13
17.5
12 11
15
5
6
7
8
9
12.5 M1 & M2
10
M3
7.5 5
0
2.5
5
7.5
10
T (kK)
12.5
15
17.5
20
Figure 4.18: Difference in molecular weight between model 1 and 2 (solid line) and model 3 (dotted line) for a mixture of 25 wt% Ar, 25 wt% H2 O and 50 wt% N2 lower and higher than the ones from model 1 and 2 between 5000 K and 9000 K. In model 3, the products from combination of elements of water vapour and nitrogen are taken into account in the mixture composition. In this temperature range, nitric oxide (NO) and other combination species in smaller concentrations 104
Discussion
Enthalpy [MJ/kg]
225 200
50
175
40
M1 & M2 M3
30
150
20
125
10
100
0
75
3
4
5
6
7
8
9
50 M1 & M2
25
M3
0 −25
0
2.5
5
7.5
10
T (kK)
12.5
15
17.5
20
Figure 4.19: Difference in enthalpy between model 1 and 2 (solid line) and model 3 (dotted line) for a mixture of 25 wt% Ar, 25 wt% H2 O and 50 wt% N2 are formed and cause the differences in molecular weight and enthalpy values. However, they do not explain the large changes in the flow field calculated with model 3 compared to that calculated with model 2. The reason for this can be found in the differences in transport properties between the three mixing models. The thermal conductivity and viscosity of the three models for the same mixture composition are compared as a function of temperature respectively in Figures 4.20 and 4.21.
The full multicomponent approach for the calculation of the transport properties (model 3) clearly generated different values than the other two models, which used the mixing rules of Wilke [207] and Mason and Saxena [120] for the respective properties. As noted above, these formulas were proposed for mixtures of non-ionized gases, considering only elastic collisions and employing several approximations. This does not give satisfactory results for thermal conductivity where the contribution of the inelastic collisions is important because they are responsible for the dissociation and ionization peaks apparent in Figure 4.20. Consequently, the use of the mixing rule of Mason and Saxena leads to an underestimation of the actual values of thermal conductivity, especially at the ionization temperatures (between 10 000 and 20 000 K).
It is clear that the
differences in thermal conductivities between model 2 and model 3 are much 105
4. Numerical Modelling of Ar/H2 O Plasma Jet with Different Mixing Models
Thermal Conductivity (λ) [W/(m.K)]
7 6 5
4 3 M1
2
M2 M3
1
0 0
2.5
5
7.5
10
12.5
15
17.5
20
T (kK)
Figure 4.20: Difference in thermal conductivity between model 1 (solid line), model 2 (dotted line) and model 3 (dashed line) for a mixture of 25 wt% Ar, 25 wt% H2 O and 50 wt% N2 −4
3
x 10
M1
Viscosity (µ) [kg/(m.s)]
2.5
M2 M3
2 1.5 1 0.5 0
0
2.5
5
7.5
10
T (kK)
12.5
15
17.5
20
Figure 4.21: Difference in dynamic viscosity between model 1 (solid line), model 2 (dotted line) and model 3 (dashed line) for a mixture of 25 wt% Ar, 25 wt% H2 O and 50 wt% N2 higher than those between model 1 and model 2. In the calculation of thermal conductivity in model 2, the only additional interactions taken into account by rigorous calculation, relative to the calculation in model 1, are those between species derived from argon and water vapour. Interactions between all species in the ternary mixture are considered in the full multicomponent approach of model 106
Discussion 3, leading to much larger differences.
In the previous figures, the differences between the different models were plotted for a specific gas mixture as a function of temperature. To get a complete overview of the differences in thermodynamic and transport properties, they can be visualized over the whole range of argon mass fraction, nitrogen mass fraction and temperature. In the following plots (Figure 4.22), the values of the different properties calculated by model 2 are divided by the values of the respective properties calculated by model 3. The data field is displayed by cross sections at different temperatures. The values of the ratio of the properties calculated using model 2 to those calculated using model 3 are coloured according to the corresponding colour map: • Values equal to 1: properties of model 2 equal properties of model 3. • Values 1: properties of model 2 are estimated larger than properties of model 3. In Figures 4.22(a) and
4.22(b), significant differences between model 2 and
model 3 are shown for the transport properties. The large differences in thermal conductivity in the temperature region from 6000 to 8000 K coincide with the shift in dissociation peak for nitrogen gas, visible in Figure 4.20.
This
shift in dissociation peak is also responsible for the large differences in heat capacity between the two models in the same temperature region. To illustrate this, the evolution of heat capacity calculated by the three mixing models is plotted as a function of temperature for 6 different gas compositions in Figure 4.23.
There exists a strong connection between the heat capacity Cp (derivative of the enthalpy) and the reactive thermal conductivity. This is particularly clear at temperatures around the dissociation of molecules (T