Missing:
REVIEW OF SCIENTIFIC INSTRUMENTS 80, 103504 共2009兲
Development and testing of a fast Fourier transform high dynamic-range spectral diagnostics for millimeter wave characterization D. J. Thoen,1 W. A. Bongers,1 E. Westerhof,1 J. W. Oosterbeek,2 M. R. de Baar,1 M. A. van den Berg,1 V. van Beveren,1 A. Bürger,2 A. P. H. Goede,1 M. F. Graswinckel,1 B. A. Hennen,1,3 and F. C. Schüller1 1
Association EURATOM-FOM, Trilateral Euregio Cluster, FOM-Institute for Plasma Physics Rijnhuizen, P.O. Box 1207, 3430 BE Nieuwegein, The Netherlands 2 Association EURATOM-FZJ, Institut für Energieforschung-Plasmaphysik, Forschungszentrum Jülich GMBH, 52425 Jülich, Germany 3 Control Systems Technology Group, Eindhoven University of Technology, P.O. Box 513, NL-5600 MB Eindhoven, The Netherlands
共Received 7 July 2009; accepted 15 September 2009; published online 21 October 2009兲 A fast Fourier transform 共FFT兲 based wide range millimeter wave diagnostics for spectral characterization of scattered millimeter waves in plasmas has been successfully brought into operation. The scattered millimeter waves are heterodyne downconverted and directly digitized using a fast analog-digital converter and a compact peripheral component interconnect computer. Frequency spectra are obtained by FFT in the time domain of the intermediate frequency signal. The scattered millimeter waves are generated during high power electron cyclotron resonance heating experiments on the TEXTOR tokamak and demonstrate the performance of the diagnostics and, in particular, the usability of direct digitizing and Fourier transformation of millimeter wave signals. The diagnostics is able to acquire 4 GHz wide spectra of signals in the range of 136–140 GHz. The rate of spectra is tunable and has been tested between 200 000 spectra/s with a frequency resolution of 100 MHz and 120 spectra/s with a frequency resolution of 25 kHz. The respective dynamic ranges are 52 and 88 dB. Major benefits of the new diagnostics are a tunable time and frequency resolution due to postdetection, near-real time processing of the acquired data. This diagnostics has a wider application in astrophysics, earth observation, plasma physics, and molecular spectroscopy for the detection and analysis of millimeter wave radiation, providing high-resolution spectra at high temporal resolution and large dynamic range. © 2009 American Institute of Physics. 关doi:10.1063/1.3244091兴
I. INTRODUCTION
The main route to the development of fusion power is through the tokamak device. In a tokamak, high temperature plasma is confined by magnetic fields, which form nested toroidal magnetic flux surfaces,1 characterized by their magnetic winding number q. Performance limiting instabilities, such as the magnetohydrodynamic neoclassical tearing mode 共NTM兲, occur at surfaces with simple rational q values such as 2/1 and 3/2. These NTMs create magnetic islands through the breaking and reconnection of magnetic field lines on either side of the resonant surface, leading to a flattening of the pressure profile across the magnetic islands2 and hence a loss of plasma performance. Electron cyclotron heating and current drive 共ECH&CD兲 has demonstrated the ability to suppress NTMs on tokamaks.3–6 ECH&CD and electron cyclotron emission 共ECE兲 take place at localized areas in the plasma where the wave frequency is resonant with the local electron cyclotron frequency or one of its harmonics. In current tokamaks this frequency is in the order of 100 GHz. At this frequency a millimeter wave beam propagates quasioptically as a Gaussian beam, which can be focused by mirrors, such that the power is directed at a well-localized area in the plasma. Sup0034-6748/2009/80共10兲/103504/10/$25.00
pression of NTMs requires the precise deposition of ECH&CD at the center of the island 共O-point兲. On the TEXTOR tokamak, ECH&CD 共Refs. 7 and 8兲 operates at 140 GHz produced by an 850 kW, 10 s pulse length gyrotron with steerable launcher.9 The installation features a pilot scheme for an in-line ECE feedback control system,10–12 which is designed to detect the radial location of the island and the phase between O- and X-points 共island tip兲. These measured ECE signals are used to control the steering of the ECH&CD launcher in a feedback loop. Inline ECE refers to the ECE plasma signal being observed along the same path traveled by the high power ECH&CD beam, thus ensuring inherent positional accuracy. In TEXTOR tearing modes are generated in controlled fashion by magnetic field perturbation coils, the so-called dynamic ergodic divertor 共DED兲.13 During TEXTOR ECH&CD experiments an unexpectedly strong millimeter wave signal was observed,10 limiting the operation of the in-line ECE receiver by saturating the detector channels of the receiver. The nature of this spurious signal is yet unknown and is shown to be no direct reflection of ECH&CD waves from the plasma, but originating from the magnetic island O-point region.14 Trying to understand the nature of the signal is important for two reasons. First,
80, 103504-1
© 2009 American Institute of Physics
Downloaded 25 Jan 2010 to 131.155.67.58. Redistribution subject to AIP license or copyright; see http://rsi.aip.org/rsi/copyright.jsp
103504-2
Rev. Sci. Instrum. 80, 103504 共2009兲
Thoen et al.
detailed experimental data of millimeter wave scattering at these frequencies constrains the theory of electron cyclotron wave propagation and absorption in high-pressure low collisional plasmas. Second, ECH&CD control of NTMs by the in-line ECE scheme requires physics understanding of the origin in order to avoid disturbance of NTM control in larger machines such as ITER, which will operate at higher plasma temperatures, lower collisionality, and higher ECH&CD power. Investigation of the origin of the spurious signals requires measurements at high frequency resolution, high temporal resolution, and high dynamic range. Current in-line ECE and collective Thomson scattering15,16 共CTS兲 diagnostics on TEXTOR achieve a temporal resolution of up to 0.1 MHz and a dynamic range of ⬃26 dB. However, the total frequency range is limited by the number of channels and the fixed bandwidth of the detector channels. The in-line diagnostics has six spectral channels spaced 3 GHz with bandwidth of 500 MHz, the CTS covers 6 GHz with 42 spectral channels, with bandwidths from 80 to 750 MHz. For detailed analysis of the unknown signals, these frequency resolutions are too low. Therefore a new dedicated diagnostics with higher frequency resolution has to be developed, using direct digitizing and postdata acquisition signal processing based on fast Fourier transform 共FFT兲 to make it possible to optimize time and frequency resolution.17 This paper describes the design choices, implementation, and first operation of this new dedicated diagnostics. It has the following structure: Sec. II specifies the requirements of the diagnostics. Section III reviews the underlying theory. Section IV presents laboratory tests and selection of individual components and also measurements and calculations to characterize and calibrate the integrated system. Section V demonstrates the performance of the new diagnostics in scattering measurements on TEXTOR. Section VI discusses the results and proposes recommendations for future work. Section VII concludes the paper. II. REQUIREMENTS
at varying DED phase. This increases the frequency resolution under the assumption that the bursts repeat exactly. The minimum time resolution for the diagnostic is set by the requirement to resolve a single spike at a typical DED fixed island rotation frequency. This leads to a temporal requirement of 5 s, with 40 frequency bands of 100 MHz width. The aliasing allows for longer time scales of 0.1 ms and hence 16 000 bands of 0.25 MHz width. The system will thus be able to acquire 10 000 waveforms/s with ⱕ8000 samples and 200 000 waveforms/s with ⱕ80 samples. To allow for a variable frequency and time resolution the system must be based on a digitizer. No diagnostics exists for direct measurement of signals in the 100 GHz frequency range. The common approach is to downconvert the frequency by means of heterodyne mixing, yielding a frequency range of 0–4 GHz. When digitizing this signal, according to the Nyquist criterion, a sampling frequency of at least 8 GHz is required in order to avoid loss of information due to aliasing.19 The choice of heterodyne detection with digitizing sets constraints on the amplification and the noise figure 共NF兲. Requirements derive from the digitizer selected. To allow for simultaneous ECE and scattering measurements, the dynamic range of the instrument should exceed 40 dB. The signal to noise ratio 共SNR兲 requirement is set at ⬎40 dB. The above requirements refer to the sampling of data for off-line processing and analysis. Future development includes a FFT based ECE feedback control system,20 which requires a data handling capacity in excess of 5 GSa/s. It is noted that diagnostics with the above characteristics can be applied to other fields of science, such as earth observation, astrophysics, molecular spectroscopy using millimeter wave observations for understanding atmospheric composition, interstellar clouds, and molecular line shapes. B. Requirements flow down
Requirements of individual elements of the detection chain follow from the top-level functional requirements. Some requirements are based on limits that can be practically achieved.
A. Top level requirements
The spurious scatter signal to be investigated appears in periodic bursts occurring on the typical time scale of plasma rotation 共millisecond兲 with a signal frequency ranging from 136 to 140 GHz. Each burst displays a strong amplitude variation 共spikes兲 on a submillisecond time scale. CTS measurements show that the events have a radiation temperature of ⬃100 keV.18 Characterization of the signal requires the simultaneous measurement by CTS and ECE diagnostics. From CTS measurements the bursts of spurious signals appear to have their origin inside the O-point of the islands and are therefore synchronized with the rotation of the islands. The tearing mode is induced in TEXTOR plasma by the DED and therefore accurately controlled by the DED in frequency and phase. This allows two basic approaches for diagnosis: The first is to resolve a single spike at moderate frequency resolution. Alternatively, by deliberately aliasing, a spike can be reconstructed from a number of spike samples
1. Heterodyne front end
A heterodyne receiver mixes the radio frequency 共rf兲 signal with frequency f rf with a local oscillator 共LO兲 frequency f LO to downconvert to an intermediate frequency 共IF兲 signal.21 The process of mixing is mathematically equivalent to multiplying two harmonics yielding up- and downconverted frequency difference components. In this case, the f rf range is between 136 and 140 GHz. Fixing f LO at 140 GHz yields an IF band between 0 and 4 GHz. This refers to the signal downconverted to the lower sideband. However, signals ranging from 140 to 144 GHz at the upper sideband are also generated. The CTS measurements showed signals between 137 and 140 GHz, indicating no sideband filtering is required. A benefit is the improved SNR behavior without filtering. Amplification is needed to ensure compatibility with the input level of the digitizer. An added benefit of
Downloaded 25 Jan 2010 to 131.155.67.58. Redistribution subject to AIP license or copyright; see http://rsi.aip.org/rsi/copyright.jsp
103504-3
Rev. Sci. Instrum. 80, 103504 共2009兲
Thoen et al.
sufficient amplification is that the noise in the system approaches the theoretical noise temperature limit. 2. Mixer
Mixers are characterized by rf and IF ranges, conversion loss, and NF. The requirements on the mixer are • rf range of 136–140 GHz, • conversion loss of ⬍20 dB, and • NF of ⬍20 dB. The latter two requirements flow down from the top-level requirement of simultaneous measurement of ECE and scattered signal. Ideally, the IF range extends from direct current 共dc兲 to 4.0 GHz, but this is no strict requirement. The output of the mixer has a 4 GHz bandwidth and is sampled at 8 GHz. To avoid aliasing of high 共⬎4 GHz兲 frequency components, the mixer output signals can be filtered. 3. Local oscillator
The requirements on the LO are • frequency stability of 140.00 GHz⫾ 0.01 GHz and • LO output power matches rf input power of the mixer, viz., ⬃10 mW.
TS = T1 +
T2 T3 + + ¯, G 1 G 1G 2
共1兲
where the equivalent noise temperatures Tn can be calculated from the noise factor F and the ambient temperature T0 : Tn = 共F − 1兲T0. The gain Gn is considered a loss when Gn is smaller than unity. Expressed in decibels as NF= 10 log F, the noise factor is called NF, which will be used throughout this report. The total equivalent noise temperature Ttot of an ECE system in a tokamak is the sum of the noise temperature of the plasma electrons 共Te兲 and the noise temperature of the ECE diagnostics:24 Ttot = Te + TS. Ideally, the thermal noise of the electrons is dominating over all other noise sources. Ts for our system is calculated by using a derived cascade noise equation: TS = 共Lwg − 1兲T0 + LwgTR, where Lwg is the loss in the transmission line in decibel and TR is the equivalent noise temperature of the radiometer. Combining these equations yields Ttot = Te + 共Lwg − 1兲T0 + LwgTR .
共2兲
The total noise temperature serves to estimate the minimum detectable power.21
B. FFT, SNR, and sensitivity 4. Amplifier
Amplifiers are characterized by their bandwidth, gain, NF, and dynamic range. Requirements on the amplifier are • • • •
frequency range dc ⫺4 GHz; gain of ⬎30 dB, low noise characteristics, NF⬍ 5 dB, and maximum output power level of ⬎10 dBm.
The requirement on the NF flows down from the requirement of simultaneously measure ECE and scattered signal. The gain of the amplifier must match to a full scale reading of the digitizer. For fixed gain amplifiers the input power level should not exceed the maximum input power level of the digitizer minus the amplifier gain. 5. Digitizer
Requirements on the digitizer are • signal sampling frequency of ⬎8 GHz, • a tunable retrigger rate of 10–200 kHz, • data storage sufficient to store ⬃1.0 s of data, equivalent to 16⫻ 106 samples, and • output dataflow of ⬎100 MSa/ s to allow for FFT based ECE feedback control.
III. THEORY A. Noise
The 共equivalent兲 noise temperature of a system 共Ts兲 can be calculated using the cascade noise equation of Friis,21–23
The spectral resolution ⌬f of a FFT is a function of the sample rate f s of the analog-digital converter 共ADC兲 and the number of time domain samples N,19 ⌬f =
fs . N
共3兲
For a given sample rate, increasing the number of samples increases the frequency resolution. When using FFT, spectral leakage will occur.19 Spectral leakage can be limited by applying windows on the time domain signal. Several shapes of windows are available, of which the flattop window is best suited for relatively wideband signals, providing increased amplitude accuracy.17,25 The number of samples in the frequency domain can be calculated from the time domain sample size, N f = 21 N + 1.
共4兲
Throughout this report the number of samples referred to is the time domain sample size N unless stated otherwise. For classical radiometers, their sensitivity can be obtained from the radiometer formula21,24,26
冑
Pmin = kBBTtot
2Bvid , BIF
共5兲
with Pmin as the least detectable power 共W兲, kb as Boltzmann’s constant, 1.38⫻ 10−23 W / K, B as the input bandwidth 共Hz兲, Ttot as the total equivalent noise temperature of the system 共K兲, Bvid as the video bandwidth of the radiometer 共Hz兲, and BIF as the IF bandwidth of the radiometer 共Hz兲. Combining Eqs. 共3兲 and 共5兲 and the expression for the bandwidth and taking B = BIF yields
Downloaded 25 Jan 2010 to 131.155.67.58. Redistribution subject to AIP license or copyright; see http://rsi.aip.org/rsi/copyright.jsp
103504-4
Rev. Sci. Instrum. 80, 103504 共2009兲
Thoen et al.
冑
Pmin = kB f sTtot
TABLE I. High-speed data acquisition systems examined.
1 N
共6兲
expressing the minimal detectable power of a FFT based receiver. The SNR of an ideal digitizer with Nb bits can be calculated following Bennett,19 showing that the full scale sine wave SNR is given by SNR = 6.02Nb + 1.76 dB + 10 log
fs , 2⌬f
Model
Type
Agilent ESA E4407B Spectrum analyzer Tektronix RSA 6100, Opt.110 RT spectrum analyzer Agilent DSO 90804A Infiniium Oscilloscope Tektronix DPO 70000 series Oscilloscope Agilent/Acqiris DC-222 cPCI card system/digitizer National Instruments NI-PXI 5663 PXI card system/digitizer
共7兲
where the latter part is the process gain. Substituting Eq. 共3兲 in Eq. 共7兲 yields N SNR = 6.02Nb + 1.76 dB + 10 log . 2
Manufacturer
共8兲
This is the FFT noise floor of an 共ideal兲 ADC. When the SNR of the ADC is known, the effective number of bits Nb 共ENOB兲 of the ADC can be calculated. IV. TESTING A. Heterodyne mixing
Two mixers have been tested: A mixer manufactured by AI-ATD Division, series 041, model 9602 marked F0 = 140 GHz, which is a double sideband mixer; a mixer manufactured by Millitech MWW Division, type MXF-06ES, which is custom made for the Rijnhuizen tokamak project and is designed for a LO of 128 GHz and optimized for an IF of 6–18 GHz. The mixer is single ended. This means the LO has to be combined with the rf signal before entering the mixer. This process is done by an external ⫺10 dB coupler. The average conversion loss of the AI-ATD mixer is ⫺33 dB. The conversion loss of the Millitech mixer has an average value of ⫺15 dB. The NF of the AI-ATD mixer is unknown, although it is reasonable to assume that it is equal to the conversion loss at maximum, resulting in a NF ⬃35 dB. The NF of the Millitech mixer is 10 dB according to the manufacturer.
a maximum input power of ⫺13 dBm. The WENTEQ amplifier has a gain of 35 dB and NF= 4.6 dB. The P−1 dB = +14 dBm, giving a maximum input power level of ⫺18 dBm. The gain and NF performance of the WENTEQ amplifier are better than that of the MINI-CIRCUITS device, making it the best suited device for the rf front end. C. High-speed data acquisition
The choice of the digitizer is based on the requirements stated in Sec. II with bandwidth requirement of 4 GHz or over. Six digitizers have been examined in order to find the best fit to the requirements: two spectrum analyzers, two memory scopes, and two high speed data-acquisition card systems 共see Table I兲. Table II lists the performance of the various types of digitizer. 1. Trigger rate
The retrigger rate is the time required for the system to be able to receive another 共series兲 of triggers, in order to do continued measurements. The oscilloscopes are able to acquire up to 300 000 waveforms/s but their retriggering of the system is limited to the screen refreshment rate of 50 Hz. All except the spectrum analyzer are capable of retrieving data at the required trigger rate. According to the specifications the Agilent spectrum analyzer is not capable of retrieving more than about 40 triggers/s. 2. Bandwidth
B. Amplification
Two amplifiers have been examined. The MINICIRCUITS amplifier has a gain of 30 dB and a NF of 6 dB. The maximum output level is P−1 dB = +17 dBm, resulting in
The requirement on the real time 共RT兲 bandwidth is 4 GHz. The tested spectrum analyzer and both oscilloscopes have wider bandwidths of 26.5 and 8 GHz, respectively. Tektronix RTSA has a RT bandwidth of 110 MHz. The band-
TABLE II. Trade-off matrix indicates the performance of the various types of digitizers. The cPCI system of Acqiris meets or exceeds all requirements. Digitizer performance is indicated per channel, if applicable.
Digitizer Requirements Agilent SA Tektronix RTSA Agilent scope Tektronix scope Acqiris cPCI NI PXI
Trigger rate 共kHz兲
Retrigger rate 共kHz兲
RT bandwidth 共GHz兲
Data flow 共MSa/s兲
200 4 ⫻ 10−2 5 ⫻ 104 300 300 106 300
200 4 ⫻ 10−2 6 ⫻ 104 5 ⫻ 10−2 5 ⫻ 10−2 106 0.3
4 26.5 0.110 2.5–13 4–20 4.0 0.05
100 ⬃0.01 Unknown, but RT 22 10 ⬎200 75
Downloaded 25 Jan 2010 to 131.155.67.58. Redistribution subject to AIP license or copyright; see http://rsi.aip.org/rsi/copyright.jsp
103504-5
Rev. Sci. Instrum. 80, 103504 共2009兲
Thoen et al.
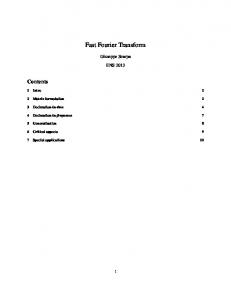
FIG. 1. 共Color online兲 Noise floor of the frequency measurement system without signal input. The ADC’s maximum input power of +4 dBm is normalized at 0 dB. The measurements are in good agreement with the predictions.
width of the Acqiris digitizer is 4 GHz. The digitizer card from NI has a bandwidth of 3.7 GHz, with a RT bandwidth of 50 MHz. 3. Data flow
The requirement on the data flow is 100 MSa/s. The back ends of the RTSA and Acqiris cPCI are equipped with high speed 64 bits, 66 MHz PCI bus outputs both exceeding the requirements, allowing sufficient data throughput for RT control. 4. Component selection
Only the Acqiris/Agilent DC2X2 digitizer card series meets or exceeds the requirements on all requirements. Furthermore it is the only system that is able to be used in a RT feedback control loop, mainly because of its performance on the trigger rearm time and its high speed data flow. Other manufacturers of high speed digitizer cards have been contacted in order to find a system with features comparable to the Acqiris/Agilent DC222 digitizer card. At this moment, only Acqiris/Agilent is able to provide the required performance. The digitizer system purchased has standard acquisition memory settings, while the random access memory 共RAM兲 of the cPCI card is expanded to 2 Gbytes. D. Integration of components
Full system tests of the front end and the data acquisition system are required to verify the requirements and performance. Section IV D 1 shows the results of tests conducted to establish system noise and sensitivity. Section IV D 2 gives a description of the control and data acquisition system. Section IV D 3 explores the maximum amount of data and data transfer rates that can be achieved. Section IV D 4 provides the calibration curve of the entire measurement system. Section IV D 5 describes an in situ system check.
1. System noise and sensitivity
The dynamical range is not only depending on the SNR but also on the process gain. For multiple sample sizes, the dynamic range has been determined and the results are plotted in Fig. 1. Equation 共8兲 provides a description of the FFT noise floor of the digitizer. Averages are calculated by averaging linear powers instead of decibels. Measurements at a frequency of 2.0 GHz show an average SNR of 31.7 dB, which is in agreement with the specifications of the manufacturer and the predictions. The average ENOB is Nb = 5 bits. The ADC looses one ENOB bit on sample sizes of 1000, 10 000, 20 000, and 60 000 samples 共Nb = 4.3 bits兲, yielding a decrement of the dynamic range of 7 dB, while 1 bit is gained on 300 000 samples 共Nb = 6.6 bits兲, providing 6.0 dB more dynamic range. The measurements agree with the specifications. The signal will deteriorate depending on the noise characteristics of the components of the receiver. Table III lists results of a calculation of the individual noise temperature contributions of each component, the total NF and noise temperature of the receiver. Total equivalent noise temperature of the heterodyne receiver is about TR = 1.6⫻ 105 K, resulting in a total NF of 27.5 dB. The calculated noise temperature of the FFT diagnostic TABLE III. Calculation of the total equivalent noise temperature of the heterodyne receiver. The total equivalent noise temperature is used to calculate the total NF.
Component 10 dB coupler Mixer Amplifier IF cable Digitizer Total
NF 共dB兲
Gain 共dB兲
Noise temperature 共K兲
0.5 15 4.6 0.2 35.3 27.5
⫺0.5 ⫺15.2 35.3 ⫺0.2 0.0 19.4
33 10⫻ 103 21⫻ 103 0 1.4⫻ 105 1.6⫻ 105
Downloaded 25 Jan 2010 to 131.155.67.58. Redistribution subject to AIP license or copyright; see http://rsi.aip.org/rsi/copyright.jsp
103504-6
Rev. Sci. Instrum. 80, 103504 共2009兲
Thoen et al.
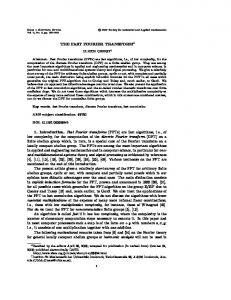
FIG. 2. 共Color online兲 Flowchart of the
LABVIEW
can be compared to the performance of the in-line radiometer on TEXTOR.24 The six channels of the in-line radiometer have a noise temperature of TR ⬃ 7 ⫻ 103 K. Losses of the waveguides and frequency selective coupler have not been included at this stage, but do have a large impact on the system SNR behavior. Loss calculations show the total transmission line up to the ⫺10 dB coupler has a frequency dependent loss of Lwg ⬃ 23 dB for the FFT diagnostic. This loss is mainly caused by the frequency selective coupler in the in-line ECE.24 For an electron temperature of 1 keV and ambient temperature T0 = 300 K, the total noise temperature of the FFT system is Ttot,FFT ⬃ 43⫻ 106 K. The in-line ECE diagnostic has a total noise temperature lower than Ttot,in-line ⬃ 12.8⫻ 106 K. 2. Data acquisition: Hard- and software
The software used is National Instrument’s LABVIEW, version 8.5.1. LABVIEW applications are developed to control the digitizer, to acquire waveforms, and to perform signal processing. The main program initializes, calibrates, configures, and arms the digitizer, making it ready for receiving a trigger. For measurements on TEXTOR the digitizer is controlled by an external trigger source, which is triggered by a single trigger from the TEXTOR ECRH control system. Each trigger from the external trigger sources gives one acquisition of an individual waveform. The structure of the data acquisition application is shown in Fig. 2. After the digitizer is armed, the system idles until a trigger is received. After a trigger is received, the data are sent
application used for data acquisition.
from the acquisition memory to the RAM of the cPCI card. After the last waveform is acquired and has been sent, the data on the cPCI card are near-RT processed, saved, and plotted. The digitizer accompanies each waveform with a picosecond precision timestamp, making it possible to identify different waveforms and to qualify the data throughput rate.
3. Data transfer testing
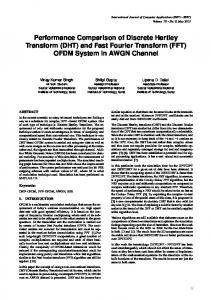
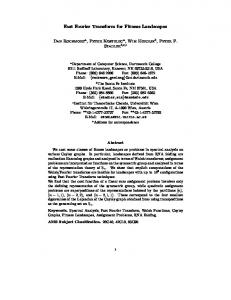
Measurements on the data transfer rate of the system are done in order to see how many spectra per second can be acquired. This can be done by using the waveform timestamps, producing picosecond precision of the trigger event. The time difference between two consecutive timestamps must equal the period of the trigger frequency of the external trigger or the system is not able to acquire waveforms at this sample and trigger setting. Lower sample sizes and/or larger trigger periods are then required to get accurate and precisely timed waveforms. Measurements show that the system is able to acquire 200 000 waveforms/s, with 80 samples per waveform 共see Fig. 3兲. The figure shows a detail of a test measurement. Waveforms of 8000 samples can be acquired at a rate of 10 kHz. Waveforms of 320 000 samples can be acquired at a rate of 125 Hz 共see Fig. 4兲. All acquisitions can be done for a period of approximately 1.0 s. The data throughput could possibly be improved by using other development environments such as MATLAB, LABVIEW RT, and C / C++.
FIG. 3. 共Color兲 Left: uncalibrated spectrogram of a measurement without any input signals, showing that 80-sample waveforms are acquired at a rate of 200 kHz, giving spectra with a frequency resolution of 100 MHz. The noise floor is at ⫺63 dBm. Right: detail of the spectrogram, zoomed in at the time interval of 40.00–40.20 ms, showing 40 spectra.
Downloaded 25 Jan 2010 to 131.155.67.58. Redistribution subject to AIP license or copyright; see http://rsi.aip.org/rsi/copyright.jsp
103504-7
Rev. Sci. Instrum. 80, 103504 共2009兲
Thoen et al.
FIG. 4. 共Color兲 Left: uncalibrated 320 000-sample spectrogram of a test signal produced with a backward wave oscillator 共BWO兲 at 138.79 GHz. The frequency resolution of the spectra is 25 kHz, while the acquisition rate of the waveforms is 120 Hz, yielding more than 85 dB dynamic range. The figure on the right shows a close-up of the BWO signal, jittering up and down in its frequency band illustrating the high frequency resolution. The 10 MHz frequency range has about 400 frequency bins.
4. Calibration and data processing
Calibration of the system has been conducted in two steps in order to obtain a frequency dependent loss characterization of the components 共hardware losses兲 and to obtain a sample size related correction 共software loss兲. The hardware loss has been divided in three parts: response of the dielectric plates, conversion loss of the in-line front end, and conversion loss of the FFT front end with its digitizer. The response of the dielectric plates is calculated. In-line measurements of the plates’ response are in agreement with the estimates.10 The insertion losses of the horn, notch filter, and p-i-n switch have been measured and verified in Ref. 10. The FFT front end and digitizer have been calibrated in the laboratory by offering signals with known powers in the range of 136–144 GHz. The combination of the hardware compensation factors needed for calibration is plotted in Fig. 5. Since the sample size of the diagnostic is tunable, the applied correction factors are linear interpolations of the original. The blue line in Fig. 5 is the total hardware correction of the system. The dielectric plates strongly decrease the dynamic range near the peaks. The peak at 136.80 GHz is the
second harmonic of the dielectric plates, recurring at multiples of 3 GHz.24 The calibration used 共the pink line兲 has a maximum correction of 30 dB, to prevent a visual dominancy by the gyrotron frequency 共139.85 GHz兲. For more accurate measurements it is recommended to use dielectric plates with less thickness to lay the notches further apart. This will remove the peak at 136.80 GHz. Data processing is done in the following order. After the data have been sent to the cPCI card, it is stored in the RAM. When all data have been collected, the signal processing is started. Each individual waveform is read from the memory and windowed before transforming into frequency power spectra. After the power FFT the sample size dependent software correction is subtracted from the signal followed by conversion of the power spectrum into a decibel scale, after which the hardware correction is applied. The data can now be plotted and saved. The software calibration is a sample size related correction to minimize the contribution of spurious signals made by the Fourier transformations. The software characterization is done on TEXTOR. For each desired sample size an in situ, full system measurement without plasma, ECRH, or external signals is conducted. The data are processed the same as real measurement data, apart from the fact that the frequency domain waveforms are averaged. The result is a sample size dependent calibration, matching the same sample size as the scattering measurements. Because the calibration files have had the same signal processing, the software compensation also corrects for the scaling factor of the flattop window. 5. In situ full system test
FIG. 5. 共Color兲 Hardware calibration curve of the complete frequency measurement system. The high peaks are caused by the dielectric plates in the in-line ECE system. The pink curve is based on the blue conversion loss of the system but is limited to a maximum calibration of 30 dB.
After installation of the diagnostic in the TEXTOR inline ECE feedback system, an in situ system check is performed to ensure proper operation. A frequency source is placed in the ECRH transmission line with a test frequency of 138.8 GHz. The result is shown in Fig. 6. The plotted spectrogram is calibrated with the software calibration for 320 000 samples. The test signal observed has
Downloaded 25 Jan 2010 to 131.155.67.58. Redistribution subject to AIP license or copyright; see http://rsi.aip.org/rsi/copyright.jsp
103504-8
Thoen et al.
FIG. 6. 共Color online兲 Measured frequency spectrum with the diagnostic placed in the in-line ECE feedback unit on TEXTOR being partly calibrated. The original 320 000-sample waveform size is reduced to only 5000 frequency bins, limiting the frequency resolution to 0.8 MHz. The peak of the test source at 138.8 GHz, ⫺40 dBm is clearly visible. The dynamical range is ⬃88 dB.
a power of about ⫺40 dBm, at a frequency of 138.8 GHz. The measurements on TEXTOR require a remote desktop connection program to control the diagnostic and view the data RT. V. DEMONSTRATION OF THE FFT DIAGNOSTICS ON TEXTOR
Rev. Sci. Instrum. 80, 103504 共2009兲
FIG. 7. 共Color兲 Calibrated plot 共see Fig. 5兲 of time-resolved frequency spectra of millimeter-wave radiation in the TEXTOR tokamak, shot No. 108086. The DED is used to move the magnetic island slightly back and fourth through the observation region with a frequency of about 2 Hz. The thin green lines in the 139.8 GHz range are the reflections on the plasma of the gyrotron and one of its harmonics. The gyrotron signals are being suppressed below 120 dB. The frequency resolution is 4 MHz with a time resolution of 1 ms. The dynamic range of signal power exceeds 60 dB.
4 MHz. The DED is used to move the magnetic island back and forth of the observation region of the in-line ECE system, producing the characteristic images shown. The gyrotron component and one of its harmonics at a slightly lower frequency can be distinguished around 139.8 GHz.
A. Dynamic ergodic divertor
VI. DISCUSSION AND FUTURE DEVELOPMENT
When the TEXTOR DED current exceeds a certain threshold value, an m / n = 2 / 1 tearing mode is excited in the plasma.27 The 2/1 tearing mode is locked to the 2/1 perturbation field of the DED, synchronizing its rotation with the DED frequency. High reproducibility of these DED induced 2/1 tearing modes provides for a suitable target for physics study28 and for the development of a closed-loop feedback control system for tearing mode suppression.11 The island width of a typical 2/1 tearing mode in TEXTOR varies from several centimeters to 10 cm. The rotation frequency as induced by DED operation is typically 1 kHz. Natural tearing modes in TEXTOR, without DED but caused, for instance, by high edge radiation can have a rotation frequency up to 4 kHz depending on plasma rotation and pressure. TEXTOR does not usually reach parameters to induce sizable neoclassical bootstrap currents, and as a result the neoclassical contribution to the growth of the modes is negligible. Although as a consequence, under most operating conditions, NTMs do not occur on TEXTOR, most of the characteristics of the DED induced islands are identical to real NTM islands.
A FFT millimeter wave diagnostics for high frequency resolution and high temporal resolution research has been developed. A heterodyne front end is combined with an 8 GHz high speed ADC from Acqiris/Agilent Technologies. Validation tests show that the performance of the diagnostic matches or exceeds the requirements that were defined for both the short and the long time scales. The bandwidth of the diagnostic is 4 GHz, ranging from 136 to 140 GHz. The system is able to retrieve up to 200 000 waveforms/s, with a frequency resolution of 100 MHz. For the long time scale it is possible to acquire spectra with a frequency resolution of 1 MHz at a rate of 10 kHz. The maximum frequency resolution is 25 kHz at a corresponding rate of 125 Hz. The sensitivity of the system exceeds the requirements: the SNR is over 31 dB without process gain. The dynamic range goes up from 52 dB for 100 MHz frequency resolution to 88 dB at 25 kHz frequency resolution. The equivalent noise temperature of the FFT radiometer is 1.7⫻ 105 K or 14.6 eV. Installed in the in-line ECE feedback system the equivalent noise temperature is 43⫻ 106 K, or about 3.7 keV. Future work on improved FFT millimeter wave diagnostics includes the following.
B. Proof of principle
• Use of a 140 GHz phased locked LO to decrease the LO noise in the IF components. Replacing the current mixer with a low noise 140 GHz mixer 共NF⬃ 5 dB兲 and placing a low noise 共NF⬃ 1 dB兲 amplifier would greatly reduce the overall noise temperature of the diagnostics.
Measurements conducted in the October–November 2008 TEXTOR operation period show required performance of the diagnostics developed, as is illustrated by Fig. 7. The time resolution is 1 ms and the frequency resolution is
Downloaded 25 Jan 2010 to 131.155.67.58. Redistribution subject to AIP license or copyright; see http://rsi.aip.org/rsi/copyright.jsp
103504-9
Rev. Sci. Instrum. 80, 103504 共2009兲
Thoen et al.
• Software and memory settings to be optimized for increasing the amount of data stored during measurements. The added value of using LABVIEW RT or customized MATLAB programming should be explored. Expanding the RAM of the PC to 4 Gbytes in combination with 64 bits WINDOWS would allow for a longer measurement period. A multicore processor together with an application employing all processing cores will decrease the amount of time needed for signal processing. • Development work needs to be done to employ this diagnostics for ECE profile measurements. Requirements of the in-line ECE include an equivalent noise temperature for the receiver of one tenth of the TECE, or 100 eV.24 By eliminating the frequency selective function from the ECE optical path, the total equivalent noise temperature could improve sufficiently to allow detection of the ECE profile over a distance of several centimeters. • A FFT based ECE feedback control system should be developed by employing four additional cPCI cards and replacing the mixers and LO. Such FFT based ECE radiometer features a tunable spatial resolution at adequate 20 GHz bandwidth and adjustable frequency resolution. Additionally, the use of a RT operating system would yield the system suitable for integration into the feedback loop of the control system for suppression of plasma instabilities.
VII. CONCLUSION
A direct digitizing FFT based millimeter wave diagnostic has been successfully demonstrated. Development of this new diagnostic was necessary in order to investigate in detail the unknown nature of scattered millimeter waves observed by the in-line ECE measurements on TEXTOR.14 Major benefits of the system are a tunable frequency and resolution and high dynamic range due to postdetection processing of the data, obtained by a configuration using heterodyne downconversion and broadband direct digitizing and FFT of the IF signal. Extensive research on the optimal component selection has been carried out, dominated by digitizer performance. The DC222 digitizer from Acqiris/Agilent Technologies has been selected on the basis of test results reported and the possibility of extending this diagnostics to a FFT based ECE radiometer for an ECRH&CD feedback control system. The diagnostic has been assembled and tested. Full system tests with the assembled millimeter wave diagnostic show full compliance with the requirements. Validation on TEXTOR showed that the diagnostics is capable of detecting and processing the scattered signals and rendering these amenable to analysis by combining a tunable frequency resolution with high dynamic range, in trade-off with the time resolution. ACKNOWLEDGMENTS
The collaboration with Acqiris/Agilent is appreciated: Mr. Laurent Weber 共Acqiris Switzerland兲 is acknowledged for his hardware support, and the Dutch representative of Acqiris 共TTMS, Nieuw-Vennep兲 is acknowledged for their
support and effort regarding the 共testing兲 equipment. The help of Mr. Woskov has been greatly inspiring. This work, supported by the European Communities under the Contract of Association between EURATOM-FOM, was carried out within the framework of the European Fusion Program. The views and opinions expressed herein do not necessarily reflect those of the European Commission. J. Wesson, Tokamaks, 3rd ed. 共Oxford University Press, Oxford, 2004兲. O. Sauter, R. J. La Haye, Z. Chang, D. A. Gates, Y. Kamada, H. Zohm, A. Bondeson, D. Boucher, J. D. Callen, M. S. Chu, T. A. Gianakon, O. Gruber, R. W. Harvey, C. C. Hegna, L. L. Lao, D. A. Monticello, F. Perkins, A. Pletzer, A. H. Reiman, M. Rosenbluth, E. J. Strait, T. S. Taylor, A. D. Turnbull, F. Waelbroeck, J. C. Wesley, and H. R. Wilson, Phys. Plasmas 4, 1654 共1997兲. 3 H. Zohm, G. Gantenbein, G. Giruzzi, S. Gunter, F. Leuterer, M. Maraschek, J. Meskat, A. G. Peeters, W. Suttrop, D. Wagner, and M. Zabiego, Nucl. Fusion 39, 577 共1999兲. 4 A. Isayama, Y. Kamada, N. Hayashi, T. Suzuki, T. Oikawa, T. Fujita, T. Fukuda, S. Ide, H. Takenaga, K. Ushigusa, T. Ozeki, Y. Ikeda, N. Umeda, H. Yamada, M. Isobe, Y. Narushima, K. Ikeda, S. Sakakibara, K. Yamazaki, and K. Nagasaki, Nucl. Fusion 43, 1272 共2003兲. 5 R. J. La Haye, R. Prater, R. J. Buttery, N. Hayashi, A. Isayama, M. E. Maraschek, L. Urso, and H. Zohm Nucl. Fusion 46, 451 共2006兲. 6 C. C. Petty, R. J. La Haye, T. C. Luce, D. A. Humphreys, A. W. Hyatt, J. Lohr, R. Prater, and E. J. Strait, Nucl. Fusion 44, 243 共2004兲. 7 J. W. Oosterbeek, W. A. Bongers, A. F. van der Grift, J. A. Hoekzema, O. G. Kruijt, A. J. Poelman, P. R. Prins, J. Scholten, F. C. Schüller, and C. J. Tito, Fusion Eng. Des. 66, 515 共2003兲. 8 E. Westerhof, J. A. Hoekzema, G. M. D. Hogeweij, R. J. E. Jaspers, F. C. Schüller, C. J. Barth, H. Bindslev, W. A. Bongers, A. J. H. Donne, P. Dumortier, A. F. van der Grift, D. Kalupin, H. R. Koslowski, A. KrämerFlecken, O. G. Kruijt, N. J. Lopes Cardozo, H. J. van der Meiden, A. Merkulov, A. Messiaen, J. W. Oosterbeek, P. R. Prins, J. Scholten, B. Unterberg, and M. Vervier, Fusion Sci. Technol. 47, 108 共2005兲. 9 N. J. Dobbe, A. B. Sterk, R. P. J. J. M. Kruisbergen, O. G. Kruyt, M. E. Bestebreurtje, P. R. Prins, J. A. Hoekzema, and A. F. van der Grift, Fusion Eng. Des. 56, 599 共2001兲. 10 J. W. Oosterbeek, A. Burger, E. Westerhof, M. R. de Baar, M. A. van den Berg, W. A. Bongers, M. F. Graswinckel, B. A. Hennen, O. G. Kruijt, D. J. Thoen, R. Heidinger, S. B. Korsholm, and F. Leipold, Rev. Sci. Instrum. 79, 093503 共2008兲. 11 B. A. Hennen, E. Westerhof, J. W. Oosterbeek, P. W. J. M. Nuij, D. De Lazzari, G. W. Spakman, and M. R. de Baar, Fusion Eng. Des. 84, 928 共2009兲. 12 W. A. Bongers, A. P. H. Goede, E. Westerhof, J. W. Oosterbeek, N. J. Doelman, F. C. Schuller, M. R. De Baar, W. Kasparek, W. Wubie, D. Wagner, J. Stober, Fusion Sci. Technol. 55, 188 共2009兲. 13 K. H. Finken, Transactions of Fusion Sci. Technol. 49, 240 共2006兲. 14 E. Westerhof, S. K. Nielsen, J. W. Oosterbeek, M. Salewski, M. R. de Baar, W. A. Bongers, A. Bürger, B. A. Hennen, S. B. Korsholm, F. Leipold, D. Moseev, M. Stejner, D. J. Thoen, and the TEXTOR team, Phys. Rev. Lett. 103, 125001 共2009兲. 15 S. Michelsen, S. B. Korsholm, H. Bindslev, F. Meo, P. K. Michelsen, E. L. Tsakadze, J. Egedal, P. Woskov, J. A. Hoekzema, and F. Leuterer, Rev. Sci. Instrum. 75, 3634 共2004兲. 16 H. Bindslev, S. K. Nielsen, L. Porte, J. A. Hoekzema, S. B. Korsholm, F. Meo, P. K. Michelsen, S. Michelsen, J. W. Oosterbeek, E. L. Tsakadze, E. Westerhof, and P. Woskov, Phys. Rev. Lett. 97, 205005 共2006兲. 17 W. A. Bongers, “Millimeter-wave aspects of the FOM fusion free electron maser,” Ph.D. thesis, Eindhoven University of Technology, 2004. 18 S. K. Nielsen, J. W. Oosterbeek, and E. Westerhof 共private communications, 2008兲. 19 S. W. Smith, The Scientist and Engineer’s Guide to Digital Signal Processing, 1st ed. 共California Technical, California, 1997兲. 20 W. A. Bongers, D. J. Thoen, M.R. de Baar, V. van Beveren, M. A. van den Berg, A. P. H. Goede, M. F. Graswinckel, B. A. Hennen, J. W. Oosterbeek, and E. Westerhof, “Fast Fourier transform based on flexible high dynamic range ECE systems for real-time Tokamaks control” 共unpublished兲. 21 H. J. Hartfuss and T. Geist, Plasma Phys. Controlled Fusion 39, 1693 共1997兲. 22 D. M. Pozar, Microwave Engineering, 2nd ed. 共Wiley, New York, 2003兲. 1 2
Downloaded 25 Jan 2010 to 131.155.67.58. Redistribution subject to AIP license or copyright; see http://rsi.aip.org/rsi/copyright.jsp
103504-10 23
Thoen et al.
J. F. M. van Gelder, “Electron cyclotron wave absorption experiments in tokamak plasmas,” Ph.D. thesis, University of Utrecht, 1996. J. W. Oosterbeek, “Towards a self-aiming microwave antenna to stabilise fusion plasmas,” Ph.D. thesis, Eindhoven University of Technology, 2009. 25 G. I. J. A. Kramer 共private communication兲. 26 R. H. Dicke, Rev. Sci. Instrum. 17, 268 共1946兲. 27 H. R. Koslowski, Y. Liang, A. Kramer-Flecken, K. Lowenbruck, M. von 24
Rev. Sci. Instrum. 80, 103504 共2009兲 Hellermann, E. Westerhof, R. C. Wolf, and O. Zimmermann, Nucl. Fusion 46, L1 共2006兲. 28 E. Westerhof, A. Lazaros, E. Farshi, M. R. de Baar, M. F. M. de Bock, I. G. J. Classen, R. J. E. Jaspers, G. M. D. Hogeweij, H. R. Koslowski, A. Kramer-Flecken, Y. Liang, and N. J. Lopes Cardozo, Nucl. Fusion 47, 85 共2007兲.
Downloaded 25 Jan 2010 to 131.155.67.58. Redistribution subject to AIP license or copyright; see http://rsi.aip.org/rsi/copyright.jsp