In the third part, the performance of students working in the open learning ...... tem (LCMS) and adaptive and intellige
Dissertation for the degree of doctor of philosophy
Development and testing of an open learning environment to enhance statistics and mathematics education
Anna Helga Jónsdóttir
School of Engineering and Natural Sciences Faculty of Physical Sciences Reykjavík, April 2015
Dissertation submitted in partial fulfilment of a Philosophiae Doctor degree in Statistics
Doctoral committee Prof. Gunnar Stefánsson, advisor University of Iceland Dr. Freyja Hreinsdóttir University of Iceland Dr. Auðbjörg Björnsdóttir University of Akureyri
Opponents Prof. Per B. Brockhoff Technical University of Denmark Dr. Robert C. delMas University of Minnesota
Development and testing of an open learning environment to enhance statistics and mathematics education c 2015 Anna Helga Jónsdóttir
Printed in Iceland by Háskólaprent ISBN 978-9935-9263-0-2
Abstract The work done in relation to this thesis can be split up into three parts. In the first part, mathematical skills of first year students in the School of Engineering and Natural Sciences, University of Iceland, are investigated. A status exam was administrated to the students in the beginning of their first semester from 2011 to 2014. The results show that a large proportion of students lack basic skills in mathematics. Analysis of variance was used to investigate which background variables are linked to performance on the test. Secondary school, gender, year of diagnostic test, time since last mathematics course in secondary school, number of semesters of mathematics courses in secondary school and the students’ perception on how well they did in mathematics in secondary schools and how well they are prepared were all linked to performance on the test. The result on the diagnostic test was also found to be a good predictor of performance in first year calculus courses, specially for students in mathematics, physics and engineering. In the second part, development of an open learning environment, the tutorweb, is described. The system has been under development in the University of Iceland for the past decade. Educational material within mathematics and statistics is available within the system at no cost for the users, including over 4000 exercises. Novel algorithms for allocating exercises to students as well as grading with the goal of increase learning have been developed. In the third part, the performance of students working in the open learning environment is compared to the performance of students handing in pen-andpaper homework. A repeated randomized crossover trial was conducted where students were given unexpected tests in class after working in the tutor-web or handing in traditional homework. A significant difference in learning between web-based homework (WBH) and pen-and-paper homework (PPH) was detected, supporting the use of WBH as a learning tool.
iii
iv
Ágrip Efnistökum ritgerðarinnar má skipta í þrjá hluta. Í fyrsta hluta er rannsókn á gengi nýnema á Verkfræði- og náttúruvísindasviði, Háskóla Íslands, á könnunarprófi í stærðfræði lýst. Sama prófið var lagt fyrir nýnema í upphafi misseris á árunum 2011-2014. Niðurstöður gefa til kynna að hátt hlutfall nemenda skortir grunnfærni í stærðfræði. Fervikagreining var notuð til að kanna hvaða breytur tengjast árangri nemenda á könnunarprófinu. Framhaldsskóli, kyn, ár könnunarprófs, hvenær nemendur voru síðast í stærðfræði í framhaldsskóla og hversu margar annir þeir höfðu verið í stærðfræði í framhaldsskóla, tengdust árangri á könnunarprófinu. Upplifun þeirra á hversu vel þeim gekk í stærðfræði í framhaldsskóla og hversu vel þeir eru undirbúnir undir frekara nám tengdust einnig árangri. Árangur á könnunarprófinu hafði hátt forspárgildi fyrir árangur nemenda í námskeiðum í stærðfræðigreiningu, sér í lagi meðal stærðfræði- eðlisfræðiog verkfræðinema. Í öðrum hluta er þróun á opnu vefkennslukerfi í stærðfræði og tölfræði lýst. Kennslukerfið tutor-web er opið vefkennslukerfi sem þróað hefur verið við Háskóla Íslands. Í kerfinu er kennsluefni í stærðfræði, tölfræði og fleiri greinum aðgengilegt nemendum að kostnaðarlausu. Í kerfinu eru nú yfir 4000 æfingar í stærðfræði og tölfræði sem nemendur geta nýtt sér. Algrím sem úthlutar spurningum til nemenda ásamt einkunnaralgrími hafa verið þróuð með það að markmiði að auka kunnáttu nemenda sem nota kerfið. Í þriðja hluta má lesa um samanburðarrannsókn á lærdómi nemenda sem vinna í vefkennslukerfinu og þeirra sem vinna hefðbundna heimavinnu í formi dæmaskila. Nemendur stóðu sig að meðaltali betur á prófunum eftir að hafa unnið í vefkennslukerfinu en þegar þeir skiluðu skriflegum verkefnum.
v
vi
Contents Abstract
iii
Ágrip
v
List of Figures
xi
List of Tables
xiv
Acronyms
xix
List of Publications
xxi
Acknowledgements
xxiv
I
Thesis
1
1 Introduction
3
2 Background
5
2.1
Mathematics skills of university entrants . . . . . . . . . . . . . .
5
2.2
Educational systems . . . . . . . . . . . . . . . . . . . . . . . . .
6
2.3
Item allocation in educational systems . . . . . . . . . . . . . . .
8
2.4
Comparison of web-based and pen-and-paper homework . . . . .
9
3 Aim
11
4 The tutor-web
13
4.1
Short history of the tutor-web system . . . . . . . . . . . . . . .
13
4.2
Educational content structure . . . . . . . . . . . . . . . . . . . .
15
vii
4.3
Item allocation algorithms . . . . . . . . . . . . . . . . . . . . . .
16
4.4
Grading . . . . . . . . . . . . . . . . . . . . . . . . . . . . . . . .
19
4.5
Feedback . . . . . . . . . . . . . . . . . . . . . . . . . . . . . . .
22
4.6
Timeout . . . . . . . . . . . . . . . . . . . . . . . . . . . . . . . .
22
4.7
Parametrization of system components . . . . . . . . . . . . . . .
25
4.8
Summary of changes in the tutor-web . . . . . . . . . . . . . . .
27
5 Materials and methods 5.1
5.2
29
Diagnostic test of basic mathematical skills . . . . . . . . . . . .
30
5.1.1
Participants . . . . . . . . . . . . . . . . . . . . . . . . . .
30
5.1.2
Materials . . . . . . . . . . . . . . . . . . . . . . . . . . .
32
5.1.3
Methods . . . . . . . . . . . . . . . . . . . . . . . . . . . .
Comparison of learning among students doing WBH and PPH
34
.
35
Participants . . . . . . . . . . . . . . . . . . . . . . . . . .
35
5.3
Materials . . . . . . . . . . . . . . . . . . . . . . . . . . . . . . .
36
5.4
Methods . . . . . . . . . . . . . . . . . . . . . . . . . . . . . . . .
38
5.2.1
6 Results
39
6.1
Diagnostic test of basic mathematical skills . . . . . . . . . . . .
39
6.1.1
Summary statistics . . . . . . . . . . . . . . . . . . . . . .
40
6.1.2
Models of grades . . . . . . . . . . . . . . . . . . . . . . .
41
6.1.3
Predictability of the diagnostic test . . . . . . . . . . . . .
42
6.2
Comparison of learning among students doing WBH and PPH
.
46
6.2.1
Modelling of exam scores . . . . . . . . . . . . . . . . . .
46
6.2.2
Student survey . . . . . . . . . . . . . . . . . . . . . . . .
48
7 Conclusions and future perspective
49
II
59
I
Papers The performance of first year students in the University of Iceland on a diagnostic test of basic mathematical skills
61
I.1
I.2
Introduction . . . . . . . . . . . . . . . . . . . . . . . . . . . . . .
62
I.1.1
Diagnostic tests and transition issues . . . . . . . . . . . .
62
I.1.2
The Icelandic school system . . . . . . . . . . . . . . . . .
64
Methodology . . . . . . . . . . . . . . . . . . . . . . . . . . . . .
64
I.2.1
Participants . . . . . . . . . . . . . . . . . . . . . . . . . .
64
I.2.2
Materials . . . . . . . . . . . . . . . . . . . . . . . . . . .
66
viii
I.2.3 I.3
I.4
Methods . . . . . . . . . . . . . . . . . . . . . . . . . . . .
67
Results . . . . . . . . . . . . . . . . . . . . . . . . . . . . . . . . .
68
I.3.1
The students’ background . . . . . . . . . . . . . . . . . .
68
I.3.2
Summary statistics of grades . . . . . . . . . . . . . . . .
69
I.3.3
Modelling of grades . . . . . . . . . . . . . . . . . . . . .
73
I.3.4
Prediction of performance in calculus courses . . . . . . .
73
Discussion and conclusions . . . . . . . . . . . . . . . . . . . . . .
75
II From evaluation to learning: Some aspects of designing a cyberuniversity
81
II.1 Background . . . . . . . . . . . . . . . . . . . . . . . . . . . . . .
83
II.1.1 The tutor-web project . . . . . . . . . . . . . . . . . . . .
83
II.1.2 Computerized adaptive testing . . . . . . . . . . . . . . .
84
II.2 The tutor-web . . . . . . . . . . . . . . . . . . . . . . . . . . . . .
85
II.3 Some system design considerations . . . . . . . . . . . . . . . . .
87
II.3.1 Item allocation . . . . . . . . . . . . . . . . . . . . . . . .
87
II.3.2 Item database design . . . . . . . . . . . . . . . . . . . . .
88
II.3.3 Grading and other issues
. . . . . . . . . . . . . . . . . .
88
II.4 Case studies . . . . . . . . . . . . . . . . . . . . . . . . . . . . . .
88
II.5 Analyses and results . . . . . . . . . . . . . . . . . . . . . . . . .
90
II.5.1 Some experimental results . . . . . . . . . . . . . . . . . .
90
II.5.2 Model results . . . . . . . . . . . . . . . . . . . . . . . . .
91
II.6 Discussion . . . . . . . . . . . . . . . . . . . . . . . . . . . . . . .
92
II.6.1 Item allocation . . . . . . . . . . . . . . . . . . . . . . . .
92
II.6.2 Item database design . . . . . . . . . . . . . . . . . . . . .
93
II.6.3 Grading and other issues
. . . . . . . . . . . . . . . . . .
93
II.7 Summary . . . . . . . . . . . . . . . . . . . . . . . . . . . . . . .
94
III Development and use of an adaptive learning environment to research online study behaviour
97
III.1 Introduction . . . . . . . . . . . . . . . . . . . . . . . . . . . . . .
98
III.2 Item allocation in educational systems . . . . . . . . . . . . . . . 100 III.3 System Description . . . . . . . . . . . . . . . . . . . . . . . . . . 101 III.3.1 Content Structure . . . . . . . . . . . . . . . . . . . . . . 102 III.3.2 Drills and item selection . . . . . . . . . . . . . . . . . . . 104 III.3.3 Grading . . . . . . . . . . . . . . . . . . . . . . . . . . . . 105 III.3.4 Users and access . . . . . . . . . . . . . . . . . . . . . . . 105 ix
III.3.5 Viewing and adding material . . . . . . . . . . . . . . . . 106 III.4 Case study . . . . . . . . . . . . . . . . . . . . . . . . . . . . . . 109 III.4.1 Finding the drivers . . . . . . . . . . . . . . . . . . . . . . 109 III.5 Conclusions and future work
. . . . . . . . . . . . . . . . . . . . 113
IV Difference in learning among students doing pen-and-paper homework compared to web-based homework
117
IV.1 Introduction . . . . . . . . . . . . . . . . . . . . . . . . . . . . . . 119 IV.1.1 Web-based learning environments . . . . . . . . . . . . . . 120 IV.1.2 Web-based homework vs. pen-and-paper homework . . . 121 IV.1.3 Assessment and feedback . . . . . . . . . . . . . . . . . . 122 IV.1.4 The tutor-web . . . . . . . . . . . . . . . . . . . . . . . . 122 IV.2 Material and methods . . . . . . . . . . . . . . . . . . . . . . . . 127 IV.3 Results . . . . . . . . . . . . . . . . . . . . . . . . . . . . . . . . . 129 IV.3.1 Analysis of exam scores . . . . . . . . . . . . . . . . . . . 129 IV.3.2 Analysis of student surveys . . . . . . . . . . . . . . . . . 131 IV.4 Conclusion and future work . . . . . . . . . . . . . . . . . . . . . 132 IV.4.1 Quality of items and feedback . . . . . . . . . . . . . . . . 132 IV.4.2 Grading scheme . . . . . . . . . . . . . . . . . . . . . . . . 133 IV.4.3 Item allocation algorithm . . . . . . . . . . . . . . . . . . 135
x
List of Figures 4.1
The welcoming screen of the tutor-web. Departments can be chosen from the panel to the left. . . . . . . . . . . . . . . . . . .
4.2
14
The structure of the tutor-web. Lectures, which are collections of slides, form tutorials. A tutorial can belong to more than one course. An item bank (collection of quiz questions) belongs to every lecture. . . . . . . . . . . . . . . . . . . . . . . . . . . . . .
4.3
15
The different probability mass functions used in the item allocation algorithm. The uniform PMF was used before 2012, the exponential PMF in 2012 and the beta PMF from 2013. . . . . .
4.4
18
The weight function for a student who has answered 30 items for different values of the parameters. Left: α = 0.15, s = 1, ng = 15. Right: α = 0.10, s = 2, ng = 30. α controls the weight on the most recent answered item, s is the functional form for 1 ≤ l ≤ ng where l is the lag. As can be seen, newly answered items get more weight than older ones. . . . . . . . . . . . . . . . . . . . . . . . .
4.5
21
A question from a lecture on inferences for proportions. After answering the item the students is informed which of the answers it the correct one (KCR-type feedback) and shown an explanation of the correct answer (EF-type feedback). . . . . . . . . . . . . .
4.6
23
The timeout function with tmax = 10, tmin = 2 gtmin = 5 and std = 1. tmax is the maximum time allocated, tmin the minimum time, gtmin is the grade at which minimum time is allocated and std controls the spread of the dome. . . . . . . . . . . . . . . . .
4.7
24
The effects on the relationship between tutor-web grades and final exam grades of changing the GS and adding the timeout feature. . . . . . . . . . . . . . . . . . . . . . . . . . . . . . . . . xi
25
4.8
The parameter vector. The parameter values control the shape of the timeout function, the weights in the grading scheme and the settings of the item allocation algorithm. . . . . . . . . . . .
5.1
Answers to background questions by course. A similar pattern can be seen in all of the background variables.
5.2
. . . . . . . . . .
33
The design of the repeated randomized crossover experiment. The experiment was repeated four times from 2011-2014.
6.1
26
. . . .
37
Mean grades with standard errors between 2011 and 2014, categorized by course. The grades in Calculus A and B did not change much during the four years but a noticeable drop in mean grades can be seen in Calculus C in 2013. . . . . . . . . . . . . . . . . .
6.2
40
Mean grades between 2011 and 2014 categorized by topic. The students scored on average the highest in Arithmetic and functions and lowest in Differentiation and integration. . . . . . . . .
6.3
Results from the student survey. Left: "Do you learn from the tutor-web?". Right: "What is you preference for homework"? . .
7.1
41 48
With some probability students are asked to make their own items. When they start writing their questions, answers and explanations, the example text (light grey) disappears. This template is taken from the elementary statistics course. . . . . . . . .
53
7.2
A standard drilling exercise. . . . . . . . . . . . . . . . . . . . . .
55
7.3
An item designed to enhance the understanding of students of the unit circle. . . . . . . . . . . . . . . . . . . . . . . . . . . . .
7.4
56
A student working in the tutor-web in a computer lab at the University of Maseno . . . . . . . . . . . . . . . . . . . . . . . . .
57
I.1
Answers to background questions by course. . . . . . . . . . . . .
70
I.2
Boxplot of grades, categorized by course. . . . . . . . . . . . . . .
71
I.3
Mean grades with standard errors between 2011 and 2014, cate-
I.4
gorized by course. . . . . . . . . . . . . . . . . . . . . . . . . . . .
71
Mean grades between 2011 and 2014, categorized by topic. . . . .
72
II.1 The three-parameter logistic model with varying a, b = 0.3 and c = 0.2 . . . . . . . . . . . . . . . . . . . . . . . . . . . . . . . . .
84
II.2 The tutor-web main page. . . . . . . . . . . . . . . . . . . . . . .
85
xii
II.3 Possible development of a pmf for questions as grade develops. .
88
II.4 Grade development based on averages across 162 students in an introductory statistics course. . . . . . . . . . . . . . . . . . . . .
91
II.5 Top panels: Model predictions of average grade as a function of (a) the number of times a question is seen and (b) the total number of answers given. Bottom panels: (c) expected grade as a function of ability and (d) expected grade as a function of ability, for different numbers of attempts at the question. The density shown in the lower panels indicates the distributions of estimated student ability. . . . . . . . . . . . . . . . . . . . . . .
92
III.1 The structure of the tutor-web. . . . . . . . . . . . . . . . . . . . 103 III.2 Probability mass functions for item allocation in a lecture with 100 questions. . . . . . . . . . . . . . . . . . . . . . . . . . . . . . 105 III.3 Different views into the database of teaching material in the tutor-web. . . . . . . . . . . . . . . . . . . . . . . . . . . . . . . . 106 III.4 Explanation of the correct answer is given after the student answers a question. . . . . . . . . . . . . . . . . . . . . . . . . . . . 108 III.5 Cumulative distribution (%) of the total number of attempts by each student at each lecture. The right panel expands by only considering attempts 1-25. A vertical bar indicates 8 attempts. By far most students (96 %) stop before 50 attempts. . . . . . . 110 IV.1 The different probability mass functions used in the item allocation algorithm. Left: uniform. Middle: exponential. Right: beta. . . . . . . . . . . . . . . . . . . . . . . . . . . . . . . . . . . 125 IV.2 A question from a lecture on inferences for proportions. The students are informed what the correct answer is and shown an explanation of the correct answer.
. . . . . . . . . . . . . . . . . 126
IV.3 The design of the experiment. The experiment was repeated four times from 2011-2014. . . . . . . . . . . . . . . . . . . . . . . . . 127 IV.4 Results from the student survey. Left: "Do you learn from the tutor-web?". Right: "What is you preference for homework"? . . 131 IV.5 The weight function for a student that has answered 30 items for different values of the parameters. Left: α = 0.15, s = 1, ng = 15. Right: α = 0.10, s = 2, ng = 30. . . . . . . . . . . . . . . . . . . . 134
xiii
xiv
List of Tables 4.1
Stopping percentage (%) as a function of the number of correct answers in the last 8 questions. The percentage is by far the highest after eight correct answers in the last eight questions. . .
4.2
19
Fraction of stopping (%) as a function whether the last question was answered correctly (0) or not (1) and the number of correct answers in the last eight questions. Each number in the table is the percentage of lines when a response within one of the cells was also the last response. . . . . . . . . . . . . . . . . . . . . . .
4.3
20
Summary of changes made in the tutor-web between 2011 and 2014. Changes have been made to the item allocation algorithm, the grading scheme, the type of feedback provided and the timeout function. . . . . . . . . . . . . . . . . . . . . . . . . . . . . .
5.1
28
Number of students taking the test along with gender proportions. f - females, m - males. Less than 1/3 of the students in Calculus A and B were females while the gender proportions were almost equal in Calculus C. . . . . . . . . . . . . . . . . . .
31
5.2
Number of students taking the tests. . . . . . . . . . . . . . . . .
37
6.1
ANOVA table for the final model. . . . . . . . . . . . . . . . . . .
42
6.2
Population marginal means. Only the highest (S1 and S2) and the lowest (S25 and S26) schools are shown. "Do?" represents the responses to "I did well in mathematics in secondary school" and "Prepared?" the responses to "I am well prepared for studying mathematics at university level" . . . . . . . . . . . . . . . . . .
6.3
43
Classification of students according to performance on diagnostic test (rows) and final exams (columns). The fractions are calculated with respect to performance on final exams. . . . . . . . . . xv
43
6.4
Estimated odd ratios from the model in equation 6.2. The reference are male students in Calculus A, graduating from the school with the lowest performing students responding "I disagree/I strongly disagree" to the statements "I did well in math" and "I am well prepared".
6.5
. . . . . . . . . . . . . . . . . . . . .
Classification according to the model in equation 6.2 using a 50% cutoff. . . . . . . . . . . . . . . . . . . . . . . . . . . . . . . . . .
6.6
45
45
Parameter estimates for the final model used to answer research question 1. The reference group are students in the 2011 course with weak math background handing in PPH on discrete distributions. . . . . . . . . . . . . . . . . . . . . . . . . . . . . . . . .
6.7
47
Parameter estimates for the final model used to answer research question 2. The reference group (included in the intercept) are students with weak math background handing in PPH on discrete distributions. . . . . . . . . . . . . . . . . . . . . . . . . . . . . .
I.1
Subjects belonging to the three calculus courses. Students in subjects marked with * can choose between two courses. . . . . .
I.2
I.3 I.4
47
65
Number of students taking the test along with gender proportions. f - females, m - males. . . . . . . . . . . . . . . . . . . . .
65
ANOVA table for the final model. . . . . . . . . . . . . . . . . . .
74
Population marginal means. Only the highest (S1 and S2) and the lowest (S25 and S26) schools are shown. "Do?" represents the responses to "I did well in mathematics in secondary school" and "Prepared?" the responses to "I am well prepared for studying mathematics at university level" . . . . . . . . . . . . . . . . . .
I.5
74
Classification of students according to performance on diagnostic test (rows) and final exams (columns). The fractions are calculated with respect to performance on final exams. . . . . . . . . .
75
III.1 Stopping percentage (%) as a function of the number of correct answers in the last 8 questions. . . . . . . . . . . . . . . . . . . . 110 III.2 Classification of answers according to whether the last question was answered correctly (1) of not (0) and whether the student continued or stopped. . . . . . . . . . . . . . . . . . . . . . . . . 111 xvi
III.3 Fraction of stopping (%) as a function whether the last question was answered correctly (0) or not (1) and the number of correct answers in the last eight questions. Each number in the table is the percentage of lines when a response within on of the cells was also the last response. . . . . . . . . . . . . . . . . . . . . . . . . 111 III.4 Parameter estimates where the 0/1 indicator of whether the student stopped is “regressed” against the grade at that timepoint. . 112 III.5 Parameter estimates where the 0/1 indicator of whether the student stopped is “regressed” against the grade at that timepoint, grade of last answer, item difficulty and number of items answered.113 IV.1 Summary of changes in the tutor-web. . . . . . . . . . . . . . . . 127 IV.2 Number of students taking the tests. . . . . . . . . . . . . . . . . 128 IV.3 Parameter estimates for the final model used to answer research question 1. The reference group are students in the 2011 course with weak math background handing in PPH on discrete distributions. . . . . . . . . . . . . . . . . . . . . . . . . . . . . . . . . 130 IV.4 Parameter estimates for the final model used to answer research question 2. The reference group (included in the intercept) are students with weak math background handing in PPH on discrete distributions. . . . . . . . . . . . . . . . . . . . . . . . . . . . . . 131
xvii
xviii
Acronyms 3PL Three parameter logistic model. AIS Adaptive item sequencing. AIWBES Adaptive and intelligent web-based educational systems. ANOVA Analysis of variance. CALC12-CALC14 Introductory course in calculus taught by Gunnar Stefansson in 2012-2014. CAT Computerized adaptive testing. EF Elaborated feedback. FA Formative assessment. GS Grading scheme. IAA Item allocation algorithm. IME Icelandic matriculation examination. IRT Item response theory. KCR Knowledge of correct response. KCSE Kenya Certificate of Secondary Education. KR Knowledge of results. LCMS Learning content management system. xix
LMS Learning management system. PFI Point fisher information. PMF Probability mass function. PPH Pen-and-paper homework. SA Summative assessment. SENS School of engineering and natural sciences. STAT11-STAT14 Introductory course in statistics taught by Anna Helga Jónsdóttir in 2011-2014. STEM Science, technology, engineering and mathematics. UI University of Iceland. WBH Web-based homework.
xx
List of Publications This thesis is based on the following papers, which will be referred to in the text by their Roman numbers. I. Jonsdottir, A.H., Hreinsdottir, F., Geirsdottir, G., Moller, R.G. & Stefansson, G. (2015). The performance of first year students at the University of Iceland on a diagnostic test of basic mathematical skills. Submitted to the Journal of Scandinavian Educational Research. II. Jonsdottir, A.H. & Stefansson, G. (2014). From evaluation to learning: Some aspects of designing a cyber-university. Computers & Education, 78, 344–351. III. Jonsdottir, A.H., Jakobsdottir, A. & Stefansson, G. (2015). Development and Use of an Adaptive Learning Environment to Research Online Study Behaviour. Educational Technology & Society, 18 (1), 132–144. IV. Jonsdottir, A.H., Bjornsdottir, A. & Stefansson, G. (2015). Difference in learning among students doing pen-and-paper homework compared to web-based homework. Submitted to the International Journal of Mathematical Education in Science and Technology.
xxi
xxii
Acknowledgements First of all I would like to thank my principal advisor, professor Gunnar Stefánsson, for his support, encouragement and endless kindness and patience; you have been the best advisor one can imagine and for that I am extremely grateful. I am also very grateful to my doctoral committee, Freyja Hreinsdóttir and Auðbjörg Björnsdóttir for their guidance and support as well as my other coauthors, Auðbjörg Jakobsdóttir, Guðrún Geirsdóttir and Rögnvaldur G. Möller. I would further like to thank all the wonderful people that have contributed to the tutor-web project in some way, in particular Anna Hera, Ásta Kristjana, Eva and Magnea. Last but not least of the tutor-web team I would like to thank computer scientists Jamie Lentin - he can do wonders with his keyboard. I want to thank my mother, Guðrún Helga, and my father, Jón, for being the best parents in the whole world. I would also like to thank my favourite family in the world: my sister Ingunn, her husband Árni and their daughters Guðrún Helga and Ingibjörg for being as wonderful as they are. I would especially want to thank Amma Helga who promised me some years ago that see was going to live to see me become Dr. Jónsdóttir, she is now 91 years old. Further I would like to thank all my wonderful frænkur and frændur for all their support throughout the years. My boyfriend (and hopefully soon my husband, huhuumm), Baldur, I would like to thank for his endless kindness, support, patience and love; meeting you was the best thing that has happened to me. Not only did I get the best boyfriend in the world I got the best in-laws, Hilda and Héðinn, as well. I would like to thank the fantastic staff at the School of Engineering and Natural Sciences for all their support and for making SENS such a wonderful workplace. I would especially like to thank Sigdís Ágústsdóttir and Guðrún Helga Agnarsdóttir (whom I have already thanked for other reasons above) for their help on collecting data to use in my research as well as Christopher xxiii
Desjardins for being an amazzzing colleague. All the people in the mathematics group I would like to thank for their support and again I want to mention my co-author Rögnvaldur G. Möller and thank him especially for his limitless kindness and support. Kristján Jónasson and the other members of Bjórbandið I would like to thank for fantastic times playing our instruments together in the last months writing this thesis. I would also like to thank the wonderful people I met in my visit to Maseno, Kenya, especially David Stern, Giovanna De Giusti and Ruth Lydia Nyamaka; you have all been a great inspiration to me. Next I would like to thank my fellow graduate students in Kontorinn: Bjarki, Chamari, Chrisphine, Erla, Gunnar Geir, Helga and Warsha and a very special thank to a fellow graduate student, college and a dear friend Sigrún Helga; I would never have made it here without your support and our good times in Tæknigarður. All my other dear friends I would like to thank, in particular my wonderful friends that I have known since we were children Birna, Björg Rún, Elísabet, Guðrún Erla, Katrín Ósk, Kristín and Þorgerður; thank you so much for our wonderful friendship and support throughout the years. Last but definitely not least I would like to thank my dear friend and sálufélagi Íris; how extremely lucky I was to meet you outside Letigarður a "few" years ago. This work was supported by the University of Iceland Research Fund for doctoral studies and with a teaching assisting grant from the University of Iceland.
xxiv
Part I
Thesis
1 Introduction Around the year 2000, Prof. Gunnar Stefansson started working on a webbased learning environment he named the tutor-web. Now, in 2015, numerous learning environments are available but back in 2000 options were limited. The main goal was to implement a system that was free to use, available to everyone having access to the web and to provide its users with quality educational material. In the beginning the focus was on low income areas, specially rural Africa, but after some research into mathematical proficiency of first year students at the University of Iceland it was decided to also include teaching material in Icelandic and target secondary school students in Iceland as well. Cooperation was established with researchers and lectures in the University of Maseno, Kenya. This cooperation was sealed with a truly inspirational visit to Maseno in 2012. The thesis is based on the four papers listed on page xxi. The work done can roughly be split up into three tasks or categories: 1. Investigation into mathematical skills of first year students in the School of Engineering and Natural Sciences (SENS), University of Iceland (UI) (Paper I). 2. Implementation of algorithms in an open learning environment in order to investigate the behaviour of students working in such systems (Paper II, III and IV). 3. Comparing learning among students using the tutor-web system for homework and students doing traditional pen-and-paper homework (Paper IV).
3
4
Chapter 1
Introduction
The thesis consists of two parts: an introduction and summary of the four papers (Part I) followed by the papers as published in four different journals, with minor editorial changes (Part II). Part I consists of 7 chapters including this introduction. In Chapter 2, a summary of the literature review provided in the four papers is given. A short review of research into mathematical skills of university entrants is given in Section 2.1, an overview of available educational systems and how questions are allocated to students in Section 2.2 and 2.3 and finally an overview of research into learning of students using on-line educational systems (Section 2.4). More detailed reviews can be found in the four papers. The major objectives of the work described in this thesis are then listed in Chapter 3 followed by an explanation of the functionalities and development of the tutor-web system in Chapter 4. To address research questions related to categories 1 and 3 above, stated in Chapter 3, an observational study as well as a controlled experiment were conducted during the course of this work. Materials and methods used are described in Chapter 5 and main results are summarised in Chapter 6. Finally conclusions and reflections regarding future work are given in Chapter 7.
2 Background This chapter contains a summary of the literature review provided in the four papers. These include research into mathematical skills of university students (Section 2.1), an overview of some educational systems available (Section 2.2), a description of how questions are allocated to students in educational systems (Section 2.3) and finally, research into learning among students doing traditional pen-and-paper homework compared to web-based homework (Section 2.4).
2.1
Mathematics skills of university entrants
Poor mathematical skills of students entering university to study science, technology, engineering, mathematics (STEM) and other disciplines in which mathematical skills are needed is often referred to as The Mathematics Problem in the literature (Rylands & Coady, 2009). Studies into this phenomenon have been conducted throughout the world. In England, researchers showed evidence of a decline in mathematical skills of first year students in Coventry University between 1991 and 1995 (Hunt & Lawson, 1996). The same trend was seen in a study performed between 1998 and 2008 at the University of Limerick, Ireland (Gill, O’Donoghue, Faulkner, & Hannigan, 2010). Dutch universities have also observed that mathematical abilities of incoming students have dropped in recent years (Heck & Van Gastel, 2006). The Mathematics Problem has also been addressed in studies from Sweden (Brandell, Hemmi, & Thunberg, 2008), Canada (Kajander & Lovric, 2005), New Zealand (James, Montelle, & Williams, 2008) and Australia (Wilson & MacGillivray, 2007). 5
6
Chapter 2
Background
The changing profile of the student group enrolled in STEM education has been named as one of the reasons for poor performance of first year students in mathematics courses (Kajander & Lovric, 2005; Mustoe, 2002; Northedge, 2003; Seymour, 2001). Others have proposed that the root of The Mathematics Problem is due to the failure of many students to make the transition from secondary school to tertiary mathematics (Anthony, 2000; Hourigan & O’Donoghue, 2007). This transition often presents major difficulties whether students are specializing in mathematics or are registered in a program for which mathematics is a service subject. According to De Guzmán, Hodgson, Robert, and Villani (1998) one of the issues the students face is a significant shift in the kind of mathematics to be mastered with increasing focus on depth, both with respect to the technical abilities needed and to the conceptual understanding underlying them. This transition process to advanced mathematical thinking is experienced as traumatic by many students (Engelbrecht, 2010). In Kenya, students need to take a national exam in mathematics before entering university, the Kenya Certificate of Secondary Education (KCSE). In general, student do poorly on the test and research has shown that mainly students from schools with good educational facilities perform well on the test (Nyingi Githua & Gowland Mwangi, 2003). Also, interviews with teachers at the University of Maseno, Kenya, confirm that The Mathematics Problem is indeed a reality in Kenya. In addition to the problems facing mathematics education named above, students in rural Africa have very limited access to educational material and well-trained teachers, which makes dealing with The Mathematics Problem even more challenging in these areas. Prior to the study described in this thesis research into mathematical skills of first year university students in Iceland was absent. Secondary school attendance ends with the Icelandic matriculation examination (IME). The IMEs are not standardized and the execution can be quite different between schools making it impossible to use their results to assess the magnitude of The Mathematics Problem in Iceland.
2.2
Educational systems
For the past several years the number of on-line learning environments has exploded. Several new concepts and types of systems have emerged including the learning management system (LMS), learning content management system (LCMS) and adaptive and intelligent web-based educational systems (AI-
2.2 Educational systems
7
WBES). The LMS is mainly designed for planning, delivering and managing learning events, usually adding little value to the learning process nor supporting internal content processes (Ismail, 2001) while the primary role of a LCMS is to provide a collaborative authoring environment for creating and maintaining learning content (Ismail, 2001).
Examples of LMS and LCMS in-
clude Moodle (http://moodle.org), BlackBoard (http://blackboard.com), ATutor (http://atutor.ca/), ILIAS (http://ilias.de), Clairoline (http:// www.claroline.net/) and Sakai CLE (http://sakaiproject.org/). These can be used for administration of students and courses, creation and/or storing educational content, assessment and more. Classes taught on these platforms are accessible through a web-browser but are usually private, i.e. only registered individuals have access to the password-protected website. Of these, open-source Moodle is particularly widely used1 . In addition to the systems named above a number of content providers can be found on the web such as Khan Academy (http://www.khanacademy.org/) and Connexions (http://cnx.org/). A number of academic institutions have also made educational material available, including MIT OpenCourseWare (http:// ocw.mit.edu) and Stanford Engineering Everywhere (http://see.stanford .edu/). Several systems are also available that provide content in the form of quiz questions and homework problems. An example of a system that is accessible to all and provides homework problems is the WeBWork system (Gage, Pizer, & Roth, 2001) for math and science courses including the National Problem Library, ASSiSTments (Razzaq et al., 2005), the LON-CAPA system (Kortemeyer, Kashy, Benenson, & Bauer, 2008), WebAssign in math and science, QuizJet (Hsiao, Brusilovsky, & Sosnovsky, 2008) in the Java Programming Language, the Mallard system (Graham, Swafford, & Brown, 1997) and QuizPACK (Pathak & Brusilovsky, 2002) for programming-related courses. Many available systems are merely a network of static hypertext pages (Brusilovsky, 1999) but AIWBES use a model of each student to adapt to the needs of that student (Brusilovsky & Peylo, 2003). Because of the structural complexity of these systems they generally do not provide a broad range of content and are often within computer science. Examples of AIWBES systems used in computer science education are SQL-Tutor (Mitrovic, 2003), ALEA (Bieliková, 2006), QuizGuide (Brusilovsky & Sosnovsky, 2005; Brusilovsky, Sosnovsky, & Shcherbinina, 2004) and Flip (Barla et al., 2010) which includes an 1 see
e.g. https://moodle.net/stats/
8
Chapter 2
Background
interesting way of allocating quiz questions to students (discussed further in the following section). The goal of the tutor-web project is to implement an AIWBES with the functionalities of a LCMS. In contrast to many LCMS systems, the system is open to everyone having access to the web and has the ability to provide broad educational content, including interactive exercises, with the primary purpose of enhancing learning. The majority of the systems named above permit creation of quiz questions and administration of quizzes for evaluation or to enhance learning. In most systems these quizzes are static, that is, the instructor has chosen a fixed set of exercises to be given to the students. In some cases exercises are selected randomly from an available question pool so that students are not all presented with the same set of questions. Instead of allocating exercises to students in this static manner, intelligent methods are used for item allocation in the tutor-web. Methods for allocating exercises to learners are discussed in the next session.
2.3
Item allocation in educational systems
In the following, the terms exercise, problem and item are used interchangeably. The term item bank will be used to refer to collection of items. A number of educational web-based systems use intelligent methods for estimating learner’s knowledge in order to provide personalized content or navigation (Barla et al., 2010) but only a few systems use intelligent methods for item allocation, often referred to as adaptive item sequencing (AIS). Even though AIS is not commonly used in educational systems it has been used in computerized adaptive testing (CAT) for decades (Wainer, 2000). CAT is a form of computer-based test where the test is tailored to the examinee’s ability level by means of item response theory (IRT), see Lord (1980). IRT is the framework used in psychometrics for the design, analysis, and grading of computerized tests to measure abilities. Within the IRT framework, several models have been proposed for expressing the probability of observing a particular response to an item as a function of some characteristic of the item and the ability of the student, the Rasch model being a common one (Wright, 1977). Another, slightly more complicated model, is the three parameter logistic model, or the
2.4 Comparison of web-based and pen-and-paper homework
9
3PL model, which can be written as Psi = P (Ysi = 1|θs ; ai , bi , ci ) = ci +
(1 − ci ) 1 + exp{−ai (θs − bi )}
(2.1)
where Ysi is the 0/1 response of the s-th student to the the i-th item, θs is the ability of the s-th student and bi is the difficulty parameter of the i-th question which sets the location of the curve. ai is the discrimination parameter, which is a measure of how effective an item is at discriminating between students at different ability levels and finally, ci , the guessing parameter that measures how likely it is to obtain the correct answer by guessing. The point Fisher information (PFI) is then used to select the most informative item in the pool, i.e. the item which minimises the variance in the ability estimate. An example of a system using this technique is the SIETTE system (Conejo et al., 2004), which is a web-based testing system, i.e. not used for learning purposes. A review of the available literature found only one system using IRT for AIS with the main focus on enhancing learning namely the web-based programming learning system Flip (Barla et al., 2010). Experiments using the system resulted in remarkable improvements in test results compared to the previous year where the only difference was the use of the Flip system (Barla et al., 2010). Using the IRT framework for AIS is presumably an improvement from administrating a fixed set of questions to all students (as is often the case) since the items selected are tailored to the examinee’s ability level. However, the IRT framework was developed with the purpose of testing where the major objective is to estimate the examinee’s ability level. In a learning environment, this is not necessarily the case since the major objective is to maximise learning.
2.4
Comparison of web-based and pen-and-paper homework
The use of web-based learning environments has increased a great deal over the past several years. It is therefore of importance to investigate how learning among students doing web-based homework (WBH) compares to learning among students doing more traditional pen-and-paper homework (PPH). A number of studies have been conducted to investigate this and in majority of the studies reviewed, no significant difference was detected (Bonham, Deardorff, & Beichner, 2003; Cole & Todd, 2003; Demirci, 2007; Gok, 2011;
10
Chapter 2
Background
Kodippili & Senaratne, 2008; LaRose, 2010; Lenz, 2010; Palocsay & Stevens, 2008; A. Williams, 2012). In three of the studies reviewed, WBH was found to be more efficient than PPH as measured by final exam scores (Brewer & Becker, 2010; Dufresne, Mestre, Hart, & Rath, 2002; VanLehn et al., 2005). Even though most of the studies performed comparing WBH and PPH show no difference in learning, the fact that students do not do worse than students doing PPH makes WBH a favourable option, specially in large classes where correcting PPH is very time consuming. Also, students’ perception towards WBH has been shown to be generally positive (Demirci, 2007; Hauk & Segalla, 2005; Hodge, Richardson, & York, 2009; LaRose, 2010; Roth, Ivanchenko, & Record, 2008; Smolira, 2008; VanLehn et al., 2005). All the studies reviewed were conducted using only quasi-experimental designs, i.e. students were not randomly assigned to the treatment groups. Either multiple sections of the same course were tested where some sections did PPH while the other(s) did WBH or the two treatments were assigned on different semesters. This could lead to some bias. The experiment conducted in relation to this project is, however, a repeated randomized crossover experiment so the same students were exposed to both WBH and PPH, resulting in a more accurate estimate of the potential difference between the two methods.
3 Aim In the beginning of this PhD project a preliminary version of the tutor-web system was available. One of the objectives of the project was to conduct research on the behaviour of students doing online exercises. In order to do so, implementation of several new features in the tutor-web system was necessary, especially with respect to how items are allocated to students and how students are graded in the system. Testing the system in real classrooms was also a major part of the project including comparing learning among students working in the system to learning among students doing more traditional pen-and-paper work. In 2008 Prof. Rögnvaldur G. Möller started conducting diagnostic tests in order to investigate mathematical skills of first year students at the University of Iceland. His work was continued within this project by carrying forward the administration of the test and by gathering background information about the students in order to investigate possible links between performance and background variables. The aims of the project can be summarized in the following research questions: 1. How well are first year students at the School of Engineering and Natural Sciences, University of Iceland, prepared for studying mathematics and mathematics related subjects? 2. Have changes made in the tutor-web system had an impact on learning as measured by test performance? 3. Is there a difference in learning, as measured by test performance, between students doing web-based homework and pen-and-paper homework? 11
12
Chapter 3
Aim
The first question is addressed in Paper I where a study performed in 2011-2014 including over 1800 university entrants is described. The other two questions are the subjects of Paper IV which describes a repeated randomized crossover experiment conducted in 2011-2014 including several hundred university students. In addition to the above research questions issues regarding the following additional questions are presented and discussed in Paper II, III and IV. 4. How should items be allocated to students in learning environments where the focus is on learning rather than evaluation? 5. How does grading affect the behaviour of students in an open learning environment?
4 The tutor-web A description of the main functionalities as well as the developmental process of the tutor-web system will be given in this chapter. Special attention will be given to item allocation and grading, which have been the main research topics over the past few years. A more detailed description of the system, at different stages of the development, can be found in Paper II, III and IV. The students’ responses to the items in the tutor-web are registered in a database. The data has been used to make design decisions throughout the developmental phase. The system was used to support teaching in an introductory course in statistics from 2011-2014 (taught in spring semesters) and in an undergraduate course in calculus from 2012-2014 (taught in fall semesters). Most of the data used when developing the system originates from these courses. The courses will be referred to as STAT11-STAT14 and CALC12-CALC14 in the text. Part of the analysis made is presented in the chapter but further details can be found in the papers.
4.1
Short history of the tutor-web system
Prof. Gunnar Stefansson started working on the tutor-web system around the year 2000. The work resulted in a pilot version written in HTML and Perl (Stefansson, 2004). Others joined the tutor-web team and in 2007 a preliminary version in Plone, mostly written by computer scientist Auðbjörg Jakobsdóttir, was up and running. Later, another computer scientist Jamie Lentin joined the tutor-web group. In 2013, he transformed the system into a mobile-web 13
14
Chapter 4
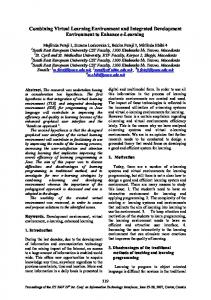
The tutor-web
Figure 4.1: The welcoming screen of the tutor-web. Departments can be chosen from the panel to the left.
which runs smoothly on tablets and smart phones (Lentin, Jonsdottir, Stern, Mokua, & Stefansson, 2014). The current version of the system can be accessed at http://tutor-web.net. The welcoming screen can be seen in Figure 4.1. The system is entirely based on open source software to provide unrestricted usage of material. The teaching material is licensed under the Creative Commons Attribution-ShareAlike License1 and is accessible to anyone having access to the web. Instructors anywhere can obtain free access to the system and use it to exchange and use teaching material while students have free access to its educational content. The vision of implementing an open learning environment and to provide educational material to everyone having access to the web has been the guiding 1 http://http://creativecommons.org/
4.2 Educational content structure
15
principle throughout the years but some aspects of the system have changed considerably. Most of the system components described in this chapter are covered in more detail in Paper II, III and IV.
4.2
Educational content structure
The teaching material currently available in the tutor-web is primarily within mathematics and statistics. However, there is nothing in the structure of the system that prevents material in other subjects to be added into the system which has also been used for teaching fishery science and geology. Recently the focus has been on offering educational material for secondary school mathematics (in Icelandic and English), undergraduate courses in calculus and statistics (in Icelandic and English) and some material for graduate students in computing and calculus for applied statistics (in English).
tutor-web
DEPARTMENTS
COURSES
stat
ANOVA
regression
simple
TUTORIALS
LECTURES
math
LS estimates
multiple
residual check
FURTHER INFO SLIDES slide 1 slide 2 slide 3
example
QUIZ QUESTIONS Question 1
detail Question 2 handout Question 3 ref
Figure 4.2: The structure of the tutor-web. Lectures, which are collections of slides, form tutorials. A tutorial can belong to more than one course. An item bank (collection of quiz questions) belongs to every lecture.
16
Chapter 4
The tutor-web
Within the system, the material is organized into a tree (Figure 4.2) with departments, courses, tutorials, lectures and slides. The different departments can be accessed from the tutor-web welcoming screen (see Figure 4.1). The teaching material within a lecture does not have to fit in a proper lecture given by a teacher but should simply cover a specific topic (the terms lecture and topic could be used interchangeably). Examples of this would be discrete distributions in material used in a introductory course in statistics or limits in a basic course in calculus. For each lecture a collection of exercises (item bank) are available. How to allocate items to students from these banks is the topic of the next section.
4.3
Item allocation algorithms
In the educational systems discussed in Section 2.2 a fixed set of items are allocated to students or drawn randomly, with uniform probability, from a pool of items. Students can answer as many items as they please in the tutor-web system, but in early versions of the system items were selected with uniform probability. A better way might be to implement an item allocation algorithm (IAA) so that the difficulty of the items adapts to the students ability. As pointed out in Section 2.3, current IRT methods might not be appropriate when the focus is on learning. In order to investigate this, data from STAT11 was used and an alternative to the commonly used 3PL model (equation 2.1) including parameters measuring learning was fitted to the data. The final logistic regression model, based on retaining statistically significant variables became: � log
p 1−p
�
= β0 + β1 · rankdiff + β2 · numseen + β3 · numseen2 + β4 · numseen3 + β5 · natt + β6 · natt2 + β7 · noitems + sid, (4.1)
where rankdiff is the ranked difficulty of the question (at the time of analysis), numseen is the number of times the particular question has been answered (seen) by the student, natt is the total number of attempts the student made at questions in the lecture, noitems is the number of questions requested at the time of the answer and sid is the student id. The model in equation 4.1 is quite different from the IRT model in equation 2.1 since it incorporates terms measuring learning; the number of times an item has been seen as well as the
4.3 Item allocation algorithms
17
number of questions requested. These terms are statistically significant and accordingly needed to explain the data at hand. Therefore, there is a need for new methods for item allocation where the focus is on learning rather than evaluation. When developing a new way to allocate items to students it was decided to focus on three basic criteria: • increase the difficulty level as the student learns • select items so that a student can only complete a session with a high grade by completing the most difficult items • select items from previous sessions to refresh memory. Some measure of item difficulty is necessary for implementing the first criteria. In the system, the difficulty of an item is simply calculated as the ratio of incorrect responses to the total number of responses to the questions. The items are then ranked according to their difficulty, from the easiest item to the most difficult one. The implementation of the first two criteria has changed over the years. As stated above, items were assigned uniform probability of being chosen for every student in the early versions of the system. In 2012 this was changed with the introduction of a probability mass function (PMF) which calculates the probability of an item being chosen for a student. The first PMF implemented linked the probability of item being chosen exponentially to the ranking of the item. The probability was also dependent on the student’s grade in the following manner:
p(r) =
r g q m−g · + c m N ·m
if g ≤ m,
q N −r+1 g − m 1−g · + c 1 − m N · (1 − m)
if g > m,
(4.2)
where q is a constant (0 ≤ q ≤ 1) controlling the steepness of the function, N is the total number of items belonging to the lecture, r is the difficulty rank of the item (r = 1, 2, ..., N ), g is the grade of the student (0 ≤ g ≤ 1), c is a PN normalizing constant, c = i=1 q i and m is a constant (0 < m < 1) so that when g < m, the PMF is strongly decreasing and the mass is mostly located at the easy items, when g = m the PMF is uniform and when g > m the PMF is strongly increasing with the mass mostly located at the difficult items. This was changed in 2013 so that mode of the PMF moves to the right with increasing
18
Chapter 4
Probability
Uniform
Exponential
The tutor-web
Beta
0.20
0.20
0.20
0.15
0.15
0.15
0.10
0.10
0.10
0.05
0.05
0.05
grade 0 0.25 0.5 0.75 1
0.00
0.00 0
10
20
30
40
50
0.00 0
rank
10
20
30
40
50
0
10
20
rank
30
40
50
rank
Figure 4.3: The different probability mass functions used in the item allocation algorithm. The uniform PMF was used before 2012, the exponential PMF in 2012 and the beta PMF from 2013.
grade achieved by using the following PMF based on the beta distribution: p(r) =
�
1 N � X i=1
i N +1
�α � · 1−
i N +1
�β
r N +1
�α � · 1−
r N +1
�β ,
(4.3)
where r is the ranked difficulty (r = 1, 2, ..., N ) and α and β are constants controlling the shape of the function. The three different PMFs used over the years (uniform, exponential and beta) are shown in Figure 4.3. Currently the beta PMF is in use and by looking at the figure it can be noted that beginning students and students that have not shown knowledge of the topic in question (with a score 0) receive easy items with high probability. Then, as the grade increases, the mode of the probability mass function shifts to the right until the student reaches a top score resulting in high probability of getting the most difficult questions. The last criterion for the IAA is related to how people forget. In the early 1900s Ebbinghaus (1913) proposed the forgetting curve and showed in his studies that learning and the recall of learned information depends on the frequency of exposure to the material. To utilise these results (and to evaluate the effect within mathematics education) the IAA was changed in 2012 in such a way that students are now occasionally allocated items from previous lectures to refresh memory.
4.4 Grading
4.4
19
Grading
The central purpose of having students answer questions in the tutor-web is learning not evaluation. However, there is always a need to evaluate the students’ performance so that they, as well as their teachers, can follow the learning process. There is no limit on the number of questions students need to answer within a lecture making grading a non-trivial issue. In early versions of the tutor-web the last eight answers counted, with equal weight, towards the tutor-web grade. Students were given one point for a correct answer and minus half a point for an incorrect one. The logic behind this grading scheme (GS) was that old sins should be forgotten while students are learning. This GS had some undesirable side-effects as the following analysis illustrates. Data from CALC12 (see p. 13) was used to investigate when students decide to stop requesting items in the system. From observing support sessions offered to the students during the course it seemed clear that students have a tendency to continue working within this system until the system reports a high grade. This behaviour was confirmed by looking at the data. Number of correct answers to the last 8 items
Continue
Stop
Stopping percentage (%)
0 1 2 3 4 5 6 7 8
112 527 2280 6612 13428 20102 22482 17158 1898
1 9 30 69 216 438 981 1710 5220
0.9 1.7 1.3 1.0 1.6 2.1 4.2 9.1 73.3
Table 4.1: Stopping percentage (%) as a function of the number of correct answers in the last 8 questions. The percentage is by far the highest after eight correct answers in the last eight questions.
Table 4.1 shows the number of times learners decided to continue requesting questions or to stop, as a function of the number of correct answers to the last eight items requested within each lecture. At the time when these data were collected, only the last eight responses were used to calculate the grade in every lecture and by far, the proportion of stopping is highest (73.3%) at the stage
20
Chapter 4
The tutor-web
when the student has received a full mark (8 out of 8). In order to investigate further when the students decide to stop one can consider the fraction of stopping as a function of both the current grade and the most recent grade. This is shown in Table 4.2.
last=0 last=1
0
1
2
3
4
5
6
7
8
0.9
1.5 2.4
1.3 1.4
0.8 1.4
1.0 2.1
2.4 2.0
5.4 3.9
24.7 8.0
73.3
Table 4.2: Fraction of stopping (%) as a function whether the last question was answered correctly (0) or not (1) and the number of correct answers in the last eight questions. Each number in the table is the percentage of lines when a response within one of the cells was also the last response.
It can be seen in the table that if a run of 7 correct answers is followed by an incorrect answer the students decided to stop in 25% of all cases. This is a perfectly logical result since a student who has a sequence of 7 correct and one incorrect, will need another 8 correct answers in sequence to increase the grade. Because of this, and the fact that the tutor-web grade was found to be a bad predictor of the final grade in the course (discussed further in Section 4.6), it was decided in late 2013 to change the GS in such a way that the number of items used to determine the grade was set to min(max(n/2, 8), 30) after n attempts. The idea here was that the weight of each answer would be less than before (when n > 8), thus eliminating the fear of answering the eighth item incorrectly. The students were very unhappy with this new GS since getting a top grade was very difficult because of the increased number of items used to calculate the grade. The GS was changed once again, late 2014, with the following criteria in mind. The GS should: • entice students to continue to request items, thus learning more • reflect current knowledge well • be fair in students minds.
21
0.15
0.15
0.10
0.10
Weight
Weight
4.4 Grading
0.05
0.05
0.00
0.00 0
10
20
30
0
Item
10
20
30
Item
Figure 4.4: The weight function for a student who has answered 30 items for different values of the parameters. Left: α = 0.15, s = 1, ng = 15. Right: α = 0.10, s = 2, ng = 30. α controls the weight on the most recent answered item, s is the functional form for 1 ≤ l ≤ ng where l is the lag. As can be seen, newly answered items get more weight than older ones.
Instead of giving equal weight to items used to calculate the grade it was decided to give newer items more weight using the following formula: α � �s l 1 − ng +1 (1 − α) · ng �s w(l) = X� i 1 − n +1 g i=2 0
when l = 1, when 1 < l ≤ ng
(4.4)
when l > ng
where l is the lagged item number (l = 1 being the most recent item answered), α is the weight given to the most recent answer, ng is the number of answers included in the grade and s determines the shape of the function for 1 ≤ l ≤ ng . Some weight functions for a student after answering 30 items are shown in Figure 4.4. As can be seen by looking at the figure, the newest responses are weighted more while old (sins) get less weight. Since the students are informed of their current grade as well as what their grade will be if they answer the next item correctly the hope is that giving much weight on the most recent answer will entice them to continue requesting items. Studies investigating the effect of the new GS will be conducted in 2015.
22
Chapter 4
4.5
The tutor-web
Feedback
Assessments are frequently used by teachers to assign grades to students (assessment of learning) but a potential use of assessments is to use it as a part of the learning process (assessment for learning) (J. Garfield et al., 2011). The term summative assessment (SA) is often used for the former and formative assessment (FA) for the latter. Definitions of FA and feedback are provided in Paper IV. According to Black and Wiliam (1998), the quality of the feedback is a key feature in any procedure for formative assessment. Stobart (2008) suggested making the following distinction between the complexity of feedback; knowledge of results (KR) only states whether the answer is incorrect or correct, knowledge of correct response (KCR) where the correct response is given when the answer is incorrect and elaborated feedback (EF) where, for example, an explanation of the correct answer is given. In the first version of the tutor-web, only KR/KCR type feedback was provided but in 2012 it was decided to start to add an explanation to items in the tutor-web item bank, thus providing students with EF. The work began with the introductory statistics course and in 2013 explanations were also written to many of the items in the introductory calculus course. An example from a lecture covering inferences for proportions is shown in Figure 4.5. The student has answered the item incorrectly (marked by red), the correct answer is marked with green and an explanation given below.
4.6
Timeout
Final exam scores in the 2012 introductory calculus course (CALC12) were analysed together with the tutor-web grades. The analysis showed that the tutor-web grade was a bad predictor of final grades, the tutor-web grade being considerable higher than the final grade. As discussed in Section 4.4, the GS was changed in 2013, making it harder to achieve a top grade but in addition a timeout feature was added to the system (i.e. allowing a student only a prespecified amount of time to answer an item). This idea was first described in Stefansson and Jonsdottir (2015). The initial idea was to implement a function in such a way that the amount of time strongly decreased with grade, i.e. giving a struggling student plenty of time but as the grade increases, decrease the amount of time to answer an item.
4.6 Timeout
23
Figure 4.5: A question from a lecture on inferences for proportions. After answering the item the students is informed which of the answers it the correct one (KCR-type feedback) and shown an explanation of the correct answer (EF-type feedback).
24
Chapter 4
The tutor-web
10.0
Time allocated
7.5
5.0
2.5
0.0 0.0
2.5
5.0
7.5
10.0
Grade
Figure 4.6: The timeout function with tmax = 10, tmin = 2 gtmin = 5 and std = 1. tmax is the maximum time allocated, tmin the minimum time, gtmin is the grade at which minimum time is allocated and std controls the spread of the dome.
This is not feasible, however, because of the relationship between the difficulty of items and the grade. Therefore it was decided to implement a function in such a way that students are provided generous time initially to answer the easier questions and to build confidence. As the difficulty of the item increases, the allocated time to answer decreases until the exercises become exceedingly difficult warranting an increase in time. This can be achieved using an inverted dome such as: t(g) = tmax − (tmax − tmin ) · e
−
(g−gtmin )2 2s2 td
(4.5)
The function with tmax = 10, tmin = 2, gtmin = 5 and std = 1 is shown in Figure 4.6. As discussed in the next section, values of the parameters of the function can be controlled by content providers in the system. An evaluation of the effects of these changes can be seen in Figure 4.7 where the relationship between tutor-web grades and final exam grades in CALC12CALC14 is shown. Tutor-web grades in the range from 0 to 2 were combined into one group due to few measurements in the groups. The same was done with tutor-web grades in the range from 9 to 10. The panel to the left shows data from CALC12 when the final eight answers were used to calculate the final grade without the timeout function whereas the middle panel shows results from CALC13 when min(max(n/2, 8), 30) items were used together with the timeout function from Figure 4.6. In 2012 there is no obvious relationship between tutorweb performance and the final grade for tutor-web grades in the range from 6 to 9. This was a crucial failing of the system since the students were not given any
4.7 Parametrization of system components
(a) 2012, no timeout, last 8
25
(b) 2013, timeout + longer taper
10.0
(c) 2014, timeout + weighting
10.0
10.0 ●
●
7.5 ●
5.0
7.5
Final grade
●
Final grade
Final grade
7.5
●
5.0
● ●
●
● ●
5.0
●
●
2.5
2.5 ●
2.5
●
●
●
●
● ●
0.0
●
0−2
3
4
5
6
●
7
8 9−10
tutor−web grade
●
0.0
0.0 0−2
3
4
5
6
7
8 9−10
tutor−web grade
0−2
3
4
5
6
7
8 9−10
tutor−web grade
Figure 4.7: The effects on the relationship between tutor-web grades and final exam grades of changing the GS and adding the timeout feature.
indication whether their performance was up to the standard of the course or not. After the changes made in 2013 the tutor-web grade seems to be a better performance indicator. Finally, the panel to the right shows the relationship between the tutor-web performance and the final grade in CALC14, this time using the weighting function given in equation (4.4) to calculate the tutor-web grade. The mapping of the tutor-web grade with the final exam grade is much better than the years before. This analysis is described in more detail in Lentin et al. (2014).
4.7
Parametrization of system components
In the previous section functions to implement an item allocation algorithm (IAA), a grading scheme (GS) and timeout features were presented. Several parameters are used to control the shape of these functions. Initially, these parameters were given fixed values but in the current version of the system content providers can change the value of the parameters, lecture by lecture. The parameters currently in use are shown in Figure 4.8. These are used to control the shape of the timeout function in equation (4.5), the weighting function in equation (4.4), the probability mass function in equation (4.3) as well as the probability of getting items from previous lectures. In addition to the possibility of assigning a unique value to a parameter for all students it is possible to define upper and lower bounds on parameter values. The system will then allocate students random numbers within that range, providing a unique opportunity to test the effects of different settings using formal experiments.
26
Chapter 4
The tutor-web
Figure 4.8: The parameter vector. The parameter values control the shape of the timeout function, the weights in the grading scheme and the settings of the item allocation algorithm.
4.8 Summary of changes in the tutor-web
4.8
27
Summary of changes in the tutor-web
The changes made in the tutor-web over the past several years have been described in the chapter. As mentioned in the beginning of the chapter the system was used to support teaching in two annual undergraduate courses, one in statistics (STAT11-STAT14) and the other in calculus (CALC12-CALC14). The data gathered from those courses has been used to support design decisions and, as will be described in the next chapter, to test the difference in learning among students doing web-assisted homework and pen-and-paper homework. A summary of the changes made over the past four years, along with the setup used in the courses, is shown in Table 4.3.
The tutor-web Chapter 4 28
STAT11 STAT12 CALC12 STAT13 CALC13 STAT14 CALC14
Course year uniform exponential exponential beta beta beta beta
IAA difficulty no yes yes yes yes yes yes
IAA refresh memory
last 8 last 8 last 8 last 8 min(max(n/2,8),30) min(max(n/2,8),30) weighting
Grading
KR/KCR EF KR/KCR EF EF EF EF
Feedback
no no no no yes no yes
Timeout
no no no no yes yes yes
Mobile-web
Table 4.3: Summary of changes made in the tutor-web between 2011 and 2014. Changes have been made to the item allocation algorithm, the grading scheme, the type of feedback provided and the timeout function.
5 Materials and methods As stated in Chapter 3, one objective of this project was to implement the tutorweb system further in order to be able to answer some questions regarding how students behave in an open learning environment such as the tutor-web. Some of the design decisions made after analysing data gathered in the system were described in the last chapter. In addition to that, the work has been aimed at answering the following research questions: 1. How well are first year students at the School of Engineering and Natural Sciences, University of Iceland, prepared for studying mathematics and mathematics related subjects? 2. Have changes made in the tutor-web system had an impact on learning as measured by test performance? 3. Is there a difference in learning, as measured by test performance, between students doing web-based homework and pen-and-paper homework? In an attempt to answer these questions a study and a randomized experiment were conducted. The study was designed to investigate mathematical skills of first year students in SENS while the experiment was designed to investigate potential difference between learning among student doing web-based homework (WBH) and pen-and-paper homework (PPH). A short description of the participants, materials and methods used will be given in this chapter. More detailed descriptions can be found in Paper I and IV. 29
30
5.1
Chapter 5
Materials and methods
Diagnostic test of basic mathematical skills
In 2008, Prof. Rögnvaldur G. Möller started conducting a diagnostic test in mathematics for first year students in SENS. His valuable work was continued within this project by continuing the administration of the test and by systematically collecting background information about the students. Since one of the goals is to investigate which background variables are linked to performance on the test, data gathered between 2011 and 2014 will be included.
5.1.1
Participants
The majority of the undergraduate study programs within SENS include a mandatory course in calculus in the first year. Three calculus courses are given, Calculus A, B and C; A being a theoretical course, B a combination of theory and applications while the focus in C is mainly on applications. Calculus A is mandatory for students in mathematics and physics, Calculus B for engineering students and some study lines within chemistry while Calculus C is mandatory for students studying biochemistry, chemistry, computer science, geology, food science and pharmaceutical science. The three courses represent three groups of students; students choosing mathematics and physics (Calculus A), students choosing subjects that rely heavily on mathematics (Calculus B) and students choosing subjects where mathematics is an important tool but plays less of a role (Calculus C). The diagnostic exam was administrated in the second week of the three courses every year from 2011–2014. In total, 1829 students took the test. The number of students taking the test broken down by year and course along with gender proportions are shown in Table 5.1. Less than 1/3 of the students in Calculus A and B were females while the gender proportions were almost equal in Calculus C.
5.1 Diagnostic test of basic mathematical skills
31
2011
2012
2013
2014
A (f/m)
40 (0.20/0.80)
35 (0.31/0.69)
33 (0.27/0.73)
24 (0.29/0.71)
B (f/m)
192 (0.29/0.71)
212 (0.32/0.68)
222 (0.35/0.65)
187 (0.33/0.67)
C (f/m) P
164 (0.46/0.54)
209 (0.53/0.47)
262 (0.43/0.57)
249 (0.41/0.59)
396
456
517
460
Table 5.1: Number of students taking the test along with gender proportions. f females, m - males. Less than 1/3 of the students in Calculus A and B were females while the gender proportions were almost equal in Calculus C.
The students were asked to provide the following background information: 1. Name of secondary school. 2. Time since Icelandic matriculation examination (IME) (Same year - 1 year - 2 years - more than 2 years). 3. Months since last mathematics course in secondary school (3 months - 8 months - 15 months - more than 15 months). 4. Number of semesters in mathematics in secondary school (less than 6 semesters - 6 semesters - 7 semesters - 8 semesters). 5. I am well prepared for studying mathematics at university level (strongly disagree - disagree - neither agree nor disagree - agree - strongly agree). 6. I did well in mathematics in secondary school (strongly disagree - disagree - neither agree nor disagree - agree - strongly agree). The students’ background differed considerably. Around 42% of the students came straight from secondary school, a year had passed for 32% of the students, two years for 15% and more than two years for 11% of the students. The students had graduated from 40 different secondary schools. In the analysis schools with fewer than 20 students were combined so the number of schools dropped to 26. When looking at the students’ background by student groups, a similar pattern can be seen in all of the background variables as shown in Figure 5.1.
32
Chapter 5
Materials and methods
Students in Calculus A had more courses and less time lapse since taking a mathematics course in secondary schools than students in Calculus B and C (C having fewest courses and the longest time lapse). The Calculus A students also responded more positively to the statements "I am well prepared for studying mathematics at university level" and "I did well in mathematics in secondary school" than the other students. In all cases students in Calculus B answered in-between the other two student groups.
5.1.2
Materials
The diagnostic test is a paper-based test which includes 20 procedural problems. Prof. Rögnvaldur G. Möller constructed the test in 2008. Other professors of mathematics at the UI reviewed the test before administration. The test was also shown to secondary school teachers who confirmed that the problems on the test resemble problems students work on at the secondary school level. The test covers seven topics: 1. Basic arithmetic and functions 2. Basic algebra 3. Equation of a straight line 4. Trigonometric functions 5. Differentiation and integration 6. Vectors 7. Complex numbers. Examples of problems on the exam will be shown in the published version of Paper I. Students with six or more mathematics courses in secondary school should have been introduced to all the topics on the test except for complex numbers according to the Icelandic National Curriculum Guide (Ministry of Education, Science and Culture, 2011). Complex numbers are usually taught in elective courses but these courses are not taught in all secondary schools. All the topics are listed as "assumed knowledge" in SENS’s study guide (SENS, 2014) for first year students in mathematics, physics, engineering, geophysics and chemistry but complex numbers are left off the list of topics for the other study programs.
33 5.1 Diagnostic test of basic mathematical skills
Proportion Proportion
Number of semesters in math 8 semesters 7 semesters 6 semesters < 6 semesters
I am well prepared Strongly disagree Disagree Neither agree nor disagree Agree Strongly agree
0.00
0.25
0.50
0.75
1.00
0.00
0.25
0.50
1.00
C
1.00
B
Course
B
Course
C
0.75
0.50
0.25
0.00
1.00
0.75
0.50
0.25
0.00 A
0.75
A
Proportion Proportion
A
A
B
Course
B
Course
C
C
3 months
Time since last math course
8 months
15 months
> 15 months
Strongly disagree
I did well in math
Disagree Neither agree nor disagree Agree
Strongly agree
Figure 5.1: Answers to background questions by course. A similar pattern can be seen in all of the background variables.
34
Chapter 5
Materials and methods
The same test was used from year to year to ensure reliability but in 2014 four new questions were added to the test. The students were not allowed to use a calculator but numbers were chosen for ease of manipulation. Problems were graded as correct or incorrect, no half-points were given. Summary grades were calculated on the scale 0–10.
5.1.3
Methods
An analysis of variance model (ANOVA, Neter, Wasserman, Kutner, et al., 1996) was fitted to the data to see which variables were linked to performance on the test. The following initial model was used and nonsignificant variables subsequently removed:
gsgcytmedp = µ + αs + βg + γc + δy + ζt + ηm + θe + κd + λp + �sgcytmedp , (5.1) where αs is secondary school (s = 1,2,...,26), βg is gender (g = 1,2), γc is course (c = 1,2,3), δy is year of diagnostic test (y = 1,2,3,4), ζt is time since IME (t = 1,2,3,4), ηm is months since last mathematics course (m = 1,2,3,4), θe is number of semesters in mathematics (e = 1,2,3,4) and κd and λp are the responses to the statements "I did well in math" and "I am well prepared" (d = 1,2,3,4,5 and p = 1,2,3,4,5). Because of correlation in the background variables, due to unbalance in the data, population marginal means (Searle, Speed, & Milliken, 1980) were also estimated to get better estimates of the effect sizes than the unadjusted mean values give. To check the predictive value of the diagnostic test on performance in first year calculus courses, the students were categorized into two groups; students that passed one of the calculus courses (A, B or C) the same academic year they took the diagnostic test and those that did not. Two statistics were used to measure the predictability of the diagnostic test; sensitivity and specificity. Students pass the calculus courses if they get a minimum grade of 5 out of 10 on the final exam. The diagnostic test was however not designed with a particular passing grade in mind so a cutoff needs to be found in the diagnostic test grades. Youdens method (Youden, 1950) was used to find the optimal cutoff in such a way that the sum of the sensitivity and specificity is maximised. Due to the large difference in the student groups the tree groups were analysed separately. If the diagnostic test is shown to be a good predictor of performance in first year calculus courses the results on the test along with other background infor-
5.2 Comparison of learning among students doing WBH and PPH
35
mation about the students can be used to predict how likely future students are to pass a course at the beginning of the semester given some information regarding their background. The following logistic regression model was estimated using data from 2011–2013 for this purpose:
� ln
p 1−p
� = β0 + dt + αs + βg + γc + ζt + ηm + θe + κd + λp
(5.2)
where p is the probability of passing a first year calculus course, dt is diagnostic test grade, αs is secondary school (s = 1,2,...,26), βg is gender (g = 1,2), γc is course (c = 1,2,3), ζt is time since IME (t = 1,2,3,4), ηm is months since last mathematics course (m = 1,2,3,4), θe is number of semesters in mathematics (e = 1,2,3,4) and κd and λp are the responses to the statements "I did well in math" and "I am well prepared" (d = 1,2,3,4,5 and p = 1,2,3,4,5). The model was then used to predict the performance of students from 2011 to 2013. If the probability of the student passing the course is above 50% the student is predicted to pass the course. Afterwards, the number of students the model correctly predicts the outcome for was be counted and the proportion of correct predictions calculated.
5.2
Comparison of learning among students doing WBH and PPH
The study described in the previous section was designed to answer the first out of the three research questions show at the beginning of the chapter. The experiment described in this section was designed to answer the latter two questions.
5.2.1
Participants
The subjects participating in the experiment were all students in an introductory course in statistics between 2011 and 2014 (STAT11–STAT14). Every year around 200 students in chemistry, biochemistry, geology, pharmacology, food science, nutrition, tourism studies and geography were enrolled in the course. The course was taught by Anna Helga Jónsdóttir over the timespan of the experiment. About 60% of the students had taken a course in basic calculus the semester before while the rest of the students had much weaker background in mathematics. Around 60% of the students were females and 40% males.
36
Chapter 5
5.3
Materials and methods
Materials
The learning outcomes in the introductory statistics course the participants were enrolled in are the following. Upon completion of the course the student should: • be able to explain basic statistical concepts, such as population, sample, variable and randomness and evaluate experimental designs in terms of sampling methods, blindness and repetition. • be able to calculate descriptive statistics that describe the center and spread of data and evaluate which are appropriate to use each time. • be able to identify key graphs used to describe data as well as to identify which graphs are appropriate to use in each instance. • be able to explain the basic concepts of probability, such as an event, set, union and intersection and identify common probability distributions as well as being able to evaluate when it is appropriate to use which distribution and calculate the probability of some events using the distributions. • understand the philosophy of statistical inference and perform hypotheses tests and calculate confidence intervals for means, variances and proportions. • understand the philosophy behind ANOVA and simple linear regression and be able to apply the methods. • be able to apply the above mentioned methods in the statistical software R. • be able to assess when it is appropriate to apply the different methods mentioned above and use that knowledge to read simple statistical texts with a critical eye. Among other assignments designed to reach the learning outcomes, the students needed to hand in homework exercises four times which counted 10% towards the final grade in the course. At the beginning of each semester the students were randomly split up in two groups. One group was instructed do exercises in the tutor-web system in the first homework assignment (WBH) while the other group handed in written homework (PPH). The exercises on the PPH assignment and in the
5.3 Materials
37
Figure 5.2: The design of the repeated randomized crossover experiment. The experiment was repeated four times from 2011-2014.
tutor-web were constructed in a similar manner and covered the same topics. The tutor-web exercises can be accesses from http://tutor-web.net/stats/ 205 (in Icelandic). Shortly after the students handed in their homework they took a test in class. The tests were not announced beforehand so the students were unaware that they had a test when they showed up for class. The students’ performance on these tests only counted toward the final grade if it had a positive impact on the final grade. The groups were crossed before the next homework, that is, the former WBH students handed in PPH and vice versa and again the students were tested. Each year this procedure was repeated and the test scores from the four exams registered. The design of this repeated randomized crossover experiment can be seen in Figure 5.2. The subjects of the homework were discrete distributions, continuous distributions, inference about means and inference about proportions. The number of students taking each exam is shown in Table 5.2.
2011 2012 2013 2014
Discrete
Continuous
Means
Proportions
91 113 117 129
84 113 123 130
122 100 110 111
115 65 99 110
Table 5.2: Number of students taking the tests.
38
Chapter 5
5.4
Materials and methods
Methods
To answer the second research question listed on page 29, the following linear mixed model will be fitted to the data from 2011-2014 and nonsignificant factors removed: gmlhyi = µ + αm + βl + γh + δy + (αγ)mh + (βγ)lh + (δγ)yh + si + �mlhyi (5.3) where g is the test grade, α is the math background (m = weak, strong), β is the lecture material (l = discrete distributions, continuous distributions, inference about means, inference about proportions), γ is the type of homework (h = PPH, WBH), δ is the year (y = 2011, 2012, 2013, 2014) and s is the random student effect (si ∼ N (0, σs2 )). The interaction term (αγ) measures whether the effect of type of homework is different between students with strong and weak math background and (βγ) whether the effect of type of homework is different for the lecture material covered. The interaction term (δγ) is of special interest since it measures the effect of changes made in the tutor-web system during the four years of experiments. To answer the third research question, only data gathered in 2014 is used and the following linear mixed model fitted to the data: gmlhi = µ + αm + βl + γh + (αγ)mh + (βγ)lh + si + �mlhi
(5.4)
with α, β, γ and s as above. If the interaction terms are found to be nonsignificant, the γ factor is of special interest since it measures the potential difference in learning between students doing WBH and PPH. In addition to collecting the exam grades, the students answered a survey at the end of each semester. 442 students in total responded to the surveys (121 in 2011, 88 in 2012, 131 in 2013 and 102 in 2014). Two of the questions are related to the use of the tutor-web and the students perception of WBH and PPH homework: 1. Do you learn by answering items in the tuto-web? (yes/no) 2. What do you prefer for homework? (PPH/WBH/Mix of PPH and WBH) The results of the study and the experiment described in this chapter will be outlined in the following chapter.
6 Results As stated in Chapter 1 the work done within this project can roughly be split into three tasks: 1. Investigation into mathematical skills of first years students in the School of Engineering and Natural Sciences (SENS), University of Iceland (UI) (Paper I). 2. Implementation of algorithms in an open learning environment in order to investigate the behaviour of students working in such systems (Paper II, III and IV). 3. Comparing learning among students using the tutor-web system for homework and students doing traditional pen-and-paper homework (Paper IV). The development within the tutor-web system (category 2) has already been described in Chapter 4 but in this chapter the results of the study and the experiment described in Chapter 5 will be given (category 1 and 3).
6.1
Diagnostic test of basic mathematical skills
The main results of the study described in Section 5.1 will be outlined in this section. More details can be found in Paper I.
39
40
Chapter 6 Results
7 ● ●
● ●
Mean grade
6 Course 5
●
●
A
●
B
●
C
● ● ●
4 ●
●
3
2011
2012
●
●
2013
2014
Year
Figure 6.1: Mean grades with standard errors between 2011 and 2014, categorized by course. The grades in Calculus A and B did not change much during the four years but a noticeable drop in mean grades can be seen in Calculus C in 2013.
6.1.1
Summary statistics
To start with, summary statistics of the grades on the diagnostic exam were calculated. The scores differed considerably between the three calculus courses. The mean grades and standard deviations, using a 0 - 10 scale, were x ¯A = 6.51, sA = 2.23 x ¯B = 4.87, sB = 2.14, x ¯C = 3.11 and sC = 1.94. In order to see the evolvement in time, mean grades and standard errors from 2011 to 2014, categorized by courses are plotted in Figure 6.1. The grades in Calculus A and B did not change much during the four years (although there was some decrease in mean grades in 2014) but a noticeable drop in mean grades can be seen in Calculus C in 2013. A large difference in mean scores was found depending on which secondary school students graduated from. Schools with fewer than 20 graduates were removed reducing the number of secondary schools to 26. The average grade was 6.74 among students graduating from the school with the highest average scoring graduates and 2.36 among students graduating from the school with the lowest average scoring graduates. A considerable difference was also detected between students who had 8 semesters of mathematics in secondary schools (¯ x8 semesters = 5.15) and less than 6 semesters (¯ x 15 months = 2.84). Large differences in mean values were also detected between the responses to the statements "I did well in mathematics in high school" (¯ xStrongly agree = 5.84 and x ¯Strongly disagree = 2.93) and "I am well prepared" (¯ xStrongly agree = 7.45 and x ¯Strongly disagree = 1.43). Due to the unbalanced nature of the data, care should be taken when looking at the background variables one at a time. Better estimates of the differences in the background variables are provided below. Mean grades, categorized by topic, can be seen in Figure 6.2. The figure shows that the students scored on average the highest in Arithmetic and functions and lowest in Differentiation and integration where the mean scores across all years is only 1.68.
6.1.2
Models of grades
The ANOVA model in equation (5.1) was fitted to the data in order to see which background variables are linked to the grades. The lm() function in R (R Core Team, 2014) was used to fit the model. All variables were found to be significant (α = 0.05) except for time since IME (ζt ). The final model is
42
Chapter 6 Results
gender course school year months since math semesters I did well in math I am well prepared
Sums of Squares
Df
F value
Pr(>F)
30.69 247.01 963.74 27.86 159.89 37.86 257.95 330.79
1 2 25 3 3 3 4 4
17.81 71.67 22.37 5.39 30.93 7.32 37.42 47.99
< 0.001 < 0.001 < 0.001 0.001 < 0.001 < 0.001 < 0.001 < 0.001
Table 6.1: ANOVA table for the final model.
therefore: gsgcymedp = µ + αs + βg + γc + δy + ηm + θe + κd + λp + �sgcymedp
(6.1)
The ANOVA table, provided by the Anova() function in the car package in R (Fox & Weisberg, 2011), can be seen in Table 6.1. The model’s R2 was estimated as 0.69 meaning that 69% of the variability in grades can be explained by the model. The lsmeans() package in R (Lenth, 2014) was used to estimate population marginal means. The estimates are shown in Table 6.2. These estimates are corrected mean values for the different levels of the background variables. Estimates for only the highest (S1 and S2) and lowest two (S25 and S26) schools are shown. As can be seen in the table, the largest difference in effect sizes is between schools (2.81, 5.88). The difference in effect sizes in the number of semesters in mathematics in secondary school (3.60, 4.13) and months since mathematics in secondary school (3.54, 4.39) is much smaller than indicated by only looking at the unadjusted mean values by groups given in the previous section.
6.1.3
Predictability of the diagnostic test
In order to investigate the predictability of the diagnostic test on performance in first year calculus courses the students were categorized into two groups; those that finished a course in calculus the same year as they took the diagnostic test and those that did not. The latter group consists of students that either dropped out of the course before the final exam or failed the exam. The
6.1 Diagnostic test of basic mathematical skills
Gender Females Males
Course 3.79 4.08
Semesters 8 7 6 15 months
Year 4.39 4.07 3.74 3.54
School 4.13 4.11 3.90 3.60
S1 S2 ... S25 S26
5.88 5.31 ... 3.10 2.81
Strongly agree Agree Neither agree nor disagree Disagree Strongly disagree
2011 2012 2013 2014
4.10 3.97 3.93 3.73
Do?
Prepared?
4.85 4.06 3.62 3.33 3.81
5.14 4.57 3.96 3.18 2.82
Table 6.2: Population marginal means. Only the highest (S1 and S2) and the lowest (S25 and S26) schools are shown. "Do?" represents the responses to "I did well in mathematics in secondary school" and "Prepared?" the responses to "I am well prepared for studying mathematics at university level"
roc() and coords() functions (Robin et al., 2011) in R where used to find the optimal cutoff points in the diagnostic test grades for each course. Students with grades above the cutoff were predicted to pass the final exam and those below were predicted to fail. The optimal cutoff points were 7.4, 4.6 and 3.0 in Calculus A, B and C, respectively. Classification of the students according to their performance on the diagnostic test and the final exam is shown in Table 6.3. A - cutoff = 7.4
Above cutoff Below cutoff P
B - cutoff = 4.6
passed course
failed course
passed course
failed course
39 (0.80) 10 (0.20)
5 (0.15) 28 (0.85)
292 (0.72) 114 (0.28)
60 (0.26) 173 (0.74)
49
33
406
233
C - cutoff = 3.0
Above cutoff Below cutoff P
passed course
failed course
204 (0.66) 106 (0.34)
98 (0.29) 240 (0.71)
310
338
Table 6.3: Classification of students according to performance on diagnostic test (rows) and final exams (columns). The fractions are calculated with respect to performance on final exams.
44
Chapter 6 Results
The sensitivity (a measure of how well the diagnostic test categorizes those that passed the final exam) and specificity (a measure of how well the diagnostic test categorizes those that failed the final exam) were calculated. The sensitivity was 0.80, 0.72 and 0.66 for the three courses A, B and C and specificity was 0.85, 0.74 and 0.71. This means that in Calculus A, 80% of those who finished the course got 7.4 or higher on the diagnostic test while 85 % of those who did not finish got a lower grade on the test. These numbers indicate that the diagnostic test has excellent predictive value on performance of students in Calculus A. The predictive value is a bit less in Calculus B with 72% of those who finished the course getting 4.6 or higher on the diagnostic test while 74 % of those who did not finish got a lower grade. The numbers are lower for Calculus C where 66% of those who finished the course got 3.0 or higher on the diagnostic test while 71 % of those who did not finished were below the cutoff. This means that one student out of three who finished Calculus C the same year they took the diagnostic test were poorly prepared but managed to catch up and pass the course. The logistic regression model shown in equation 5.2 was fitted to the data from 2011–2013 using the glm() function in R. Again, schools with less than 20 students were combined in a school called "Other" and the two categories of the κd and λp variables "I disagree" and "I strongly disagree" were combined because of few subjects in the "I strongly disagree" category. Using a likelihood ratio test the model was found to outperform a model only including an intercept (p-value |t|)
1123.789 1039.348 1039.243 1013.152 1206.998 580.124 1236.322 1250.851 1268.752 1220.682 1244.169 1189.315
20.957 1.336 3.349 2.313 −1.229 11.515 9.924 0.117 10.057 1.942 0.774 2.515
0.000 0.182 0.001 0.021 0.219 0.000 0.000 0.907 0.000 0.052 0.439 0.012
Table 6.6: Parameter estimates for the final model used to answer research question 1. The reference group are students in the 2011 course with weak math background handing in PPH on discrete distributions.
Parameter (Intercept) mathStrong test2 test3 test4 WBH
Estimate
Std. Error
5.080 1.379 0.137 1.254 1.719 0.416
0.239 0.251 0.216 0.228 0.228 0.158
df
t value
Pr(>|t|)
349.520 158.556 347.434 360.445 358.667 336.485
21.279 5.502 0.633 5.493 7.538 2.640
0.000 0.000 0.527 0.000 0.000 0.009
Table 6.7: Parameter estimates for the final model used to answer research question 2. The reference group (included in the intercept) are students with weak math background handing in PPH on discrete distributions.
The reference group (included in the intercept) are students with weak math background handing in PPH on discrete distributions. By looking at the table it can be noted that the difference between the WBH and PPH groups is significant (p = 0.009) with estimated effect size 0.416. This indicates that students do on average better after handing in WBH than PPH as measured by test scores.
48
Chapter 6 Results
1.00
1.00
Proportion
0.75
0.75 homework
learned yes
0.50
PPH 0.50
WBH
no 0.25
Mix 0.25
0.00
0.00 2011
2012
2013
2014
year
2011
2012
2013
2014
year
Figure 6.3: Results from the student survey. Left: "Do you learn from the tutorweb?". Right: "What is you preference for homework"?
6.2.2
Student survey
The students perception of the tutor-web system is in general very positive. Over 90% of the students that participated in a survey conducted over the four years feel they learn using the system. Despite the positive stand towards the system about 80% of the students prefer a mixture of PPH and WBH over PPH or WBH alone. It is interesting to look at the difference in perception over the four years shown in Fig. 6.3. The GS was changed in 2014 making it more difficult to get a top grade for homework in the system and more difficult than in PPH. This lead to a general frustration in the student group. The fraction of students preferring only handing in PPH, compared to WBH or mix of the two, more than tripled compared to the previous years.
7 Conclusions and future perspective The work done within the framework of this project can roughly be split up into three tasks or categories as stated in Chapter 1: 1. Investigation into mathematical skills of first years students in the School of Engineering and Natural Sciences (SENS), University of Iceland (UI) (Paper I). 2. Implementation of algorithms in an open learning environment in order to investigate behaviour of students working in such systems (Paper II, III and IV). 3. Comparing learning among students using the tutor-web system for homework and students doing traditional pen-and-paper homework (Paper IV). The first task was carried out by administrating a diagnostic test to first year students in SENS between 2011–2014. The students were registered in three courses: Calculus A (theoretical), B (mix of theory and applications) and C (mainly applications). Unfortunately the performance of students on the test was generally poor. Average grades differed considerably between the three calculus courses: x ¯A = 6.51, x ¯B = 4.87 and x ¯C = 3.11 on a 0-10 scale. An ANOVA model was fitted to the grade data including the available background variables. Secondary school, gender, course, year of diagnostic test, months since last mathematics course, number of mathematics courses, and the students’ perception on how well they did in mathematics in secondary schools 49
50
Chapter 7
Conclusions and future perspective
and how well they are prepared were found to be linked to performance. The model explained 69% of the total variability in grades. The largest differences in estimated effect sizes were found between schools and the students’ perception on how well they did in secondary school. It needs to be noted that with the available data it is impossible to conclude whether the large difference in average grades between graduates from different schools is due to the quality of education provided, difference in student groups choosing these schools or some other factors that can affect the schools’ ability to provide their students with good mathematics education. In order to investigate this further, data on the performance of students on standardized test in mathematics administrated before students enter secondary schools is needed. The agency administrating these tests has given a positive response to the idea of merging their data to the data gathered from the diagnostic test so hopefully research into this issue can move forward in the near future. The study has provided valuable insight into the mathematics skills of university entrants in Iceland. The lack of basic mathematical skills of SENS’s entrants is a challenging problem and the fact that about one out of every three students does not show the mathematical skills expected after one year in secondary school is worrying. SENS’s staff members have been presented with the results to make them aware of the situation which hopefully increases their understanding of the difficulties a large proportion of first year students are facing. Whether to use an entrance exam to sort out students that do not have sufficient skills has been debated within SENS for several years. Administrating an entrance exam will possibly largely eliminate the problem of having poorly prepared students enrolled in SENS’s study programs. On the other hand, there is a risk of eliminating students that could perform well in their studies. As noted when investigating the predictability of the diagnostic exam, one of every three students who finished Calculus C on time was poorly prepared but managed to catch up and pass the course. A part of this group would likely fail an entrance exam. The students’ performance on the diagnostic exam have been presented to secondary-school teachers and schoolmasters resulting in an extremely valuable dialogue between mathematics teachers working within the two school levels. Hopefully this dialogue will result in increasing cooperation between teachers at secondary school and university levels to reach a common goal of strengthening mathematics education in Iceland.
Conclusions and future perspective
51
The second task, the development of the tutor-web system, was ongoing throughout the timespan of this project. Now, in 2015, the tutor-web offers a unique way of allocating items to students, grading and includes a number of novel features as described in Chapter 4. In addition to running in a browser on a computer the system runs smoothly on smart-phones and tablets. The system gives all learners who connect to the internet access to: • over 3000 items within secondary school mathematics • over 4000 items within applied calculus • over 500 items within introductory statistics • and more... The tutor-web project is an ongoing research project. Several exciting challenges on how to develop the system will face the tutor-web team in the near future. One field of research is to develop the item allocation algorithm further. In the current version of the IAA, the items are ordered according to difficulty level, calculated as the ratio of incorrect responses to the total number of responses. This is not optimal since items are placed equidistant to one another on the difficulty scale. A solution to this would be to implement a more sophisticated method for estimating the difficulty of the items using IRT but, as mentioned earlier, IRT methods are designed for testing not learning. Including a learning parameter should make the IRT models more suitable to use in a learning environment. Another interesting field of research would be to investigate formally the impact of allocating items from old material and subsequently estimate the best timepoint to allocate old items to students to refresh memory. Yet another task for the tutor-web team is to investigate further the impact of system features such as the IAA and GS. Because of the parametrization of system components, described in Section 4.7, formal experiments can now be conducted with the goal of estimating optimal values of system parameters. Some new components have also been added to the system recently, two named below. The tutor-web team released a cryptocoin, the smileycoin or SMLY, to use for educational purposes (see http://tutor-web.info/smileycoin for more details). The coins will be tested as a means to motivate students to work in the system. Initially this coin will have the same "value" as a "star" or "smiley" in a ledger. The coin was released late 2014 and used for debugging purposes
52
Chapter 7
Conclusions and future perspective
in CALC14. The coin is now registered on a cryptocoin exchange, potentially giving it financial value. Many questions are still unanswered but great potential lies in the use of the SMLY-coin. Yet another newly implemented feature of the tutor-web system is the possibility of letting students write items in the system as well as peer-reviewing items from fellow students. With some probability (set by an instructor), while answering questions in the system, students are asked to write their own items. The form students are asked to fill out is shown in Figure 7.1. The student written items are then allocated with some probability to other students to review. The third task, testing whether the changes made in the system had an impact on learning, and more general, whether web-based learning has a positive impact on learning was carried out by conducting a repeated randomized crossover experiment. The results from the experiment conducted were promising with students doing web-based homework outperforming, on average, students doing regular pen-and-paper homework. Also, the performance of students working in the tutor-web was on average better in 2014 than 2011, as measured by test scores, indicating that changes made in the system have had a positive impact on learning. This promising result will hopefully increase the number of teachers using the system in the near future. As stated above, over 3000 items are currently available in the tutor-web within secondary school mathematics and cooperation has already begun with some schools. One of the remarks made in a newly report about secondary school mathematics education in Iceland (Jonsdottir et al., 2014) is that some teachers seem to be teaching methods instead of focusing on understanding in their teaching. In the progress of writing the report the authors attended mathematics classes in secondary schools. A number of classes consisted of the teacher showing how to solve a certain type of problem on the blackboard and afterwards telling the students to solve the same type of problems by themselves. Looking at the performance of students on typical procedural problems on the diagnostic exam, it is apparent that even though a large proportion of students are familiar with basic arithmetic and functions, 35% of students in Calculus C were unable to calculate a simple expression, 4 − 2(4 − 23 ), correctly without using a calculator. Also, only one out of every three students showed proficient skills in basic algebra and, as an example, only 1 of 5 students were able to
Conclusions and future perspective
53
Figure 7.1: With some probability students are asked to make their own items. When they start writing their questions, answers and explanations, the example text (light grey) disappears. This template is taken from the elementary statistics course.
54
Chapter 7
Conclusions and future perspective
solve for x in the following equation: y=
4x + 1. x+1
Even though almost all of the students had taken courses in differentiation and integration in secondary schools less than 1 out of Z 36 students were able to √ x dx . The students differentiate a simple rational function and evaluate 1
have all worked on problems similar to the ones shown above in secondary schools but have, for some reason, lost the skill to solve them. The performance on problems meant to test the students’ understanding of certain concepts is also of great concern. The fact that only 7% of the students were able to find sin θ given that cos θ =
2 3
and 0 ≤ θ ≤
π 2
indicates that the students are in
general not familiar with the unit circle. Also, the fact that 40% of the students were unable find the point of intersection of the two lines x = 1 and y = 1 indicates that a considerable proportion of the students do not understand how the usual coordinate system works. Clearly the time the students spend with their teacher can be used in a more productive way. Rather than working on procedural problems in class the tutorweb system could be used for developing that particular skill. It is important the students practice problem solving but it is of even greater importance that the students understand the underlying methods. Instead of using classroom time for solving standard exercises, teachers could spend time helping the students to understand why, not just how. The tutor-web system could be used as a drill tool where students develop skills in problem solving and get immediate feedback on how they are doing. The fact that the students enjoy working in the system adds to the great potential in using the tutor-web system in Icelandic secondary schools. It is easy to produce standard drilling exercises such as the one shown in Figure 7.2 but one of the challenges facing the tutor-web team is to produce more items designed to enhance understanding, that is to encourage deep learning rather than surface learning. On the diagnostic exam, only about 10% of students are able to state the exact values of cos(30◦ ) and sin(150◦ ). This indicates that students at some point learned these values by heart but have since forgotten. Solving an exercise like the one shown in Figure 7.3 might enhance their understanding of the trigonometric functions and the unit circle and therefore lower the risk of forgetting.
Conclusions and future perspective
55
Figure 7.2: A standard drilling exercise.
Using the tutor-web in universities and secondary schools in Iceland has great potential but using the system in rural areas where teaching material is limited offers even greater potential. Preliminary experiments using the system in the University of Maseno, Kenya, were promising but many challenges face the tutor-web team when adapting the system to the needs of users in Maseno. A part of the Maseno students has not used a computer before, access to computers and internet is very limited and even electricity can be unstable. To address these challenges some adaptations have already been made. At present, students only need to be connected to the internet when downloading question items but can answer them and get feedback even though they are offline. Currently a system in a suitcase is being developed including a tutor-web server and tablets. A teacher using the system can then allocate tablets to students that connect to the tutor-web server when in the school premisses, providing exercises items. The students can take the tablets home and work on problems regardless of whether internet connection is available or not. Next time the students’ tablet connects to the server data on the performance of the student gets uploaded to the server and new items are downloaded. Testing of a prototype of the system is scheduled in the University of Maseno in 2015. Funding is currently being sough so hundreds of students in rural areas of the world will get the opportunity to learn mathematics in a way a student in Maseno described his experience using the tutor-web: "Doing maths online was the best experience I ever had with maths".
56
Chapter 7
Conclusions and future perspective
Figure 7.3: An item designed to enhance the understanding of students of the unit circle.
Conclusions and future perspective
57
Figure 7.4: A student working in the tutor-web in a computer lab at the University of Maseno
58
Chapter 7
Conclusions and future perspective
Part II
Papers
I Paper I The performance of first year students in the University of Iceland on a diagnostic test of basic mathematical skills Anna Helga Jonsdottir, Freyja Hreinsdottir, Gudrun Geirsdottir, Rognvaldur G. Moller & Gunnar Stefansson.
61
Chapter I The performance of first year students in the University of Iceland on a 62 diagnostic test of basic mathematical skills
Abstract In order to investigate mathematical skills of first year students in the School of Engineering and Natural Sciences, University of Iceland, a diagnostic test has been administrated yearly from 2011. The results show that a large proportion of students lack basic skills in mathematics. Analysis of variance was used to investigate which background variables are linked to performance on the test. Secondary school, gender, year of diagnostic test, time since last mathematics course in secondary school, number of semesters of mathematics courses in secondary school and the students’ perception on how well they did in mathematics in secondary schools and how well they are prepared were all linked to performance on the test. Keywords: Mathematics education; Diagnostic test; University entrants; Secondary school
I.1 I.1.1
Introduction Diagnostic tests and transition issues
Dropout-rates and poor performance of students in first year courses in calculus in the School of Engineering and Natural Sciences (SENS), University of Iceland (UI), are of great concern. Over the past several years, less than half of the students registered for courses on basic calculus complete them. In order to examine SENS first year students’ ability in mathematics the same diagnostic test has been administrated every year since 2011. The main purpose of a diagnostic test is to provide students with immediate feedback on their ability as well as to enable instructors to identify "at risk" students and common areas of difficulty within a student group (Appleby, Samuels, & Treasure-Jones, 1997). Also, by administrating the same test for several years, a year to year comparison can be made. Diagnostic tests have been administrated throughout the world for years. In England, Hunt and Lawson (1996) showed evidence of decline in mathematical standards of first year students in Coventry University between 1991 and 1995. The same trend was seen in a study performed between 1998 and 2008 at the University of Limerick, Ireland (Gill et al., 2010). Dutch universities have also observed that mathematical abilities of incoming students have dropped in
I.1 Introduction
63
recent years (Heck & Van Gastel, 2006). It is also of interest to see if there is a link between background information available about the students and their performance on diagnostic tests. The results from such a test in McMaster University, Canada, described in Kajander and Lovric (2005) indicated that performance is strongly correlated to the time students spent studying mathematics in high school. Also, in a study from New Zealand (James et al., 2008), a high failure rate in tertiary mathematics courses was seen in the group of students with few credits in secondary school mathematics. Other variables were not looked at in theses studies. In an Australian study (Wilson & MacGillivray, 2007) more background variables were available and mathematical skills, as measured by a multiple choice test, were linked to the subject chosen, whether or not higher mathematics had been studied in secondary school, gender, self-efficacy and year. In many OECD countries the proportion of students continuing their education at university has increased considerable the past several years. In Iceland, the tertiary level enrolment increased 40% between 2000 and 2010 (OECD, 2013). An accompaniment to increased enrolment is the changing profile of the student group, with students with wider range of academic background enrolling (Hoyles, Newman, & Noss, 2001). This change has been named as one of the reasons for poor performance of first year students in mathematics courses (Kajander & Lovric, 2005; Mustoe, 2002; Northedge, 2003; Seymour, 2001). Others have proposed that the root of this "Mathematics problem" is due to the failure of many students to make the transition from secondary school to tertiary mathematics (Anthony, 2000; Hourigan & O’Donoghue, 2007) and in Sweden a part of the problem has been linked to a curriculum gap between secondary schools and universities (Brandell et al., 2008). Issues regarding the transition from secondary school to university have been researched recently. A comprehensive overview is provided in Thomas et al. (2012). This transition often presents major difficulties whether students are specializing in mathematics or are registered in a program for which mathematics is an auxiliary subject. According to De Guzmán et al. (1998) one of the issues the students face is a significant shift in the kind of mathematics to be mastered with increasing focus on depth, both with respect to the technical abilities needed and to the conceptual understanding underlying them. This transition process to advanced mathematical thinking is experienced as traumatic by many students (Engelbrecht, 2010).
Chapter I The performance of first year students in the University of Iceland on a 64 diagnostic test of basic mathematical skills
I.1.2
The Icelandic school system
To set the scene for the study described here a few words about the Icelandic school system are needed. The system is divided into four levels; playschool, compulsory school (6–16 years of age), secondary school for four years (16– 20) and finally higher education. Secondary school attendance ends with the Icelandic matriculation examination (IME). The IMEs are not standardized and their execution can be quite different between schools. Even though the IMEs are not standardized, secondary schools need to follow the Icelandic National Curriculum Guide, a centralized curriculum guide published by the Ministry of Education and Culture. By the time the students in this study started secondary school a national guide in mathematics from 1999 was in effect (Ministry of Education, Science and Culture, 1999). Five standard courses in mathematics are defined in the guide plus one course in probability and statistics. Students taking six courses in mathematics in secondary schools have most likely taken these six courses. In addition to the six courses some elective courses are also defined in the guide. The University of Iceland is the oldest and largest university in the country with around 14.000 students registered. It is a public university open to students holding an IME. In most departments the only requirement to be enrolled is the IME. This is the case in some departments within SENS (e.g. engineering and computer science) while in others a minimum number of credits within mathematics, physics and chemistry are required (e.g. mathematics and physics). Even though there are no subject prerequisites in some departments in SENS students are advised on "assumed knowledge" for each study program (SENS, 2014). Students graduating from around 40 secondary schools are currently enrolled in SENS. The schools are very different in terms of objectives and student groups.
I.2 I.2.1
Methodology Participants
Most students in SENS need to take a course in calculus the first year of their studies. Three calculus courses are taught, Calculus A, B and C. Calculus A is a theoretical course, Calculus B is a combination of theory and applications while the focus in Calculus C is mainly on applications. A list of the main subjects of students in each course is given in Table I.1. There are three groups
I.2 Methodology
65
of students; students choosing mathematics and physics (Calculus A), students choosing subjects that rely heavily on mathematics (Calculus B) and students choosing subjects where mathematics plays less of a role (Calculus C). Course
Subject
A
Mathematics, physics*
B
Chemistry*, physics*, civil and environmental engineering, electrical and computer engineering, geophysics, mechanical and industrial engineering, software engineering
C
Biochemistry, chemistry*, computer science, geology, food science, pharmaceutical science
Table I.1: Subjects belonging to the three calculus courses. Students in subjects marked with * can choose between two courses.
The diagnostic test was administrated in the three calculus courses in the second week of classes from 2011 to 2014. In total, 1829 students took the test. It should be noted that more students were registered in the courses but did not show up for the test. The number of students taking the test by year and course along with gender proportions are shown in Table I.2. It can be noted that less than 1/3 of the students in Calculus A and B were females while the gender proportions were almost equal in Calculus C. 2011
2012
2013
2014
A (f/m)
40 (0.20/0.80)
35 (0.31/0.69)
33 (0.27/0.73)
24 (0.29/0.71)
B (f/m)
192 (0.29/0.71)
212 (0.32/0.68)
222 (0.35/0.65)
187 (0.33/0.67)
C (f/m) P
164 (0.46/0.54)
209 (0.53/0.47)
262 (0.43/0.57)
249 (0.41/0.59)
396
456
517
460
Table I.2: Number of students taking the test along with gender proportions. f females, m - males.
Chapter I The performance of first year students in the University of Iceland on a 66 diagnostic test of basic mathematical skills
I.2.2
Materials
The test is a paper-based test comprising 20 procedural problems. The test was constructed by a professor of mathematics with considerable experience in teaching basic calculus. The test was then reviewed by other professors of mathematics at the UI and secondary school teachers who confirmed that the problems on the test resemble problems students work on at the secondary school level. The test covers seven topics: 1. Basic arithmetic and functions 2. Basic algebra 3. Equations of a straight line 4. Trigonometric functions 5. Differentiation and integration 6. Vectors 7. Complex numbers. Examples of problems on the exam are shown in the Appendix. The topics covered in the first three parts of the test are taught at the elementary school level and in the first two standard mathematics courses defined in the Icelandic National Curriculum Guide so all students should be familiar with those topics. Topics 4, 5 and 6 are covered in the next three standard mathematics courses. The last topic, complex numbers, is not covered in the standard courses defined in the curriculum guide but covered in elective courses in some secondary schools. Therefore, students with at least six mathematics courses in secondary school should have had experience with all the topics on the test except for complex numbers. All the topics are listed as "assumed knowledge" in SENS’s study guide for first year students in mathematics, physics, engineering, geophysics and chemistry but complex numbers are left out in the list of topics for the other study programs. The same test was used from year to year to ensure reliability. However, in 2014 four new questions were added to the test. The students were not allowed to use a calculator but numbers were chosen for ease of manipulation. Problems were graded as correct or incorrect, no half-points were given. Grades were given on the scale 0–10.
I.2 Methodology
67
The students were also asked to provide the following background information: 1. Name of secondary school. 2. Year of Icelandic matriculation examination (IME). 3. Months since last mathematics course in secondary school (3 months - 8 months - 15 months - more than 15 months). 4. Number of semesters in mathematics in secondary school (less than 6 semesters - 6 semesters - 7 semesters - 8 semesters). 5. I am well prepared for studying mathematics at university level (strongly disagree - disagree - neither agree nor disagree - agree - strongly agree). 6. I did well in mathematics in secondary school (strongly disagree - disagree - neither agree nor disagree - agree - strongly agree).
I.2.3
Methods
To give a feel for the students’ background, responses to the six background questions were summarised. It is of interest to see if the responses to the last four background questions differ between the three student groups (Calculus A, B and C). The responses to these questions were therefore analysed separately. Mean values and other summary statistics of grades were calculated by courses and other background variables but because of the unbalanced nature of the data unadjusted mean values should be interpreted with care. An analysis of variance model (ANOVA) (Neter et al., 1996) was fitted to the data to see which variables are linked to the grade. The following initial model was used and nonsignificant variables subsequently removed: gsgcytmedp = µ + αs + βg + γc + δy + ζt + ηm + θe + κd + λp + �sgcytmedp , (I.1) where αs is secondary school (s = 1,2,...,26), βg is gender (g = 1,2), γc is course (c = 1,2,3), δy is year of diagnostic test (y = 1,2,3,4), ζt is time since IME (t = 1,2,3,4), ηm is months since last mathematics course (m = 1,2,3,4), θe is number of semesters in mathematics (e = 1,2,3,4) and κd and λp are the responses to the statements "I did well in math" and "I am well prepared" (d = 1,2,3,4,5 and p =
Chapter I The performance of first year students in the University of Iceland on a 68 diagnostic test of basic mathematical skills
1,2,3,4,5). Because of correlation in the background variables, due to unbalance in the data, population marginal means (Searle et al., 1980) (sometimes called least squares means) were estimated to get better estimates of the effect sizes than the unadjusted mean values would give. It is of interest to see if the diagnostic test has some predictive value on the performance of students in first year calculus courses. In order to investigate this, the students were categorized into two groups; students that passed one of the calculus courses (A, B or C) the same academic year they took the diagnostic test and those that did not. Diagnostic test data from 2014 was left out in this part of the analysis since by the time of the analysis students had not finished the calculus courses and their performance therefore unknown. Two statistics were used to measure the predictability of the diagnostic test; sensitivity and specificity. The sensitivity is a measure of how well the diagnostic test categorizes those that passed the final exam and specificity those that failed the final exam. Students pass the calculus courses if they get a minimum grade of 5 out of 10 on the final exam. The diagnostic test was however not designed with a particular passing grade in mind. Therefore a cutoff needs to be found in the diagnostic test grades in such a way that students with grades above the cutoff are predicted to pass the final exam and those below are predicted to fail. Youdens method (Youden, 1950) was used to find the optimal cutoff so that the sum of the sensitivity and specificity is maximised. Due to the large difference in the three courses they were analysed separately.
I.3 I.3.1
Results The students’ background
By looking at the students’ responses to the background questions it is apparent that their background is very different. Around 42% of the students came straight from secondary school, a year had passed for 32% of the students, two years for 15% and more than two years for 11% of the students. The students had graduated from 40 different secondary schools. To see whether the students’ background differs between the three calculus courses answers to the background questions were analysed separately for the three courses. As can be seen in Figure I.1 the groups are quite different. Similar patterns can be seen in all of the background variables. Students in
I.3 Results
69
Calculus A had more courses and greater time laps since taking a mathematics course in secondary schools than students in Calculus B and C (C having fewest courses and greatest time laps). The Calculus A students also answered more positively to the statements "I am well prepared for studying mathematics at university level" and "I did well in mathematics in secondary school" than the other students. In all cases students in Calculus B answered in between the other two student groups.
I.3.2
Summary statistics of grades
The scores on the diagnostic test differed considerably between the three calculus courses. A boxplot of the grades, categorized by courses, can be seen in Figure I.2. The lines in the boxes are the median values, mA = 6.9, mB = 4.8 and mc = 2.8. It can also be noted by looking at the figures that the variability is similar in the three groups. The distribution of grades is slightly left-skewed in the A group, close to symmetric in the B group and slightly right-skewed in the C group. The mean grades and standard deviations were x ¯A = 6.51, sA = 2.23 x ¯B = 4.87, sB = 2.14, x ¯C = 3.11 and sC = 1.94. It is of interest to see if the grades have changed in time. Mean grades and standard errors from 2011 to 2014, categorized by courses, can be seen in Figure I.3. As can be seen in the figure, the grades in Calculus A and B have not changed much (although there was some decrease in mean grades in 2014) but a noticeable drop in mean grades can be seen in Calculus C in 2013. Mean scores were also calculated for the students’ responses to the background variables. A large difference in mean scores was found between which secondary school students graduated from. Schools with fewer than 20 graduates were removed reducing the number of secondary schools to 26. The average grade was 6.74 among students graduating from the school with the highest average scoring graduates and 2.36 among students graduating from the school with the lowest average scoring graduates. A considerable difference was also detected between students who had 8 semesters of mathematics in secondary schools (¯ x8 semesters = 5.15) and less than 6 semesters (¯ x 15 months = 2.84). Large differences were also detected between the responses to the statements "I did well in mathematics in high school" (¯ xStrongly agree = 5.84 and x ¯Strongly disagree = 2.93) and "I am well prepared"
Chapter I The performance of first year students in the University of Iceland on a 70 diagnostic test of basic mathematical skills
Proportion Proportion
Number of semesters in math 8 semesters 7 semesters 6 semesters < 6 semesters
Strongly disagree
I am well prepared Disagree Neither agree nor disagree Agree Strongly agree
0.00
0.25
0.50
0.75
1.00
0.00
0.25
0.50
1.00
C
1.00
B
Course
C
0.75
A
B
Course
A
A
B
Course
B
Course
C
C
3 months
Time since last math course
8 months
15 months
> 15 months
Strongly disagree
I did well in math
Disagree Neither agree nor disagree Agree
Strongly agree
Figure I.1: Answers to background questions by course.
0.75
0.50
0.25
0.00
1.00
0.75
0.50
0.25
0.00 A
Proportion Proportion
I.3 Results
71
10.0 ● ●
Grade
7.5
5.0
2.5
0.0 A
B
C
Figure I.2: Boxplot of grades, categorized by course.
7 ● ●
● ●
Mean grade
6 Course 5
●
●
A
●
B
●
C
● ● ●
4 ●
●
3
2011
2012
●
●
2013
2014
Year
Figure I.3: Mean grades with standard errors between 2011 and 2014, categorized by course.
Chapter I The performance of first year students in the University of Iceland on a 72 diagnostic test of basic mathematical skills
8
topic 6
Algebra
Grade
Arithmetic and functions Complex numbers Differentiation and integration
4
Equation of a straight line Trigonometric functions Vectors
2
2011
2012
2013
2014
Year
Figure I.4: Mean grades between 2011 and 2014, categorized by topic.
(¯ xStrongly agree = 7.45 and x ¯Strongly disagree = 1.43). Due to the unbalanced nature of the data care should be taken when looking at the background variables one at a time. A better estimates of the differences in the background variables are provided in the next section. As stated above, the problems on the diagnostic test cover seven topics. Mean grades, categorized by topic, can be seen in Figure I.4. As can be seen in the figure, the students did on average best in Arithmetic and functions and worst in Differentiation and integration where the mean scores across all years is only 1.68. A slight downward trend can be seen in most of the topics. Examples of problems, by topics, are shown in Appendix along with proportion of students answering them correctly in 2014. When looking at the problems and the performance of the students it can be seen that a large proportions of the students are familiar with basic arithmetic and functions even though 35% of the students in Calculus C were unable calculate 4 − 2(4 − 32 ) correctly without using a calculator. Unfortunately the results on the algebra part were much worse with less then 1 of 3 students showing solid skills in basic algebra. It is of great concern that only 1 of 5 students were able to solve for x in the 4x following equation: y = + 1. Another concern is the students’ knowledge x+1 of trigonometric functions. The fact that only 7% of the students were able to find sin θ given that cos θ =
2 3
and 0 ≤ θ ≤
π 2
indicate that the students
I.3 Results
73
are in general not familiar with the unit circle. Also, even though most of the students had taken courses in differentiation and integration in secondary schools less than 1 of Z 36 students were able to differentiate a simple rational √ function or evaluate x dx . Finally, the fact that 40% of the students were 1
unable find the point of intersection of the two lines x = 1 and y = 1 (problem 23) indicates that a considerable proportion of the students do not understand how the usual coordinate system works.
I.3.3
Modelling of grades
In order to see which background variables are linked to the grades the ANOVA model in equation (I.1) was fitted to the data using the lm() function in R (R Core Team, 2014). All variables were found to be significant (α = 0.05) except for time since IME (ζt ). The final model is therefore: gsgcymedp = µ + αs + βg + γc + δy + ηm + θe + κd + λp + �sgcymedp ,
(I.2)
The ANOVA table, provided by the Anova() function in the car package in R (Fox & Weisberg, 2011), can be seen in Table I.3. The model’s R2 was estimated as 0.69 meaning that 69% of the variability in grades can be explained by the model. Population marginal means were estimated using the lsmeans() package in R (Lenth, 2014) and are shown in Table I.4. These estimates are corrected mean values for the different levels of the background variables. Estimates are only shown for the highest (S1 and S2) and lowest two (S25 and S26) schools. As can be seen in the table, the largest difference in effect sizes is between schools (2.81, 5.88). The difference in effect sizes in the number of semesters in mathematics in secondary school (3.60,4.13) and months since secondary school (3.54,4.39) is much smaller than indicated by only looking at the unadjusted mean values by groups shown in the previous section.
I.3.4
Prediction of performance in calculus courses
In this part of the analysis data from 2011, 2012 and 2013 were used. The students were categorized into two groups, those that finished a course in calculus the same year as they took the diagnostic test and those that did not. The latter group consists of students that either dropped out of the course before the final exam or failed the exam.
Chapter I The performance of first year students in the University of Iceland on a 74 diagnostic test of basic mathematical skills
gender course school year monts since math semesters I did well in math I am well prepared
Sums of Squares 30.69 247.01 963.74 27.86 159.89 37.86 257.95 330.79
Df 1 2 25 3 3 3 4 4
F value 17.81 71.67 22.37 5.39 30.93 7.32 37.42 47.99
Pr(>F) < 0.001 < 0.001 < 0.001 0.001 < 0.001 < 0.001 < 0.001 < 0.001
Table I.3: ANOVA table for the final model. Gender Females Males
Course 3.79 4.08
Semesters 8 7 6 15 months
Year 4.39 4.07 3.74 3.54
School 4.13 4.11 3.90 3.60
S1 S2 ... S25 S26
5.88 5.31 ... 3.10 2.81
Strongly agree Agree Neither agree nor disagree Disagree Strongly disagree
2011 2012 2013 2014
4.10 3.97 3.93 3.73
Do?
Prepared?
4.85 4.06 3.62 3.33 3.81
5.14 4.57 3.96 3.18 2.82
Table I.4: Population marginal means. Only the highest (S1 and S2) and the lowest (S25 and S26) schools are shown. "Do?" represents the responses to "I did well in mathematics in secondary school" and "Prepared?" the responses to "I am well prepared for studying mathematics at university level"
The roc() and coords() functions (Robin et al., 2011) in R where used to find the optimal cutoff for each course. Students with grades above the cutoff on the diagnostic test were predicted to pass the final exam and those below were predicted to fail. The optimal cutoff points were 7.4, 4.6 and 3.0 in Calculus A, B and C, respectively. Classification of the students according to their performance on the diagnostic test and the final exam is shown in Table I.5. The sensitivity (a measure of how well the diagnostic test categorizes those that passed the final exam) and specificity (a measure of how well the diagnostic test categorizes those that failed the final exam) of the test can now be calculated. Sensitivity was 0.80, 0.71 and 0.66 for the three courses A, B and
I.4 Discussion and conclusions
75
C and specificity 0.85, 0.74 and 0.71. This means that in Calculus A, 80% of those who finished the course got 7.4 or higher on the diagnostic test while 85 % of those who did not finished got lower than 7.4 on the test. Theses numbers indicate that the diagnostic test has excellent predictive value on performance of students in Calculus A. The predictive value is a bit less in Calculus B with 72% of those who finished the course getting 4.6 or higher on the diagnostic test while 74 % of those who did not finish got lower than 4.6 on the test. The numbers are lower for Calculus C where 66% of those who finished the course got 3.0 or higher on the diagnostic test while 71 % of those who did not finished were below the cutoff. This means that one student out of three that finishes Calculus C the same year they took the diagnostic test were poorly prepared but managed to catch up and pass the course. A - cutoff = 7.4
Above cutoff Below cutoff P
B - cutoff = 4.6
passed course
failed course
passed course
failed course
39 (0.80) 10 (0.20)
5 (0.15) 28 (0.85)
292 (0.72) 114 (0.28)
60 (0.26) 173 (0.74)
49
33
406
233
C - cutoff = 3.0
Above cutoff Below cutoff P
passed course
failed course
204 (0.66) 106 (0.34)
98 (0.29) 240 (0.71)
310
338
Table I.5: Classification of students according to performance on diagnostic test (rows) and final exams (columns). The fractions are calculated with respect to performance on final exams.
I.4
Discussion and conclusions
A diagnostic test in mathematics was administrated to first year students in SENS, UI, annually from 2011 to 2014. The students were registered in three courses; Calculus A (theoretical), B (mix of theory and applications) and C (mainly applications). The students’ responses to background questions were very different between the three courses. The grades on the test were generally low and differed considerably between the three calculus courses. The average grades in the three courses were x ¯A = 6.51, x ¯B = 4.87 and x ¯C = 3.11. The
Chapter I The performance of first year students in the University of Iceland on a 76 diagnostic test of basic mathematical skills
students did on average best in Arithmetic and functions and worst in Differentiation and integration. An ANOVA model was fitted to the data and the background variables; secondary school, gender, course, year of diagnostic test, months since last mathematics course, number of mathematics courses, and the students’ perception on how well they did in mathematics in secondary schools and how well they are prepared were found to be linked to the grades on the diagnostic test. 69% of the total variability in grades was explained by the model. The difference in estimated effect sizes of schools and the students’ perception on how well they did in secondary school were the largest. A small decline in grades between 2011 and 2014 was detected. Also, the difference in effect sizes in the variables gender, months since last mathematics course and number of mathematics courses were relatively small. However, when mean grades were calculated by e.g. number of semesters in secondary schools the difference was found to be large. This contradiction can be explained by the unbalanced nature of the data. The students having 8 semesters of mathematics in secondary school mainly come from two schools; the one with the highest scores on the test and one with very low score. The student group from the school with the highest score is much larger than the one with the low score thus pulling the mean value up. The IMEs (a school leaving exam after four years of secondary schools) is not standardized so no standardized measure is available on how well the students performed in school before starting at SENS and therefore it is impossible to correct for that in the model. This should be kept in mind when the large difference between the schools is looked at. The student groups in these schools are known to be very different as well as the schools’ opportunities to offer elective mathematics courses because of their size. It is therefore not possible to conclude weather this large difference in schools is due to the quality of education provided, difference in student groups choosing these schools or some other factors that can affect the schools’ ability to provide their students with good mathematics education. The predictability of the diagnostic test on the students’ performances in the first year calculus courses was investigated. The sensitivity of the test was 0.80, 0.72 and 0.66 for Calculus A, B and C respectively and specificity as 0.85, 0.74 and 0.71. Thus, the predictability of the exam is highest for performance in Calculus A, a bit less in Calculus B and lowest for Calculus C. This indicates that poorly prepared students will have a very hard time in Calculus A with only 1 out of 5 of those that passed the final exam failing
I.4 Discussion and conclusions
77
the diagnostic test. However, in Calculus C, 1 of 3 of those that passed the final exam failed the diagnostic test but managed to catch up. Therefore, the transition from secondary school mathematics to university for poorly prepared students seems to be most difficult for students in Calculus A. This does not come as a surprise since much deeper understanding of the subject is required in Calculus A than in secondary schools and with poor basic understanding of mathematics it becomes difficult to fill that gap. As noted in the introduction, poor basic knowledge in mathematics of students in introductory courses in calculus is a worldwide problem. Universities have addressed the underpreparedness of their incoming students in various ways such as with bridging programs (Varsavsky, 2010), parallel support tutorials (Gill et al., 2010) and summer programs (Kajander & Lovric, 2005; Tempelaar, Rienties, Giesbers, & van der Loeff, 2012). In the University of Amsterdam, first year students take a diagnostic test at the beginning of the semester and in the first weeks of Calculus 1, four sessions of two hours are used to practice basic mathematics in the hope that students manage to brush up their mathematical knowledge and skills. In the fifth week there is another test and students doing poorly are supposed to participate in a remedial mathematics course taught by third-year mathematics students. Students have shown substantial progress after the four weeks (Heck & Van Gastel, 2006). Also, at the University of Sidney, Rylands and Coady (2009) argue that underprepared students must be provided extra assistance in a form of preparatory course which is more substantial than 1 or 2 week bridging courses. At-risk students are asked to take a diagnostic test at the beginning of their studies and those who do not reach the required standard are enrolled in the preparatory course. The students should pass the course before attempting the standard first-year mathematics course. How to address the fact that large proportion of first year students in the SENS are poorly prepared has been discussed extensively with the following three methods often named: 1. Encourage students to use the summer to prepare. 2. Entrance requirements. 3. Entrance exam. In the spring 2014 an on-line learning environment the tutor-web (Jonsdottir, Jakobasdottir, & Stefansson, 2015; Stefansson, 2004) was used to try out the first method. Around 1000 exercises designed to train basic mathematical skills are available in the system, divided into 12 topic-based categories. The idea
Chapter I The performance of first year students in the University of Iceland on a 78 diagnostic test of basic mathematical skills
was that the students could use the exercises to see what level of mathematics knowledge is expected in the beginning of their studies and to check where they stand. Then, if the background is lacking the students could spend time practising before starting their studies in the fall. In May 2014, an email was sent to all students registered to start their studies in SENS in August. The students were encouraged to work in the learning environment before starting their studies and three times during the summer they were invited to a open house in SENS’s premises where they could get help from second and third year students. Unfortunately, the students did not respond to the encouragement. Out of the around 900 recipients, 105 logged into the learning environment. None of the students tried out all the topics as was advised and most of the 105 students answered questions from only two categories. When the students were offered to come to SENS’s premises and get help, only 10-15 students accepted the invitation. After the summer 2014, it was concluded that this approach needs to be reconsidered. Whether to use an entrance exam to sort out students that do not have sufficient skills in basic mathematics is now being debated at SENS. Using an entrance exam will probably largely eliminate the problem of having poorly prepared students enrolled in SENS’s study programs but there is also a risk of loosing students that could perform well in their studies. Looking at the performance of students in Calculus C, one of every three students that finished the course on time was poorly prepared but managed to catch up and pass the course. A part of this group might have failed an entrance exam or lacked the courage to take one. The results of the diagnostic exam provide valuable insight into mathematics skills of university entrants in Iceland. The results have been presented to SENS’s staff members to make them aware of the situation and hopefully increase their understanding of the difficulties a large proportion of first year students are facing. Lecturers in SENS’s calculus courses are also handed the results of their students giving them the opportunity to rethink their teaching methods in accordance to their students’ skill level. The results have likewise been presented to secondary-school teachers and schoolmasters resulting in an extremely valuable dialogue between mathematics teachers working within the two school levels. Hopefully this dialogue will increase the cooperation between teachers at secondary school and university levels to reach a common goal of strengthening mathematics education in Iceland.
I.4 Discussion and conclusions
79
Acknowledgement The authors would like to thank the number of teaching assistants who helped grading the diagnostic tests. They will also like to thank Guðrún Helga Agnarsdóttir and Sigdís Ágústsdóttir for their help in gathering data form the UI’s student registry.
Chapter I The performance of first year students in the University of Iceland on a 80 diagnostic test of basic mathematical skills
Appendix Some of the problems, along with the students’ results, will be included in the published version of this paper.
II Paper II From evaluation to learning: Some aspects of designing a cyber-university. Anna Helga Jonsdottir & Gunnar Stefansson.
81
Chapter II 82
From evaluation to learning: Some aspects of designing a cyber-university
Abstract Research is described on a system for web-assisted education and how it is used to deliver on-line drill questions, automatically suited to individual students. The system can store and display all of the various pieces of information used in a class-room (slides, examples, handouts, drill items) and give individualized drills to participating students. The system is built on the basic theme that it is for learning rather than evaluation. Experimental results shown here imply that both the item database and the item allocation methods are important and examples are given on how these need to be tuned for each course. Different item allocation methods are discussed and a method is proposed for comparing several such schemes. It is shown that students improve their knowledge while using the system. Statistical models which do not include learning, but are designed for mere evaluation, are therefore not applicable. A corollary of the openness and emphasis on learning is that the student is permitted to continue requesting drill items until the system reports a grade which is satisfactory to the student. An obvious resulting challenge is how such a grade should be computed so as to reflect actual knowledge at the time of computation, entice the student to continue and simultaneously be a clear indication for the student. To name a few methods, a grade can in principle be computed based on all available answers on a topic, on the last few answers or on answers up to a given number of attempts, but all of these have obvious problems. Key words: Open access; computer-assisted learning; item allocation algorithm; grading schemes; item design
II.1 Background
II.1
Background
II.1.1
The tutor-web project
83
The project and results described in this paper are parts of a large R&D project in web-assisted education, where the intent is not to replace instructors but to investigate the use of web-based systems along with traditional means of instruction. The overall project addresses the following issues: • a shortage of experienced educators in mathematics and statistics • a lack of implemented standards for education (baseline outputs) in mathematics and statistics • a lack of applied statistics courses for researchers and students in other fields. The approach taken in the project includes the following components: • design freely available web-based material to degrees in mathematics and applied statistics • allocate personalized drill items using an IAA (item allocation algorithm) • invoke the student’s incentive for a high grade using a GS (grading scheme) The primary research question addressed by the project is the search for the best item allocation algorithm or how one can best select the next drill item for the student, with the grading scheme a close second. Many systems are available to instruct on specific topics and considerable research has been conducted on how to fine-tune presentation of material or drills on specific topics. The system described here and to be designed further is generic and uses mostly multiple-choice drill items, but these are delivered in a specialized manner and can be tuned to any field of interest. Results in this paper pertain to various design issues in such open systems, both in terms of how the item database needs to be designed and how item allocation must proceed in order to take into account the student’s progress while using the system.
Chapter II
1.0
From evaluation to learning: Some aspects of designing a cyber-university
0.2
0.4
0.6
0.8
a = 0.2 a= 1 a = 1.8
0.0
Probability of correct response
84
−3
−2
−1
0 θ
1
2
3
Figure II.1: The three-parameter logistic model with varying a, b = 0.3 and c = 0.2
II.1.2
Computerized adaptive testing
The field of computerized testing has been around for a number of decades. Item response theory (IRT) (Lord, 1980) has been used to design, analyse, and grade computerized tests of abilities. The data here are binary responses to each item and such data are commonly analysed with logistic regression models. The three-parameter logistic model is often used to link the probability of a correct answer to the students ability Psi = P (Ysi = 1|θs ; ai , bi , ci ) = ci +
(1 − ci ) 1 + exp{−ai (θs − bi )}
(II.1)
where Ysi is the score of the s-th student to the i-th item, θs is the student ability parameter, ai is the item discriminant parameter, bi is the item difficulty parameter and ci is the item guessing parameter. Setting ai = 1 and ci = 0 results in the popular Rasch model. Common item-selectors include simple random selection and Point Fisher Information where the “most informative” item for this student is chosen. Information is then measured by the Fisher Information "� I(θ) = E
�2 # δ log L(θ) , δθ
II.2 The tutor-web
85
where L(θ) is the likelihood (function of ability) for fixed values of item parameters. This results in the item information function Ii (θ) =
Pi0 (θ)2 . Pi (θ)(1 − Pi (θ))
For the three-parameter model the item information function is Ii (θ) = a2i ·
1 − Pi (θ) (Pi (θ) − ci )2 · . Pi (θ) (1 − ci )2
The focus in CAT (Wainer, 2000) and IRT is to measure abilities and the item selection methods were developed for that purpose. Since the CAT methods do not account for learning in a dynamic environment, new models and item selectors need to be developed for the purpose of increase learning. The need for this becomes apparent as models are fitted to actual data, as seen below.
II.2
The tutor-web
Figure II.2: The tutor-web main page.
The tutor-web, used in the experiments described here, is a freely accessible web-based resource (structured like a cyber-university) which has been used for computer-assisted education in mathematics and statistics and research on education. Needless to say, the tutor-web is not the only such system. Several types of educational systems exist including the learning management system
Chapter II 86
From evaluation to learning: Some aspects of designing a cyber-university
(LMS), learning content management system (LCMS), virtual learning environment (VLE), course management system (CMS) and Adaptive and intelligent Web-based educational systems (AIWBES). The LMS is designed for planning, delivering and managing learning events, usually adding little value to the learning process nor supporting internal content processes (Ismail, 2001). A VLE provides similar service, adding interaction with users and access to a wider range of resources (Piccoli, Ahmad, & Ives, 2001). The primary role of a LCMS is, however, to provide a collaborative authoring environment for creating and maintaining learning content (Ismail, 2001). Adaptive and intelligent Web-based educational systems (AIWBES) use a model of the goals, preferences and knowledge of each student to adapt to the needs of that student (Brusilovsky & Peylo, 2003) in contrast to many systems which are merely a network of static hypertext pages (Brusilovsky, 1999). AIBWBES systems tend to be subject-specific because of their structural complexity and therefore do not provide a broad range of content. The tutor-web (at http://tutor-web.net) is an open and freely accessible AIWBES system, available to students and instructors at no cost. The system has been a research project since 1999 and is completely based on open source computer code with material under the Creative Commons AttributionShareAlike License. The material and programs have been mainly developed in Iceland but also used in low-income areas (e.g. Kenya). Software is written in the Plone1 , CMS (content management system), on top of a Zope2 Application Server. Educational material is mainly written in LATEX. Examples and plots are mostly driven by R (R Core Team, 2014). In terms of internal structure, the material is modular, consisting of departments (e.g. math/stats), each of which contains courses (e.g. introductory calculus/regression). A course can be split into tutorials (e.g. differentiation/integration), which again consist of lectures (e.g. basics of differentiation/chain rule). Slides reside within lectures and may include attached material (examples, more detail, complete handouts etc). Also within the lectures are drills, which consist of multiple-choice items. These drills/quizzes are designed for learning, not just simple testing. The system has been used for introductory statistics(Stefansson, 2004), mathematical statistics, earth sciences, fishery science, linear algebra and calculus (Stefansson & Jonsdottir, 2015) in Iceland and 1 http://plone.org 2 http://zodb.org
II.3 Some system design considerations
87
Kenya3 , with some 2000 users to date. The whole system is based on open source software and the teaching material is licensed under the Creative Commons Attribution-ShareAlike License4 . An important part of the system are the interactive drills where the emphasis is on learning rather than evaluation. A student can continue requesting drill items until a satisfactory grade is obtained. The grade is currently calculated as the average of the last 8 questions per lecture in the current version of the system, but alternatives are considered below.
II.3
Some system design considerations
II.3.1
Item allocation
In the first version of the tutor-web system, items were allocated with uniform probability to students. It is reasonably clear this is not optimal. In particular this does not guarantee that a beginner first sees “easy” items nor that a student who completes the lecture or course has had to answer the most difficult items as a part of the way towards a high grade. Development has therefore focused on implementing the certain item allocation rules within the system: • select easy questions in the beginning • increase item difficulty as the grade increases • select, with some probability, questions the student has done incorrectly in the past • select, with some probability, questions from old material to refresh memory. Figure II.3 gives one implemented development of the probability mass function (pmf), as a function of item difficulty. The panels indicate how the pmf varies as a function of the student’s grade. This simple approach alone implements a personalized approach to the drills and it satisfies several important criteria, first by starting with easy items and second by ensuring that a student does not leave with a high grade without answering difficult items. 3 http://tutor-web.tumblr.com/post/59494811247/web-assisted-education-in-kenya 4 http://creativecommons.org/
Chapter II 88
From evaluation to learning: Some aspects of designing a cyber-university
0.15 0.00
Probability
pmf for questions − student with low grade
0
10
20
30
40
50
Difficulty
0.15 0.00
Probability
pmf for questions − student with intermediate grade
0
10
20
30
40
50
40
50
Difficulty
0.15 0.00
Probability
pmf for questions − student with top grade
0
10
20
30 Difficulty
Figure II.3: Possible development of a pmf for questions as grade develops.
II.3.2
Item database design
When designing the item database, several aspects need to be looked into. Consider for the moment three-parameter logistic model given by equation II.1 and shown in Figure II.1. One aspect of item design is to design items which classify students. Each item should therefore have a steep slope and they should have different midpoints.
II.3.3
Grading and other issues
The grading scheme itself can be defined in many ways. In the present setup the average grade for the previous 8 answers is used as a “lecture grade”.
II.4
Case studies
The tutor-web has been used for teaching mathematics and statistics to students of mathematics, biology, geography and tourism with considerable student satisfaction (Stefansson, 2004). In a recent survey of 60 students using the tutor-web, 53 of the students indicated that they had less difficulty answering the last questions in a drill session than the first and all of the students answered “yes” to the question “I learn by taking quizzes in the tutor-web,” in accordance with the numerical results from this study. By the time the survey was administrated, items were allocated to students with equal probability (not
II.4 Case studies
89
using the pmf shown in Figure II.3). The tutor- web system has been routinely used in two large courses at the University of Iceland, with considerable differences in the implementations. An introductory applied calculus course is given annually to science majors, with over 400 students entering each fall semester. The second course in this case study is an applied introductory statistics course, with over 200 entrants each spring semester. In both courses the principles of use are the same: The tutor-web is used as a support for regular instruction, complementing homework and mid-term exams. The tutor-web is intended primarily as a learning tool, but the tutorweb grade also counts towards the course grade in both courses. In each case, the tutor-web “lectures” contain at least questions and the students are required to answer questions from each such “lecture”. The tutor-web “lecture” should be thought of as a container for material and does not need to reflect an actual lecture in a lecture hall, but may do so. Surveys have been given to students in these and other courses. The general responses are overwhelmingly positive on all measurements. Interestingly, most students prefer a combination of web-based and traditional homework. The implementation in the calculus course is to have the tutor-web mirror the course lectures. Thus the tutor-web “lectures” inside the tutorials5 are almost exactly the same as the lectures given by the instructor. The implementation in the statistics course is to have only a handful of tutor-web “lectures”, which then correspond to larger blocks of material, each of which typically covers at least one week of material. These different approaches have been taken in accordance with different emphases in the two courses. In calculus the students are expected to return tutor-web “homework” every week, whereas the statistics students use the tutorweb as a tool for practice only at specific time points during the semester. In the latter case the tutor-web is also used for formal experiments since different subgroups of the students take turns at using the tutor-web or using traditional homework. In the case of the introductory calculus course, the students are typically required to answer 8 questions correctly for each 45 minute lecture, 4 times per week. In the applied statistics course, the students are required to answer 20 questions correctly from each tutor-web “lecture”. In neither case do these correct answers need to be in sequence, and the grade has traditionally been 5 at
http://www.tutor-web.net/tutor-web/math/math104
Chapter II 90
From evaluation to learning: Some aspects of designing a cyber-university
computed based on the last 8 answers. However, this implies that enthusiastic students who have obtained full marks now risks a reduced grade if they continue to use the tutor-web for practice. Similarly it has been found that students who give 7 correct answers in a sequence followed by an incorrect answer have a tendency to stop since they now need to answer 8 questions correctly in order to increase their grade in the lecture. Both of these properties of using the last 8 answers are fairly obvious once they have been noticed, but the effect counters the original aim of the system to be for learning, not just testing, i.e. to be designed as a formative assessment tool. Students have therefore commonly been given the option to continue, but retaining the highest marks obtained during any 8-answer sequence (computed outside the system based on the database of responses). Although this is an adequate solution in the case of full marks, this is not quite satisfactory for students with intermediate marks since the probability of getting into the intermediate range of grades by guessing becomes quite high. Future research therefore needs to investigate various other tapering schemes. From the above setup it is seen that within the calculus course the students typically have to answer 32 questions correctly per week in order to satisfy the full requirements for the course. This is considerable, but then again, even the earliest result showed that there was considerable gain from using a system such as this one (Stefansson, 2004) and this is also described below.
II.5
Analyses and results
The data used in the following section was gathered in 2011 in the applied introductory statistics course described above. Items were allocated to students with uniform probability that year, not using the probability mass function shown in Figure II.3.
II.5.1
Some experimental results
The most important part of the tutor-web is the drilling system, the whole point of which is to induce learning, rather than merely to evaluate. It is seen in Figure II.4 that the mean grade to a question increases as the students see more questions, as is to be expected. Although this does not automatically imply understanding, it does imply that student knowledge changes during the use of the system. From this it follows that the usual IRT models do not apply
II.5 Analyses and results
91
1.0
Average grade
0.9
0.8
●
● ●
●
●
0.7
●
● ● ●
●
●
●
● ●
● ●
●
●
●
0.6
●
●
●
●
● ●
●
● ●
●
●
0.5 0
10
20
30
Number of questions answered
Figure II.4: Grade development based on averages across 162 students in an introductory statistics course.
to the present setup, nor do any conceptual models or frameworks designed only for testing purposes.
II.5.2
Model results
An alternative to the commonly used IRT model (Eq. II.1) including parameters measuring learning was fitted to the data. The final fitted model, based on retaining statistically significant variables becomes: � log
p 1−p
�
= β0 + β1 · rankdiff + β2 · numseen + β3 · numseen2 +
(II.2)
β4 · numseen3 + β5 · natt + β6 · natt2 + sid, where rankdiff is the ranked difficulty of the question (at the time of analysis), numseen is the number of times the particular question has been answered (seen) by the student, natt is the total number of attempts the student has made at questions in the lecture, and sid is the student id. It should be noted that the fitted equation II.2 is quite different from the usual IRT equation II.1 since the fitted equation takes learning into account. This is done by explicitly stating the number of times an item has been seen as well as the number of questions requested. The two-parameter Rach model only incorporates the first and last terms in equation II.2, but the remaining parameters are also statistically significant and therefore also needed to explain the data at hand.
Chapter II 92
From evaluation to learning: Some aspects of designing a cyber-university
Expected grade vs number of times this question is seen
0.55
0.80
Grade
●
●
1.5
2.0
2.5
3.0
3.5
4.0
35
40
45
50
55
Total number of answers
Expected grade vs ability for different ranking of difficulty
Expected grade vs ability for different number of attempts
Grade
0.0
0.4 0.0
60
1 2 3
0.8
10 40 70
0.8
30
Number of times seen
0.4
1.0
Grade
0.65
0.90
0.75
●
●
Grade
Expected grade vs total number of answers
−5
−4
−3
−2
−1
0
Ability
1
2
−5
−4
−3
−2
−1
0
1
2
Ability
Figure II.5: Top panels: Model predictions of average grade as a function of (a) the number of times a question is seen and (b) the total number of answers given. Bottom panels: (c) expected grade as a function of ability and (d) expected grade as a function of ability, for different numbers of attempts at the question. The density shown in the lower panels indicates the distributions of estimated student ability.
II.6
Discussion
II.6.1
Item allocation
It is easy to envisage other item allocation algorithms then the one shown in Figure II.3. These might for example move in other ways from an emphasis on easy to difficult items. This applies (a) to the shape of the intermediate probability mass functions, (b) to the way the mean difficulty in the pmf relates to the grade (which might be nonlinear) and (c) how the difficulty is computed (which is based on ranks here but could use e.g. a Rasch model or other glmm). Each such change is expected to have some effect, but of course it is also expected to be secondary to the primary effect of having some personalized allocation scheme.
II.6 Discussion
93
The important design issue here and below is the following: Any item allocation algorithm has parameters (e.g. the steepness of the limbs of the pmf) and these can be varied, e.g. from one lecture to the next. The effects of these parameters, e.g. on learning can then be estimated and this can be used as a guide to further developing the system. What this implies is that the on-line learning system is being transformed from a pre-specified ad-hoc educational system to a platform for evidence-based decisions on how to transition towards optimal design of a system for learning.
II.6.2
Item database design
Consider for the moment the 3PL in Figure II.1. One aspect of item design is to design items which classify students. Each should therefore have a steep slope and they should have different midpoints. For the data considered here, however, Figure II.5 indicate that the student ability distribution lies quite far to the right on the scale, when compared to the difficulty of easy items, but matches the mid-point of the most difficult items considered here. The last panel of Figure II.5 demonstrates how the distribution of ability is too far to the right compared to the mean difficulty of items recieved in the first attempt within a lecture. However, as the number of attempts increase, the student’s ability increases (panel a) and this leads to an upwards shift in the expected grade as see in panel d.
II.6.3
Grading and other issues
Many alternate grading schemes could be designed in order to entice the student to continue. These include a longer or expanding tail (i.e. more than 8, e.g. max(8, n/2) where n is the number of attempts) and/or tapering, where the most recent answers get more weight in the average. Finally, timeout options do not exist within the tutor-web as presented here. It would be an interesting experiment to investigate how different timeout functions affect student behavior.
Chapter II 94
II.7
From evaluation to learning: Some aspects of designing a cyber-university
Summary
Overall, it is seen that student behavior and corresponding model results are quite different for the on-line student in a learning environment, as compared to a student in a testing environment. This leads to new considerations and research on how these dynamic environments can be designed so as to maximise student learning as opposed to just estimating student knowledge with a high degree of precision. It is a fundamental issue that a system for learning should also be designed in such a way that it provides the data needed to improve the system itself. This continues to be a goal of the tutor-web system, where each design choice is intended to be in the form of parametric functions. The parameters of these functions can then be varied and the effects on learning or student behavior measured. Once this is done, rational choices can be made on parameter settings. Results to date indicate that several of these design issues drastically affect student behavior and therefore most likely also have an important effect on overall student learning. What is needed is a combination of several approaches. For example, the item allocation algorithm needs to take into account both the item difficulty level and link this to the student’s dynamic ability. The simples such approach is merely to increase the mean difficulty of items as the grade increases, as is done in Figure II.3. Also, the item design needs to ensure that even the best students will, at the peak of their learning, still recieve difficult items, as measured on their personalized scale. These items are much more difficult than could possibly be administered randomly to a random group of students. Given that it is the overall effect which is important, not the IAA or GS in isolation, it is important to tweak these various parameters judiciously and experimentally. It is particularly important not to assume that parameter values (or any part of the design) can be permanently fixed.
II.7 Summary
95
Acknowledgements The tutor-web project has been supported by the University of Iceland, the United Nations University the Icelandic Ministry of Education and the Marine Research Institute in Reykjavik. Numerous authors have contributed educational material to the system. The system is based on Plone material is mainly written in
6
and educational
LAT
EX. Examples and plots are mostly driven by R (R Core Team, 2014). The version of the tutor-web described here was mostly implemented by Audbjorg Jakobsdottir but numerous computer programmers have contributed pieces of code during the lifetime of the project. Preliminary analyses in this work were first presented at EduLearn11.
6 http://www.plone.org
Chapter II 96
From evaluation to learning: Some aspects of designing a cyber-university
III Paper III Development and use of an adaptive learning environment to research online study behaviour Anna Helga Jonsdottir, Audbjorg Jakobsdottir & Gunnar Stefansson.
97
Chapter III 98
Development and use of an adaptive learning environment to research online study behaviour
Abstract This paper describes a system for research on the behaviour of students taking online drills. The system is accessible and free to use for anyone with web access. Based on open source software, the teaching material is licensed under a Creative Commons License. The system has been used for computer-assisted education in statistics, mathematics and fishery science. It offers a unique way to structure and link material, including interactive drills with a purpose of increasing learning rather than mere evaluation. It is of interest to investigate what affects how students learn in such an environment, for example how the system entices students to continue to work. One research question is therefore: When do learners decide to stop requesting drill items? A case study has been conducted including 316 students in an undergraduate course in calculus. Analysis of the data showed that the probability of stopping increases with higher grades but decreases with increased difficulty and the number of questions answered. Also, the probability of stopping decreases if the last question was answered correctly in comparison to when the last question was answered incorrectly. Keywords: Web-based education, Statistics education, IRT, AIWBES, The tutor-web.
III.1
Introduction
With the increasing number of web-based educational systems and learning environments several types of systems have emerged. These include the learning management system (LMS), learning content management system (LCMS), virtual learning environment (VLE), course management system (CMS) and Adaptive and intelligent web-based educational systems (AIWBES). The terms VLE and CMS are often used interchangeably, CMS being more common in the United States and VLE in Europe. The LMS is designed for planning, delivering and managing learning events, usually adding little value to the learning process nor supporting internal content processes (Ismail, 2001). A VLE provides similar service, adding interaction with users and access to a wider range of resources (Piccoli et al., 2001). The primary role of a LCMS is to provide a collaborative authoring environment for creating and maintaining learning content ismail2001design. Classes
III.1 Introduction
99
taught on these platforms are accessible through a web-browser but are usually private, i.e., only individuals who are registered for a class have access to the password-protected website. A number of content providers can be found on the web. Even though they are not educational systems per se, linking them to learning systems would make the content available to a larger audience and save work on creating material within the learning systems. Examples of existing content providers are Khan Academy and Connexions. A number of academic institutions have also made educational material available, including MIT OpenCourseWare and Stanford Engineering Everywhere. Many systems are merely a network of static hypertext pages (Brusilovsky, 1999) but adaptive and intelligent web-based educational systems (AIWBES) use a model of each student to adapt to the needs of that student (Brusilovsky & Peylo, 2003). These systems tend to be subject-specific because of their structural complexity and therefore do not provide a broad range of content. The first AIWBES systems were developed in the 1990s. These include ELMART (Brusilovsky, Schwarz, & Weber, 1996; Weber, Brusilovsky, et al., 2001) and the AHA! system (De Bra & Calvi, 1998). Since then, many interesting systems have been developed, many of which focus on a specific subject, often within computer science. Examples of AIWBES systems used in computer science education are SQL-Tutor (Mitrovic, 2003), ALEA (Bieliková, 2006), QuizGuide (Brusilovsky & Sosnovsky, 2005; Brusilovsky et al., 2004) and Flip (Barla et al., 2010) which includes an interesting way of allocating quiz questions to students (discussed further in the following section). AIWBES systems can be found in other fields such language teaching (Chen, Lee, & Chen, 2005; Heift & Nicholson, 2001) and teaching modelling of dynamic systems (Zhang et al., 2014) to name some. Systems including competitive web-based drill games are also available, with an overview presented in González-Tablas, de Fuentes, Hernández-Ardieta, and Ramos (2013). The goal of the project described here is to build an AIWBES including the functionalities of an LCMS. The system should be open to everyone having access to the web and provide broad educational content including interactive drills with the primary purpose of enhancing learning. Intelligent methods will be used for item allocation in drills and for directing students toward appropriate material. As discussed in Romero and Ventura (2007), great possibilities lie in the use of educational datamining. The behaviour of the students in the system are logged so the system provides a testbed for research on web-assisted
Chapter III 100
Development and use of an adaptive learning environment to research online study behaviour
education such as drill item selection methods. It has been described earlier how students tend to strive for higher grades in similar systems (Stefansson, 2004). The present paper considers these drivers more explicitly, namely how the student behaviour, including stopping times, reflects their achievements and likely immediate performance, as predicated by system design.
III.2
Item allocation in educational systems
Numerous educational systems with different functionality are available today as discussed in the previous section. The majority permits the creation of quiz questions and administration of quizzes for evaluation or to enhance learning. In most systems these quizzes are static, where the instructor has chosen a fixed set of items. In some cases items are selected randomly from an available question pool so that students are not all presented with the same set of questions. In this section, methods for allocating quiz questions or drill items to learners are discussed. Although there are a number of educational web-based systems that use intelligent and/or adaptive methods for estimating learner’s knowledge in order to provide personalized content or navigation (Barla et al., 2010) only a few systems use adaptive and/or intelligent methods for item allocation (adaptive item sequencing). Even though adaptive item sequencing is not common in educational systems it has been used in Computerized Adaptive Testing (CAT) (Wainer, 2000) for decades. In CAT the test is tailored to the examinee’s ability level by means of Item Response Theory (IRT). IRT (Lord, 1980) is the framework used in psychometrics for the design, analysis, and grading of computerized tests to measure abilities. It has been used extensively in CAT for estimating students abilities. Within the IRT framework, several models have been proposed for expressing the probability of observing a particular response to an item as a function of some characteristic of the item and the ability of the student, the Rasch model being a common one (Wright, 1977). Another, slightly more complicated model, is the three parameter logistic model, or the 3PL model, including a difficulty parameter β, a discrimination parameter α and a guessing parameter c. The Point Fisher Information (PFI) is then used to select the most informative item in the pool, that is the item that minimises the variance in the ability estimate. Using IRT, a test developer is able to have items that can discriminate students along a continuum of the
III.3 System Description
101
hypothesized latent construct. However, IRT requires a large sample size for item calibration (i.e., getting estimates for the parameters of the model) and thus it is typically not done in the classroom. As an example of a system using this technique is the SIETTE system (Conejo et al., 2004), a web-based testing system (i.e., not used for learning purposes). Research on the application of IRT in learning environments is largely absent Wauters, Desmet, and Van Den Noortgate (2010). Review of available literature found only one system using IRT for adaptive item sequencing with the main focus on enhancing learning, the web-based programming learning system Flip (Barla et al., 2010) developed within the PeWePro1 project (Bieliková & Návrat, 2009). The system uses, among other methods, IRT to select questions with adequate difficulty using the 3PL model, but the parameters (α and β) are set manually for each question. Experiments using Flip showed remarkable improvements in test results (Barla et al., 2010).
III.3
System Description
The tutor-web system has been designed by considering four major requirements: • to be open source and generic, not topic-specific • to provide a wide range of open content through a web browser • to use intelligent methods for item allocation (and grading), amenable to research • to function as a LCMS The system has been in development for several years. A pilot version, written only in HTML and Perl, is described in (Stefansson, 2004). The new implementation described below incorporates fresh approaches to individualized education. It is written in Plone (Nagle, 2010) which is an open source content management system with a usability focus, written in Python on top of the ZODB object database. Plone is flexible, customisable and extended with packages from a worldwide community. It is popular with educational content providers, powering Connexions (http://cnx.org/), MIT’s OpenCourseWare (http://ocw.mit.edu/) as well as many university OpenCourseWare projects, based on the eduCommons (http://educommons.com/) system.
Chapter III 102
Development and use of an adaptive learning environment to research online study behaviour
The educational material available within the tutor-web covers wide areas within mathematics and statistics, although only one course is analysed in this study. Examples of use in other fields include fishery science, earth science and computer science. The system could equally well be used in fields as diverse as linguistics, religion, psychology and English. This contrasts several systems which address very special skills, some named above. The system offers a unique way to structure and link together teaching material and organize it into manageable units both for instructors and students. A well-defined structure enables instructors to construct, share and re-use material and provides a single repository of teaching material for students minimising time otherwise wasted on imperfect searching and browsing and eradicating any format/incompatibility issues. Additionally, interactive drills have a primary purpose of increasing learning, placing evaluation a distant second. Though the tutor-web is not originally designed as a remote-learning system it can be used as such if desired. The system also provides a testbed for research on web-assisted education such as drill item selection methods. The tutor-web system is based solely on generic formats and open source software to provide unrestricted usage of material by institutions of limited resources without overheads in terms of software or licenses. The teaching material is licensed under the Creative Commons Attribution-ShareAlike License (http://creativecommons.org/) and is accessible to anybody having a webbrowser and web access. Instructors anywhere can obtain free access to the system for exchanging and using teaching material while students have free access to its educational content including self-evaluation in form of drills.
III.3.1
Content Structure
The teaching material is organized into a tree (Figure III.1) with departments, courses, tutorials, lectures and slides. The different departments can be accessed from the tutor-web homepage (http://tutor-web.net). A tutorial typically contains several lectures and should be based on a distinctive topic. A tutorial can belong to more than one course and should be built up around a single theme. For example, a tutorial on simple linear regression could both be a part of a general course on regression and an introductory statistics course. Having the tutorials allows the student to complete a portion of the material and perform self-evaluation based on smaller blocks than a complete course.
III.3 System Description
103
tutor-web
DEPARTMENTS
COURSES
stat
ANOVA
regression
simple
TUTORIALS
LECTURES
math
LS estimates
multiple
residual check
FURTHER INFO SLIDES slide 1 slide 2 slide 3
example
QUIZ QUESTIONS Question 1
detail Question 2 handout Question 3 ref
Figure III.1: The structure of the tutor-web.
The system uniquely uses the modularity and traceability of content so the instructor can easily demonstrate how examples and images are derived: An image based on data can be drawn in the system using the statistical environment R (R Core Team, 2014). Normally such an image is presented statically on a screen for a class. Here, however, the R plotting commands and the data are stored as objects in the system, automatically producing PDF or HTML slides. The student can view the underlying data and R code, making the system an ideal tool to teach not only model output but also modelling. One goal of the tutor-web project is to make available a repository of educational material for a BSc degree in mathematics and a MSc degree in applied statistics. Some courses are ready for general use with slides, handouts and questions while others are only placeholders waiting to be filled up with material. In addition to university courses, complete high school mathematics tutorials in Icelandic and English are available with over 2000 drill items.
Chapter III 104
III.3.2
Development and use of an adaptive learning environment to research online study behaviour
Drills and item selection
Drills (items) are grouped together so they correspond to material within a lecture. These will be termed “drills” rather than “quizzes” to indicate the emphasis on increasing learning. The drills are multiple choice and the author can choose the number of answers and provide detailed explanation of the correct answer shown to the learners after answering a drill. A drill in the tutor-web system differs from the typical classroom testing methods where a student normally answers a given number of questions during a specific time period. In the tutor-web a student can dynamically start or re-enter a drill, one question at a time and may attempt the drill at his/her leisure, although an instructor might decide on a time limit for recording results. The intuitive style of the drill in the tutor-web encourages students to improve their results and learn from their mistakes. The learners are provided with knowledge of correct response feedback after answering a drill along with elaborative feedback if provided by the author of the drill. Studies have shown that frequent feedback given to students yields substantial learning gains (Black & Wiliam, 1998). In live applications the students have been encouraged to request answers repeatedly until a decent grade is obtained. Students who do not know the material can test their knowledge and, upon finding it wanting, go back to the on-line text or textbooks to come back to the drill at a later date. In the original version of the tutor-web system, drill items within the same lecture were selected randomly with uniform probability (Stefansson, 2004). In the current version of the system a probability mass function that depends on the grade of the student is used to select items of appropriate difficulty. Here, the difficulty of a question is simply calculated as the ratio of incorrect responses to the total number of responses. The questions are then ranked according to their difficulty, from the easiest question to the most difficult one. A student with a low grade should have higher probability of getting the lowest ranked questions while a student with a high grade should have higher probabilities of getting the most difficult questions. The mass of the probability function should therefore move towards the difficult questions as the grade goes up. The probability mass functions are shown in Figure III.2 for a lecture with 100 drill items, based on the implemented discrete forms of the beta distribution. Here, beginning student (with a score 0) receives easy items with high probability. As the grade increases the mode of the probability mass functions shifts to the right until the student reaches a top score resulting in high
III.3 System Description
105
Figure III.2: Probability mass functions for item allocation in a lecture with 100 questions.
probability of getting the most difficult items.
III.3.3
Grading
Although the main goal of the quizzes in the tutor-web is learning there is a need to evaluate the student’s performance. The drills are of arbitrary length since the students are permitted to continue to answer questions until they (or the instructor) are satisfied. Because of this, issues regarding how to compute the grade arise. Currently a student gets one point for answering a question correctly and -1/2 for an incorrect answer. Since the purpose is to enhance learning and thus improve the grade, only the last eight answers are used when the grade is calculated for each lecture. Old sins are therefore forgotten. The student can track the grade and thus monitor personal progress with a single click.
III.3.4
Users and access
Four types of users are defined in the tutor-web: Regular users, students, teachers and managers. There is open access for regular users (anybody having access to the web) to browsing and downloading of material. However, in order to take drills the user needs to log in to the system and become a tutor-web student. When a user initially signs up, the requirement is to provide a full name, a valid email address, choose a unique user name and agree to data being used
Chapter III 106
Development and use of an adaptive learning environment to research online study behaviour
Figure III.3: Different views into the database of teaching material in the tutor-web.
for research purposes. Teachers are editors of tutorials and have the ability to edit and insert material as well as quizzes. They also have access to drill results. Managers have the same privileges as instructors with the additional authority to add and edit Departments and Courses and give teacher rights.
III.3.5
Viewing and adding material
Viewing educational material There are three different ways for a tutor-web user to view the teaching material (Figure III.3): 1. through a web browser 2. as a collection of lecture slides 3. as a tutorial printout The first approach is the simplest one for a student wising to access the educational material. The student simply needs to open the home-page (http://tutorweb.net) and select the department of the subject he wishes to study. He then has access to several courses that contain several tutorials and lectures. The
III.3 System Description
107
student can now enter a lecture and browse through the material slide by slide. Links are provided to additional material attached to the slide (examples, references, ...) if any. A user can for example enter the Math department, click on Computing and calculus for applied statistics (course), Some notes on statistics and probability (tutorial), Multivariate probability distributions (lecture) and Joint probability distribution (slide). Once "in" a lecture, a PDF document can be downloaded including all the slides for the lecture. These PDF slides are made with the LaTeX package Beamer (Tantau, Wright, & Miletić, 2013) and should be ready for classroom use. A third way of viewing material is on the tutorial level. Users can download a PDF document including all lectures belonging to that tutorial. Each slide is presented as a figure in this document along with all additional material attached to them providing a handout including all relevant information. In a fully developed tutorial this corresponds to a complete textbook. The tutor-web drills are accessible within a lecture. When entering one, a Drill button appears which opens a new tab with the first question when pushed. After answering the question the correct answer is indicated along with some explanation. An example is shown in Figure III.4. The question is taken from a basic course in statistic. The material belonging to that course can be found by choosing the Stats department from the welcoming screen and from there Introductory statistics. Adding material and content formats Teaching material can easily be added to the system through a web-browser. It is important that text-based content as well as mathematical equations and figures are correctly displayed and easily manipulated in a standard browser. To achieve this several predefined content formats are permitted within the system. Managers can create departments and courses from the tutor-web homepage. After entering a department teachers can create tutorials that then are linked to one or more courses. Within a tutorial, teachers can subsequently add lectures and later slides. Departments, courses tutorials and lectures are simply collection of slides so they require little more than a name. After creating a lecture, a tutor-web teacher can create a slide. It can consist of a title and three basic units, the main text, a main figure (graphic) and explanatory text. The format of the main text can be LaTeX (Goossens, Mittelbach, & Samarin, 1994), plain text, or HTML. The figure(s) can be up-
Chapter III 108
Development and use of an adaptive learning environment to research online study behaviour
Figure III.4: Explanation of the correct answer is given after the student answers a question.
loaded files (png, gif or jpeg) or they can be rendered from a text based image format (R-image R (R Core Team, 2014) or Gnuplot (T. Williams & Kelley, 2011)). Additional material can be attached to the slides which is available when viewing the material through a browser and in the tutorial printout. Drill items are grouped together so they correspond to material within a lecture. Questions and answers can be added to the system through a browser or be uploaded from a file. A drill item can have as many answers as desired and there is an option to randomize the order of the answers. The format of the text can be LaTeX or plain text. Questions can therefore include formulas, essential to mathematical instruction. The system also permits the use of the statistical package R (R Core Team, 2014) when a question is generated. This allows the generation of similar but not identical data sets and graphs for students to analyse or interpret. Alternatively, a large body of such items can be generated outside the system and then uploaded. For each item it is possible to put an explanation or solution to the problem along with the question. After a student has submitted his answer the correct answer to the question is displayed along with this explanation.
III.4 Case study
III.4
109
Case study
It is of particular interest to investigate what affects how students learn in a learning environment, such as the tutor-web. How well a system entices students to continue is a particularly important system feature. One research question is therefore: When do learners decide to stop requesting drill items? The learners’ responses to drill items in the tutor-web can be used for research on online learning. In the following, data from 316 students in an undergraduate course in calculus will be used. The students were requested to answer drill items from several lectures covering limits, derivatives, logarithms, integration, sequences and series. Within each lecture the students were required to answer a minimum of eight questions correctly but were allowed to continue as long as they liked, with the final eight answers counting towards their grade in the course. Since all request for items from within a lecture are logged, these appear in a sequence nl = 1, . . . , ml . Data on stopping times can be obtained by looking at the last request of an item from within a lecture, ml , and we define S := Inl =ml as a 0/1-indicator variable. One can now formally test which other variables relate significantly to this stopping variable. The empirical distribution function (edf) of the number of attempts students made within each lecture is given in Figure III.5. Recall that within this system students are free to make as many attempts as they desire. As a result, the distribution is heavily right-skewed. A jump is seen at 8 attempts: Few students stop before 8 attempts but there is a smooth change in the edf from then on.
III.4.1
Finding the drivers
From informal interviews and observations within support sessions that were offered to the students during the course it seems clear that students have a tendency to continue working within this system until the system reports a high grade. This behaviour is confirmed when looking at the data. Table III.1 shows the number of times learners decided to continue requesting drills or decided to stop as a function of the number of correct answers to the last eight items requested within each lecture (the “lecture grade”). As discussed before, only the last eight responses are used to calculate the grade in every lecture and by far, the highest probability (73.3%) is of stopping at the stage when the student has received a full mark (8 out of 8).
Cumulative frequency (%)
100
Development and use of an adaptive learning environment to research online study behaviour
● ● ●● ● ● ● ● ●● ●● ● ● ● ● ●●●● ● ● ● ● ● ● ● ● ● ● ● ● ● ● ● ● ● ● ● ● ● ● ● ● ● ● ● ● ● ● ● ● ● ● ● ● ● ● ● ● ● ● ● ● ● ● ● ● ● ● ● ● ● ● ● ● ● ● ● ● ● ● ● ● ● ● ● ● ● ● ● ● ● ● ● ● ● ● ● ● ● ● ● ● ● ● ● ● ● ● ● ● ● ●
75
●
●
80
●
●
● ● ● ●
●
●
60
● ● ● ● ●
40 ●
●
20
● ● ● ● ● ● ●
0
● ●
●
●
0
●
●
●
25
●
●
●
50
●
●
●
Cumulative frequency (%)
Chapter III 110
● ● ● ● ● ● ●
0 50
100
150
200
250
Number of attempts within a lecture
0
10
20
Number of attempts within a lecture
Figure III.5: Cumulative distribution (%) of the total number of attempts by each student at each lecture. The right panel expands by only considering attempts 1-25. A vertical bar indicates 8 attempts. By far most students (96 %) stop before 50 attempts.
Number of correct answers to the last 8 items 0 1 2 3 4 5 6 7 8
Continue
Stop
Stopping percentage (%)
112 527 2280 6612 13428 20102 22482 17158 1898
1 9 30 69 216 438 981 1710 5220
0.9 1.7 1.3 1.0 1.6 2.1 4.2 9.1 73.3
Table III.1: Stopping percentage (%) as a function of the number of correct answers in the last 8 questions.
Consider next the last response before stopping. Table III.2 classifies all responses into groups depending on whether this was the final answer within a lecture and whether the answer was correct or not. Naturally, most cases are in the middle of a sequence so most of the observations fall into the “Continue”
III.4 Case study
111
Last answer 0 1 Total
Continue 24665 59934 84599
Stop 852 7822 8674
Total 25517 67756 93273
Table III.2: Classification of answers according to whether the last question was answered correctly (1) of not (0) and whether the student continued or stopped.
column. Only about 10% of terminations follow an incorrect response: Unless an incorrect answer follows a long sequence of correct response, it will be beneficial for the student to request another item if the current answer is incorrect (see below). It has been suggested in earlier studies with this sort of grading scheme used here that students may decide to stop early if a run of correct responses is followed by an incorrect answer (Stefansson & Sigurdardottir, 2011). To investigate this, one can consider the fraction of stopping as a function of both the current lecture grade and the most recent grade. This is shown in Table III.3.
last=0 last=1
0 0.9
1 1.5 2.4
2 1.3 1.4
3 0.8 1.4
4 1.0 2.1
5 2.4 2.0
6 5.4 3.9
7 24.7 8.0
8 73.3
Table III.3: Fraction of stopping (%) as a function whether the last question was answered correctly (0) or not (1) and the number of correct answers in the last eight questions. Each number in the table is the percentage of lines when a response within on of the cells was also the last response.
It is seen in Table III.3 that if a run of 7 correct answers is followed by an incorrect answer then the student will in about 25% of all cases decide to stop. This is a perfectly logical result since a student who has a sequence of 7 correct and one incorrect, will need another 8 correct answers in sequence to increase the grade. An improved averaging scheme can be used to alleviate this problem. An algorithm which uses the average of the most recent min(n, 30) grades after n attempts can give the same full grade after 8 correct responses but a single incorrect answer will get much lower weight as more correct answers come in. An even better option could be to use tapering to downgrade old responses. Given the incentive to work towards a high grade (Table III.1), this simple change is likely to alleviate the 25% stopping problem.
Chapter III 112
Development and use of an adaptive learning environment to research online study behaviour
In principle a generalized linear model (assuming a binomial distribution and logit link) can be fitted to the data shown in Table III.1. As can be seen in the table, the relationship between the probability of stopping and the grade is not a linear one. A factor variable with four levels (low grade = 0-2, median grade = 3-5, high grade = 6-7 and top grade = 8) will be used. The results are shown in Table III.4. Here the 0/1 indicator of whether the student stopped is “regressed” against the factor variable grade at that timepoint. The statistical package R (R Core Team, 2014) was used for the analysis.
(Intercept) median grade high grade top grade
Estimate -4.2901 0.2733 1.6002 5.3018
Std. Error 0.1591 0.1634 0.1603 0.1613
z value -26.97 1.67 9.98 32.86
Pr(> |z|) 0.0000 0.0945 0.0000 0.0000
Table III.4: Parameter estimates where the 0/1 indicator of whether the student stopped is “regressed” against the grade at that timepoint.
Although this is a useful approach for estimating effects and obtaining an indication of p-values, assumptions can not be assumed to be completely correct since there will be a subject effect (this is considered below). Looking at the estimates it can be seen that the probability of stopping is increasing with higher grade. The difference in probability of stopping between the low grade (0-2) and the median grade (3-5) is not significant. The difference between the high-grade and the low grade as well as the top-grade and low grade are highly significant. In order to see which other variables are related to the probability of stopping a more complicated model, also including an indicator variable stating if the last answer was correct or not (grade_last), difficulty of the question (diffic) (computed based on the proportion of incorrect responses) as well as the number of attempts (nattl) was fitted to the data. One can see in Table III.5 that these all appear highly significant. Also notice the sign of the parameter estimates; the probability of stopping increases for higher grades but decreases for increased difficulty. Also, the probability of stopping decreases if the last question was answered correctly in comparison to when the last question was answered incorrectly. When estimating an even more complicated model, also including the student effect and the lecture (or content) effect it was found that both factors were highly significant.
III.5 Conclusions and future work
(Intercept) median grade high grade top grade grade_last diffic nattl
Estimate -3.7509 0.3764 1.7813 5.4785 -0.2801 -0.2946 -0.0182
113
Std. Error 0.1645 0.1642 0.1631 0.1656 0.0444 0.1354 0.0010
z value -22.80 2.29 10.92 33.07 -6.30 -2.18 -18.51
Pr(> |z|) 0.0000 0.0219 0.0000 0.0000 0.0000 0.0296 0.0000
Table III.5: Parameter estimates where the 0/1 indicator of whether the student stopped is “regressed” against the grade at that timepoint, grade of last answer, item difficulty and number of items answered.
III.5
Conclusions and future work
These simple analyses clearly indicate how one can potentially improve upon the item database and the grading scheme. Given the strong incentive for students to obtain high grades in this kind of system, it is imperative that the system includes a wide variety of very difficult problems, since clearly students continue well into the most difficult parts of the content. It is also clear from this analysis that the behaviour of the students is affected by the grading scheme used here. The effect of different grading schemes on students’ behaviour are therefore currently under investigation. Instead of using the last eight responses and giving them equal weight an experiment with tapering schemes is being designed where the most recent answers get more weight than older answers. In these experiments the students will be randomly assigned a value that determines how much weight is put on their most recent answer. Before requesting a new drill item the students are told what their grade will be if they answer the next drill item correctly, with the intent of enticing them to continue requesting drill items and learning more. When large weight is given to the most recent answer, and the student answers the item correctly, the student receives an immediate award (large jump up in grade). However if the answer is incorrect the student gets immediate punishment (large jump down in grade). The risk is that the student then stops requesting items but the intent is that information on the potential grade increase will tempt students to continue working within the system. Currently the tutor-web content provider sets up a concept map by structuring the teaching material within a course into tutorials and lectures within
Chapter III 114
Development and use of an adaptive learning environment to research online study behaviour
tutorials, providing a linear and logical learning path with respect to prerequisites. Drill items are grouped within lectures and are chosen according to the learners ability resulting in individualized path of drill items for each learner within a specific topic. One of the goals of the tutor-web project is to link appropriate learning material to the drill items so if a student answers an item incorrectly the student will be pointed towards appropriate material to read. These links will be made to material within the system but it would also be interesting to allow users to provide links to other Creative Commons licensed material outside of the system resulting in a completely individualized learning path through an entire course within the system or even the entire web. The tutor-web is an ongoing research project into the online student’s behaviour. An experiment was made in an older version of the system to assess potential difference in student learning while working in the tutor-web versus students handing in written homework (Jonsdottir & Stefansson, 2011). The difference in learning between the groups was not found to be significant but more importantly the confidence bound for the difference was tight, indicating no difference of importance. This implies that time spent on correcting written assignments can be saved by using the tutor-web as homework instead of some written assignments, potentially making a considerable financial difference. The system is under constant development and these results imply that further improvements in learning through the system will enhance it to become better than traditional assignments. Current research is therefore focused on ways to amplify learning rather than changing from one medium to another. An interesting research question is: How should items be allocated so the students get the most out of the drills? Current CAT techniques tend to use Point Fisher Information (PFI), justified when attempting to evaluate current knowledge since with the PFI the selection criterion is to minimise the variance in estimated subject ability after seeing the item. With the current emphasis on learning, not evaluation, the PFI is no longer central. Although one can in principle still use the PFI methodology, the basic criteria for using the PFI are no longer of interest: Instead, one wants to select each item so as to maximise the amount of learning obtained by showing the item to the subject. In addition, one wants to make sure that this learning is not just transient but committed to longterm memory and, if, at all possible that learning occurs with understanding not simply learning by rote. Such a mechanism for selecting items could and should take a number of concerns into account.
III.5 Conclusions and future work
115
• If selecting within the current lecture, select an item to give maximum learning. • Within the lecture select easy items for an underachiever, hard items for a good student. • Increase the difficulty level as the student learns, within the lecture. • Select items so that a student can only “successfully” complete the lecture by completing the most difficult items. • Select items from previous lectures (or prerequisite tutorials/courses) if the student can not handle the easiest items within the lecture. • Estimate whether the student is likely to be forgetting earlier material and select earlier items accordingly. • Select an item based on externally supplied metadata on item taxonomy, such as an item containing a cue. • Select items from material which the student has earlier answered incorrectly or is likely to answer incorrectly. Some of the above mention points have already been partially implemented as described before. The system has been used by over 2000 students, mostly in courses on statistics and mathematics at the University of Iceland (UI) and the University of Maseno, Kenya. The tutor-web has mainly been used to supplement education in the classroom, but being freely accessible without regard to physical location or registration into a school or university, the potential is much greater. Completion of certain courses has e.g., been used as an entry criterion for PhD applicants at the UI, as an addition to other formal criteria for entering a PhD study. Similarly the system can be used by students lacking in prerequisites. The tutor-web has considerable potential for low-income regions like Kenya where textbooks are not widely available, and student surveys regarding the tutor-web are highly positive, "I wished to do more" being a typical response (Mokua, Stern, Jonsdottir, & Mbasu, 2013). A mobile tutor-web is under development, where the user does not need to be connected to the Internet at all times to answer drill items. This can become a game changer for students in rural areas where Internet access is limited but the number of students with access to smart phones is exploding. Hopefully increase the number of students
Chapter III 116
Development and use of an adaptive learning environment to research online study behaviour
whose experience will be described by words from the Maseno survey: "Doing maths online was the best experience I ever had with maths".
Acknowledgement The tutor-web project has been supported by Ministry of Education and the Marine Research Institute of Iceland, the United Nations University, University of Iceland and the EU project MareFrame. The authors would finally like the thank Christopher Desjardins for his helpful comments.
IV Paper IV Difference in learning among students doing pen-and-paper homework compared to web-based homework. Anna Helga Jonsdottir, Audbjorg Bjornsdottir & Gunnar Stefansson.
117
Chapter IV 118
Difference in learning among students doing pen-and-paper homework compared to web-based homework
Abstract A repeated crossover experiment comparing learning among students handing in pen-and-paper homework (PPH) with students handing in web-based homework (WBH) has been conducted. The system used in the experiments, the tutorweb, has been used to deliver homework problems to thousands of students over several years. Since 2011 experimental changes have been made regarding how the system allocates items to students, how grading is done and the type of feedback provided. The experiment described here was conducted annually from 2011 to 2014. Approximately 100 students in a introductory statistics course participated each year. The main goals were to determine if the above mentioned changes had an impact on learning as measured by test scores in addition to comparing learning among students doing PPH with students handing in WBH. Difference in learning between students doing WBH compared to PPH, measured by test scores, increased significantly from 2011 to 2014 with an effect size of 0.634. This is a strong indication that the changes made in the tutor-web have a positive impact on learning. Using the data from 2014 a significant difference in learning between WBH and PPH was detected with effect size of 0.416 supporting the use of WBH as a learning tool. Keywords: Web-based homework (WBH), pen-and-paper homework (PPH), learning environment, repeated crossover experiment, statistics education.
IV.1 Introduction
IV.1
119
Introduction
Enrolment to universities has increased substantially the past decade in most OECD countries. In Iceland, the increase in tertiary level enrolment was 40% between 2000 and 2010 (OECD, 2013). This increase has resulted in larger class sizes in the University of Iceland, especially in undergraduate courses. As stated in Black and Wiliam (1998), several studies have shown firm evidence that innovations designed to strengthen the frequent feedback that students receive about their learning yield substantial learning gains. Providing students with frequent quality feedback is time consuming and in large classes this can be very costly. It is therefore of importance to investigate whether web-based homework (WBH), that does not require marking by teachers but provides feedback to students, can replace (at least to some extent) traditional pen-andpaper homework (PPH). To investigate this, an experiment has been conducted over a four year period in an introductory course in statistics at the University of Iceland. About 100 students participated each year. The experiment is a repeated crossover experiment so the same students were exposed to both methods, WBH and PPH. The learning environment tutor-web (http://tutor-web.net) used in the experiments has been under development during the past decade in the University of Iceland. Two research questions are of particular interest: 1. Have changes made in the tutor-web had an impact on learning as measured by test performance? 2. Is there a difference in learning, as measured by test performance, between students doing WBH and PPH after the changes made in the tutor-web? In this section, an overview of different types of learning environments related to the functionality of the tutor-web is given (Section IV.1.1) focusing on how to allocate exercises (problems) to students. A literature review of studies conducted to investigate a potential difference in learning between WBH and PPH is given in Section IV.1.2 followed by a brief discussion about formative assessment and feedback (Section IV.1.3). Finally a short description of the tutor-web is given in Section IV.1.4.
Chapter IV 120
IV.1.1
Difference in learning among students doing pen-and-paper homework compared to web-based homework
Web-based learning environments
A number of web-based learning environments can be found on the web, some open and free to use, others commercial products. Several types of systems have emerged, including the learning management system (LMS), learning content management system (LCMS) and adaptive and intelligent web-based educational systems (AIWBES). The LMS is designed for planning, delivering and managing learning events, usually adding little value to the learning process nor supporting internal content processes while the primary role of a LCMS is to provide a collaborative authoring environment for creating and maintaining learning content (Ismail, 2001). AIWBES use a model of each student to adapt to the needs of that student (Brusilovsky & Peylo, 2003) in contrast to many systems that are merely a network of static hypertext pages (Brusilovsky, 1999). A number of web-based learning environments use intelligent methods to provide personalized content or navigation such as the one described in Own (2006). However, only few systems use intelligent methods for exercise item allocation (Barla et al., 2010). The use of intelligent item allocation algorithms (IAA) is, however, a common practice in testing. Computerized Adaptive Testing (CAT) (Wainer, 2000) is a form of computer-based tests where the test is tailored to the examinee’s ability level by means of Item Response Theory (IRT). IRT is the framework used in psychometrics for the design, analysis and grading of computerized tests to measure abilities (Lord, 1980). As Wauters et al. (2010) argue, IRT is potentially a valuable method for adapting the item sequence to the learner’s knowledge level. However, the IRT methods are designed for testing, not learning, and as shown in Stefansson and Sigurdardottir (2011) and Jonsdottir and Stefansson (2014) the IRT models are not appropriate since they do not take learning into account. New methods for IAA in learning environments are therefore needed. Several systems can be found that are specifically designed for providing content in the form of exercise items. Examples of systems providing homework exercises are the WeBWork system (Gage, Pizer, & Roth, 2002), ASSiSTments (Razzaq et al., 2005), ActiveMath (Melis et al., 2001), OWL (Hart, Woolf, Day, Botch, & Vining, 1999), LON-CAPA (Kortemeyer et al., 2008) and WebAssign (Brunsmann, Homrighausen, Six, & Voss, 1999). None of those systems use intelligent methods for item allocation, instead a fixed set of items are submitted to the students or drawn randomly from a pool of items.
IV.1 Introduction
IV.1.2
121
Web-based homework vs. pen-and-paper homework
A number of studies have been conducted to investigate a potential difference in learning between WBH and PPH. In most of the studies reviewed, no significant difference was detected (Bonham et al., 2003; Cole & Todd, 2003; Demirci, 2007; Gok, 2011; Kodippili & Senaratne, 2008; LaRose, 2010; Lenz, 2010; Palocsay & Stevens, 2008; A. Williams, 2012). In three of the studies reviewed, WBH was found to be more efficient than PPH as measured by final exam scores. In the first study, described in Dufresne et al. (2002), data was gathered in various offerings of two large introductory physics courses taught by four lectures over three year period. The OWL system was used to deliver WBH. The authors found that WBH lead to higher overall exam performance, although the difference in average gain for the five instructor-course combinations was not statistically significant. In the second paper, VanLehn et al. (2005) describe Andes, a physics tutoring system. The performance of students working in the system was compared to students doing PPH homework for four years. Students using the system did significantly better on the final exam than the PPH students. However, the study has one limitation; the two groups were not taught by the same instructors. Finally, Brewer and Becker (2010) describe a study in multiple sections of college algebra. The WBH group used an online homework system developed by the textbook publisher. The authors concluded that the WBH group generally scored higher on the final exam but no significant difference existed between mathematical achievement of the control and treatment groups except in low-skilled students where the WBH group exhibited significantly higher mathematical achievement. Even though most of the studies performed comparing WBH and PPH show no difference in learning, the fact that students do not do worse than students doing PPH makes WBH an favourable option, specially in large classes where correcting PPH is very time consuming. Also, students perception towards WBH has been shown to be positive (Demirci, 2007; Hauk & Segalla, 2005; Hodge et al., 2009; LaRose, 2010; Roth et al., 2008; Smolira, 2008; VanLehn et al., 2005). All the studies reviewed were conducted using quasi-experimental design, i.e. students were not randomly assigned to the treatment groups. Either multiple sections of the same course were tested where some sections did PPH while the other(s) did WBH or the two treatments were assigned on different semesters. This could lead to some bias. The experiment described in this paper is a
Chapter IV 122
Difference in learning among students doing pen-and-paper homework compared to web-based homework
repeated randomized crossover experiment so same students were exposed to both WBH and PPH resulting in a more accurate estimate of the potential difference between the two methods.
IV.1.3
Assessment and feedback
Assessments are frequently used by teachers to assign grades to students (assessment of learning) but a potential use of assessment is to use it as a part of the learning process (assessment for learning) (J. Garfield et al., 2011). The term summative assessment (SA) is often used for the former and formative assessment (FA) for the latter. The concepts of feedback and FA overlap strongly and, as stated in Black and Wiliam (1998), the terms do not have a tightly defined and widely accepted meaning. Therefore, some definitions will be given below. Taras (2005) defines SA as "... a judgement which encapsulates all the evidence up to a given point. This point is seen as a finality at the point of the judgement" (p. 468) and about FA she writes "... FA is the same process as SA. In addition for an assessment to be formative, it requires feedback which indicates the existence of a ‘gap’ between the actual level of the work being assessed and the required standard" (p. 468). A widely accepted definition of feedback is then provided in Ramaprasad (1983): "Feedback is information between the actual level and the reference level of a system parameter which is used to alter the gap in some way" (p. 4). Stobart (2008) suggest making the following distinction between the complexity of feedback; knowledge of results (KR) only states whether the answer is incorrect or correct, knowledge of correct response (KCR) where the correct response is given when the answer is incorrect and elaborated feedback (EF) where, for example, an explanation of the correct answer is given. The terms formative assessment, feedback and the distinction between the different types of feedback will be used here as defined above.
IV.1.4
The tutor-web
The tutor-web (http://tutor-web.net) project is an ongoing research project. The functionalities of the system have changed considerable during the past decade. A pilot version, written only in HTML and Perl, is described in Stefansson (2004). Newer version, implemented in Plone (Nagle, 2010), is described in detail in Jonsdottir et al. (2015). The newest version, described in Lentin
IV.1 Introduction
123
et al. (2014), is a mobile-web and runs smoothly on tablets and smart phones. Also, users do not need to be connected to the internet when answering exercises, only when downloading the item banks. The tutor-web is an LCMS including exercise item banks within mathematics and statistics. The system is open and free to use for everyone having access to the web. At the heart of the system is the formative assessment. Intelligent methods are used for item allocation in such a way that the difficulty of the items allocated adapts to the students ability level. Since the focus of the experiment described here is on the effect of doing exercises (answering items) in the system, only functionalities related to that will be described. A more detailed description of the tutor-web is given in the above mentioned papers. Item allocation algorithm In the systems used for WBH named in Section IV.1.1 a fixed set of items are allocated to students or drawn randomly, with uniform probability, from a pool of items. This was also the case in the first version of the tutor-web. A better way might be to implement an IAA so that the difficulty of the items adapts to the students ability. As discussed in Section IV.1.1, current IRT methods are not appropriate when the focus is on learning, therefore a new type of IAA has been developed using the following basic criteria: • Increase the difficulty level as the student learns • select items so that a student can only complete a session with high grade by completing the most difficult items • select items from previous sessions to refresh memory. Items are grouped into lectures in the tutor-web system where each lecture covers a specific topic. This could be discrete distributions in material used in a introductory course in statistics or limits in a basic course in calculus. Within a lecture, the difficulty of an item is simply calculated as the ratio of incorrect responses to the total number of responses. The items are then ranked according to their difficulty, from the easiest item to the most difficult one. The implementation of the first criteria (shown above) has changed over the years. In the first version of the tutor-web all items within a lecture were assigned uniform probability of being chosen for every student. This was changed
Chapter IV
Difference in learning among students doing pen-and-paper homework compared to web-based homework
124
in 2012 with the introduction of a probability mass function (pmf) that calculates the probability of an item being chosen for a student. The pmf is exponentially related to the ranking of the item and also depends on the student’s grade:
p(r) =
r g q m−g · + c m N ·m
if g ≤ m,
1−g q N −r+1 g − m · + c 1 − m N · (1 − m)
if g > m,
(IV.1)
where q is a constant (0 ≤ q ≤ 1) controlling the steepness of the function, N is the total number of items belonging to the lecture, r is the difficulty rank of the item (r = 1, 2, ...N ), g is the grade of the student (0 ≤ g ≤ 1) and c is a PN normalizing constant, c = i=1 q i . Finally, m is a constant (0 < m < 1) so that when g < m, the pmf is strongly decreasing and the mass is mostly located at the easy items, when g = m the pmf is uniform and when g > m the pmf is strongly increasing with the mass mostly located at the difficult items. This was changed in 2013 in such a way that the mode of the pmf moves to the right with increasing grade which is achieved by using the following pmf based on the beta distribution: p(r) =
�
1 N � X i=1
i N +1
�α � · 1−
i N +1
�β
r N +1
�α � · 1−
r N +1
�β , (IV.2)
where r is the rank (r = 1, 2, ..., N ) and α and β are constants controlling the shape of the function. The three different pmfs used over the years (uniform, exponential and beta) are shown in Figure IV.1. Looking at the last figure, showing the pmf currently used, it can be seen that a beginning student (with a score 0) receives easy items with high probability. As the grade increases the mode of the probability mass functions shifts to the right until the student reaches a top score resulting in high probability of getting the most difficult items. Using this pmf, the first two of the criteria for the IAA listed above are fulfilled. The last criteria for the IAA is related to how people forget. Ebbinghaus (1913) was one of the first to research this issue. He proposed the forgetting curve and showed in his studies that learning and the recall of learned information depends on the frequency of exposure to the material. It was therefore decided in 2012 to change the IAA in such a way that students are now occasionally allocated items from previous lectures to refresh memory.
Probability
IV.1 Introduction
125
0.20
0.20
0.20
0.15
0.15
0.15
0.10
0.10
0.10
0.05
0.05
0.05
grade 0 0.25 0.5 0.75 1
0.00
0.00 0
10
20
30
40
50
rank
0.00 0
10
20
30
rank
40
50
0
10
20
30
40
50
rank
Figure IV.1: The different probability mass functions used in the item allocation algorithm. Left: uniform. Middle: exponential. Right: beta.
Grading Although the main goal of making the students answer exercises in the tutorweb is learning there is also a need to evaluate the student’s performance. The students are permitted to continue to answer items until they (or the instructor) are satisfied, which makes grading a non-trivial issue. In the first version of the tutor-web, the last eight answers counted (with equal weight) towards the tutorweb grade. Students were given one point for a correct answer and minus half a point for an incorrect one. The idea was that old sins should be forgotten when students are learning. This had some bad side effects with students often quitting answering items after seven correct attempts in a row (Jonsdottir et al., 2015) which is a perfectly logical result since a student who has a sequence of seven correct and one incorrect will need another eight correct answers in sequence to increase the grade. The tutor-web grade was also found to be a bad predictor of students performance on a final exam, the grade being too high (Lentin et al., 2014). It was therefore decided in 2014 to change the grading scheme (GS) and use min(max(n/2, 8), 30) items after n attempts when calculating the tutor-web grade. That is, use a minimum of eight answers, then after eight answers use n/2 but no more than 30 answers. Using this GS, the weight of each answer is less than before (when n > 8), thus eliminating the fear of answering the eighth item incorrectly, but at the same time making it more difficult for students to get a top grade since more answers are used when calculating the grade.
Chapter IV 126
Difference in learning among students doing pen-and-paper homework compared to web-based homework
Figure IV.2: A question from a lecture on inferences for proportions. The students are informed what the correct answer is and shown an explanation of the correct answer.
Feedback The quality of the feedback is a key feature in any procedure for formative assessment (Black & Wiliam, 1998). In the first version of the tutor-web, only KR/KCR type feedback was provided. Sadler (1989) suggested that KR type feedback is insufficient if the feedback is to facilitate learning so in 2012 an explanation was added to items in the tutor-web item bank, thus providing students with EF. A question from a lecture covering inferences for proportions is shown in Figure IV.2. Here the student has answered incorrectly (marked by red). The correct answer is marked with green and an explanation given below.
IV.2 Material and methods
127
Summary of changes in the tutor-web In the sections above, changes related to the IAA, grading and feedback were reviewed. A summary of the changes discussed is shown in Table IV.1. Year
IAA difficulty
IAA refresh memory
Grading
Feedback
Mobile-web
2011 2012 2013 2014
uniform exponential beta beta
no yes yes yes
last 8 last 8 last 8 min(max(n/2,8),30)
KR/KCR EF EF EF
no no no yes
Table IV.1: Summary of changes in the tutor-web.
IV.2
Material and methods
The data used for the analysis was gathered in a introductory course in statistics in the University of Iceland from 2011-2014. Every year some 200 first year students in chemistry, biochemistry, geology, pharmacology, food science, nutrition, tourism studies and geography were enrolled in the course. The course was taught by the same instructor over the timespan of the experiment. About 60% of the students had already taken a course in basic calculus the semester before while the rest of the students had much weaker background in mathematics. Around 60% of the students were females and 40% males. The students needed to hand in homework four times which counted 10% towards the final grade in the course. The subjects of the homework were; discrete distributions, continuous distributions, inference about means and inference about proportions. The experiment conducted is a repeated randomized crossover experiment. The design of the experiment is shown in Figure IV.3.
Figure IV.3: The design of the experiment. The experiment was repeated four times from 2011-2014.
Chapter IV
Difference in learning among students doing pen-and-paper homework compared to web-based homework
128
2011 2012 2013 2014
Discrete 91 113 117 129
Continuous 84 113 123 130
Means 122 100 110 111
Proportions 115 65 99 110
Table IV.2: Number of students taking the tests.
Each year the class was split randomly in two groups. One group was instructed do exercises in the tutor-web system in the first homework assignment (WBH) while the other group handed in written homework (PPH). The exercises on the PPH assignment and in the tutor-web were similar and covered the same topics. Shortly after the students handed in their homework they took an unexpected test in class. The groups were crossed before the next homework, that is, the former WBH students handed in PPH and vice versa and again the students were tested. Each year this procedure was repeated and the test scores from the four exams registered. The number of students taking each exam is shown in Table IV.2. To answer the first research question, stated in Section IV.1, the following linear mixed model is fitted to the data from 2011-2014 and nonsignificant factors removed: gmlhyi = µ + αm + βl + γh + δy + (αγ)mh + (βγ)lh + (δγ)yh + si + �mlhyi (IV.3) where g is the test grade, α is the math background (m = weak, strong), β is the lecture material (l = discrete distributions, continuous distributions, inference about means, inference about proportions), γ is the type of homework (h = PPH, WBH), δ is the year (y = 2011, 2012, 2013, 2014) and s is the random student effect (si ∼ N (0, σs2 )). The interaction term (αγ) measures whether the effect of type of homework is different between students with strong and weak math background and (βγ) whether the effect of type of homework is different for the lecture material covered. The interaction term (δγ) is of special interest since it measures the effect of changes made in the tutor-web system during the four years of experiments.
IV.3 Results
129
To answer the second research question, only data gathered in 2014 is used and the following linear mixed model fitted to the data: gmlhi = µ + αm + βl + γh + (αγ)mh + (βγ)lh + si + �mlhi
(IV.4)
with α, β, γ and s as above. If the interaction terms are found to be nonsignificant, the γ factor is of special interest since it measures the potential difference in learning between students doing WBH and PPH. In addition to collecting the exam grades, the students answered a survey at the end of each semester. 442 students in total responded to the surveys (121 in 2011, 88 in 2012, 131 in 2013 and 102 in 2014). Two of the questions are related to the use of the tutor-web and the students perception of WBH and PPH homework: 1. Do you learn by answering items in the tuto-web? (yes/no) 2. What do you prefer for homework? (PPH/WBH/Mix of PPH and WBH)
IV.3
Results
IV.3.1
Analysis of exam scores
In order to see which factors relate to exam scores the linear mixed model in Eq. (IV.3) was fitted to the exam score data using R (R Core Team, 2014). The lmer function in the lme4 package (Bates et al., 2014) was used. The interaction terms (mh) and (lh) were found to be nonsignificant and therefore removed from the model. This indicates that the effect of homework type does not depend on math background nor lecture material covered. However, the (yh) interaction was found to be significant implying that the effect of the type of homework is not the same during the four years. The resulting final model can be written as: gmlhyi = µ + αm + βl + γh + δy + (δγ)yh + si + �mlhyi
(IV.5)
The estimates of the parameters and the associated t-values are shown Table IV.3 along with p-values calculated using the lmerTest package (Kuznetsova et al., 2013). Estimates of the variance components were σ ˆs2 = 1.84 and σ ˆ 2 = 3.33. The reference group (included in the intercept) are students in the 2011 course with weak math background handing in PPH on discrete distributions.
Chapter IV
Difference in learning among students doing pen-and-paper homework compared to web-based homework
130
Parameter estimates (Intercept) year2012 year2013 year2014 WBH strongMath test2 test3 test4 year2012:WBH year2013:WBH year2014:WBH
Estimate 4.416 0.326 0.785 0.540 −0.228 1.680 1.255 0.015 1.337 0.519 0.201 0.634
Std. Error 0.211 0.244 0.234 0.234 0.186 0.146 0.126 0.128 0.133 0.267 0.259 0.252
df 1123.789 1039.348 1039.243 1013.152 1206.998 580.124 1236.322 1250.851 1268.752 1220.682 1244.169 1189.315
t value 20.957 1.336 3.349 2.313 −1.229 11.515 9.924 0.117 10.057 1.942 0.774 2.515
Pr(>|t|) 0.000 0.182 0.001 0.021 0.219 0.000 0.000 0.907 0.000 0.052 0.439 0.012
Table IV.3: Parameter estimates for the final model used to answer research question 1. The reference group are students in the 2011 course with weak math background handing in PPH on discrete distributions.
By looking at the estimate for the year2014:tw term it can be noticed that the difference between the WBH and PPH groups is significantly different in 2011 (the reference group) and 2014 (p = 0.012), indicating that the changes made to the tutor-web had a positive impact on learning. The difference in effect size between WBH and PPH in 2011 and 2014 is 0.634. It should also be noted that the effect size of math background is large (1.680). In order to answer the second question, the model in Eq. IV.4 was fitted to the data from 2014. The interaction terms were both nonsignificant and therefore removed from the model. The final model can be written as: gmlhi = µ + αm + βl + γh + si + �mlhi
(IV.6)
The estimates of the parameters, the associated t- and p-values are shown Table IV.4. Estimates of the variance components were σ ˆs2 = 1.48 and σ ˆ 2 = 2.84. The reference group (included in the intercept) are students with weak math background handing in PPH on discrete distributions. By looking at the table it can be noted that the difference between the WBH and PPH groups is significant (p = 0.009) and the estimated effect size is 0.416 indicating that the students did better after handing in WBH than PPH. Again, the effect size of math background is large (1.379).
IV.3 Results
131
Paramter estimates (Intercept) mathStrong test2 test3 test4 WBH
Estimate 5.080 1.379 0.137 1.254 1.719 0.416
Std. Error 0.239 0.251 0.216 0.228 0.228 0.158
df 349.520 158.556 347.434 360.445 358.667 336.485
t value 21.279 5.502 0.633 5.493 7.538 2.640
Pr(>|t|) 0.000 0.000 0.527 0.000 0.000 0.009
Table IV.4: Parameter estimates for the final model used to answer research question 2. The reference group (included in the intercept) are students with weak math background handing in PPH on discrete distributions.
IV.3.2
Analysis of student surveys
In general, the students perception of the tutor-web system is very positive. In student surveys conducted over the four years over 90% of the students feel they learn using the system. Despite the positive attitude towards the system about 80% of the students prefer a mixture of PPH and WBH over PPH or WBH alone. It is interesting to look at the difference in perception over the four years shown in Figure IV.4. As stated above, the GS was changed in 2014 making it more difficult to get a top grade for homework in the system and more difficult than in PPH. This lead to a general frustration in the student group. The fraction of students preferring only handing in PPH, compared to WBH or mix of the two, more than tripled compared to the previous years. 1.00
1.00
Proportion
0.75
0.75 homework
learned yes
0.50
PPH 0.50
WBH
no 0.25
Mix 0.25
0.00
0.00 2011
2012
2013
year
2014
2011
2012
2013
2014
year
Figure IV.4: Results from the student survey. Left: "Do you learn from the tutorweb?". Right: "What is you preference for homework"?
Chapter IV 132
IV.4
Difference in learning among students doing pen-and-paper homework compared to web-based homework
Conclusion and future work
The learning environment tutor-web has been under development during the past decade in the University of Iceland. An experiment has been conducted to answer the following research questions: 1. Have changes made in the tutor-web had an impact on learning as measured by test performance? 2. Is there a difference in learning, as measured by test performance, between students doing PPH and WBH after the changes made in the tutor-web? The experiment was conducted over four years in a introductory course on statistics. It is a repeated crossover experiment so students were exposed to both methods, WBH and PPH. The difference between the WBH and PPH groups was found to be significantly different in 2011 and 2014 (p = 0.012), indicating that the changes made to the tutor-web have made an positive impact on learning as measured by test scores. The difference in effect size between WBH and PPH in 2011 and 2014 is 0.634. Several changes were made in the system between 2011 and 2014 as shown in Table IV.1. As can be seen in the table the changes are somewhat confounded but moving from uniform probability to the pmf shown in Eq. IV.2 when allocating items, allocating items from old material to refresh memory, changing the grading scheme so that min(max(n/2, 8), 30) items count in the grade in stead of eight, providing EF in stead of KR/KCR type feedback and having a mobile version appears to have had a positive impact on learning. To answer the second research question, only data gathered in 2014 was used. The difference between the WBH and PPH groups was found to be significant (p = 0.009) with effect size 0.416 indicating that the students did better after handing in WBH than PPH. In both models the effect size of math background was large (1.680 and 1.379). The tutor-web project is an ongoing research project and the tutor-web team will continue to work on improvements to the system. Improvements related to the exercise items are quality of items and feedback, the grading scheme (GS) and the item allocation algorithm (IAA).
IV.4.1
Quality of items and feedback
As pointed out in J. B. Garfield (1994), it is important to have items that require student understanding of the concepts not only test skills in isolation of
IV.4 Conclusion and future work
133
a problem context. It is therefore important to have items that encourage deep learning rather than surface learning (Biggs, 1987). One goal of the tutor-web team is to collect metadata for each item in the item bank. One classification of the items will reflect how deep an understanding is required using e.g. the Structure of the Observed Learning Outcomes (SOLO) taxonomy (Biggs & Collis, 1982). According to SOLO the following three structural levels make up a cycle of learning. “Unistructural : The learner focuses on the relevant domain, and picks one aspect to work with. Multistructural : The learner picks up more and more relevant or correct features, but does not integrate them. Relational : The learner now integrates the parts with each other, so that the whole has a coherent structure and meaning” (p.152). In addition to the SOLO framework, to reflect difficulty of items in statistics courses, items could also be classified based on cognitive statistical learning outcomes suggested by delMas (2002); J. Garfield and Ben-Zvi (2008); J. Garfield and delMas (2010).These learning outcomes have been defined as (J. Garfield & Franklin, 2011): “Statistical literacy, understanding and using the basic language and tools of statistics. Statistical reasoning, reasoning with statistical ideas and make sense of statistical information. Statistical thinking, recognizing the importance of examining and trying to explain variability and knowing where the data came from, as well as connecting data analysis to the larger context of a statistical investigation” (p.4-5). Items measuring these concepts could be ranked in hierarchical order in terms of difficulty, starting with statistical literacy items as less difficult and ending with most difficult items measuring statistical thinking.
IV.4.2
Grading scheme
The GS used in a learning environment such as the tutor-web influences the behaviour of the students (Jonsdottir et al., 2015). The GS used in the tutorweb was changed in 2014 eliminating some problems but introducing a new one; the students found it unfair. The following criteria will be used to develop the GS further. The GS should: • Entice students to continue to request items, thus learning more • reflect current knowledge well • be fair in students minds.
Chapter IV
Difference in learning among students doing pen-and-paper homework compared to web-based homework
0.15
0.15
0.10
0.10
Weight
Weight
134
0.05
0.05
0.00
0.00 0
10
20
30
0
10
Item
20
30
Item
Figure IV.5: The weight function for a student that has answered 30 items for different values of the parameters. Left: α = 0.15, s = 1, ng = 15. Right: α = 0.10, s = 2, ng = 30.
Currently a new grading scheme is being implemented. In stead of giving equal weight to items used to calculate the grade, newer items are given more weight using the following formula: α � �s l 1 − ng +1 (1 − α) · ng �s w(l) = X� i 1 − n +1 g i=2 0
when l = 1, when 1 < l ≤ ng
(IV.7)
when l > ng
where l is the lagged item number (l = 1 being the most recent item answered), α is the weight given to the most recent answer, ng is the number of answers included in the grade and s is a parameter controlling the steepness of the function. Some weight functions for a student that has answered 30 items are shown in Figure IV.5. As can be seen by looking at the figure, the newest answers get the most weight and old (sins) get less.
The students will be informed of their current grade as well as what their grade will be if they answer the next item correctly to entice them to continue requesting items. Studies investigating the effect of the new GS will be conducted in 2015.
IV.4 Conclusion and future work
IV.4.3
135
Item allocation algorithm
In the current version of the IAA, the items are ranked according to difficulty level, calculated as the ratio of incorrect responses to the total number of responses. This is, however, not optimal since the ranking places the items with equal distance apart on the difficulty scale. A solution to this problem could be to use directly the ratio of incorrect responses to the total number of responses in the IAA in stead of the ranking. Another solution would be to implement a more sophisticated method for estimating the difficulty of the items using IRT but as mentioned earlier those methods are designed for testing not learning. However, it would be interesting to extend the IRT models by including a learning parameter which would make the models more suitable in a learning environment. Finally, it is of interest to investigate formally the impact of allocating items from old material to refresh memory.
Acknowledgements The tutor-web project has been supported by Ministry of Education and the Marine Research Institute of Iceland, the United Nations University, University of Iceland and the European Union’s Seventh Framework Programme (FP7/20072013) under grant agreement no 613571 - MareFrame.
Chapter IV 136
Difference in learning among students doing pen-and-paper homework compared to web-based homework
Bibliography Anthony, G. (2000). Factors influencing first-year students’ success in mathematics. International Journal of Mathematical Education in Science and Technology, 31 (1), 3–14. Appleby, J., Samuels, P., & Treasure-Jones, T. (1997). Diagnosys - a knowledgebased diagnostic test of basic mathematical skills. Computers & Education, 28 (2), 113–131. Barla, M., Bieliková, M., Ezzeddinne, A., Kramar, T., Simko, M., & Vozár, O. (2010). On the impact of adaptive test question selection for learning efficiency. Computers & Education, 55 (2), 846–857. Bates, D., Maechler, M., Bolker, B. M., & Walker, S. (2014). lme4: Linear mixed-effects models using eigen and s4. (arXiv:1310.8236) Bieliková, M. (2006). An adaptive web-based system for learning programming. International Journal of Continuing Engineering Education and Life Long Learning, 16 (1), 122–136. Bieliková, M., & Návrat, P. (2009). Adaptive web-based portal for effective learning programming. Communication & Cognition, 42 (1/2), 75–88. Biggs, J. B. (1987). Student approaches to learning and studying. research monograph. Melbourne: Australian Council for Educational Research Ltd. Biggs, J. B., & Collis, K. F. (1982). Evaluating the quality of learning: The solo taxonomy. New York: Acedemic Press. Black, P., & Wiliam, D. (1998). Assessment and Classroom Learning. Assessment in Education: Principles, Policy & Practice, 5 (1), 7–74. Bonham, S. W., Deardorff, D. L., & Beichner, R. J. (2003). Comparison of student performance using web and paper-based homework in college-level physics. Journal of Research in Science Teaching, 40 (10), 1050–1071. Brandell, G., Hemmi, K., & Thunberg, H. (2008). The widening gap - A Swedish 137
138
BIBLIOGRAPHY
perspective. Mathematics Education Research Journal , 20 (2), 38–56. Brewer, D. S., & Becker, K. (2010). Online homework effectiveness for underprepared and repeating college algebra students. Journal of Computers in Mathematics and Science Teaching, 29 (4), 353–371. Brunsmann, J., Homrighausen, A., Six, H.-W., & Voss, J. (1999). Assignments in a virtual university–the webassign-system. In Proc. 19th world conference on open learning and distance education. Vienna, Austria: Citeseer. Brusilovsky, P. (1999). Adaptive and intelligent technologies for web-based education. Kunstliche Intelligenz , 4 , 19-25. Brusilovsky, P., & Peylo, C. (2003). Adaptive and intelligent web-based educational systems. International Journal of Artificial Intelligence in Education, 13 (2-4), 159–172. Brusilovsky, P., Schwarz, E., & Weber, G. (1996). Elm-art: An intelligent tutoring system on world wide web. In Intelligent tutoring systems (pp. 261–269). Berlin: Springer. Brusilovsky, P., & Sosnovsky, S. (2005). Engaging students to work with selfassessment questions: A study of two approaches. ACM SIGCSE Bulletin, 37 (3), 251–255. Brusilovsky, P., Sosnovsky, S., & Shcherbinina, O. (2004). Quizguide: Increasing the educational value of individualized self-assessment quizzes with adaptive navigation support. In Proceedings of e-learn (pp. 1806–1813). Chesapeake, VA: AACE. Chen, C., Lee, H., & Chen, Y. (2005). Personalized e-learning system using item response theory. Computers & Education, 44 (3), 237–255. Cole, R. S., & Todd, J. B. (2003). Effects of web-based multimedia homework with immediate rich feedback on student learning in general chemistry. Journal of Chemical Education, 80 (11), 1338-1343. Conejo, R., Guzmán, E., Millán, E., Trella, M., Pérez-De-La-Cruz, J., & Ríos, A. (2004). Siette: A web-based tool for adaptive testing. International Journal of Artificial Intelligence in Education, 14 (1), 29–61. De Bra, P., & Calvi, L. (1998). Aha! an open adaptive hypermedia architecture. New Review of Hypermedia and Multimedia, 4 (1), 115–139. De Guzmán, M., Hodgson, B. R., Robert, A., & Villani, V. (1998). Difficulties in the passage from secondary to tertiary education. In Proceedings of the international congress of mathematicians (Vol. III, pp. 747–762). Berlin. delMas, R. (2002). Statistical literacy, reasoning, and learning: A commentary. Journal of Statistics Education, 10 (3).
BIBLIOGRAPHY
139
Demirci, N. (2007). University students’ perceptions of web-based vs. paperbased homework in a general physics course. Eurasia Journal of Mathematics, Science & Technology Education, 3 (1), 29–34. Dufresne, R., Mestre, J., Hart, D. M., & Rath, K. A. (2002). The effect of web-based homework on test performance in large enrollment introductory physics courses. Journal of Computers in Mathematics and Science Teaching, 21 (3), 229–251. Ebbinghaus, H. (1913). Memory: A contribution to experimental psychology (No. 3). New York: Teachers college, Columbia University. Engelbrecht, J. (2010). Adding structure to the transition process to advanced mathematical activity. International Journal of Mathematical Education in Science and Technology, 41 (2), 143–154. Fox, J., & Weisberg, S. (2011). An R companion to applied regression (Second ed.). Thousand Oaks CA: Sage. Retrieved from http://socserv.socsci .mcmaster.ca/jfox/Books/Companion Gage, M., Pizer, A., & Roth, V. (2001). WeBWorK: An internet-based system for generating and delivering homework problems. In Joint meeting of the american mathematical society and the mathematical association of america. New Orleans: JMM. Gage, M., Pizer, A., & Roth, V. (2002). WeBWorK: Generating, delivering, and checking math homework via the internet. In Ictm2 international congress for teaching of mathematics at the undergraduate level. Crete, Greece: John Wiley & Sons Inc. Garfield, J., & Ben-Zvi, D. (2008). Developing students’ statistical reasoning: Connecting research and teaching practice. Springer Science & Business Media. Garfield, J., & delMas, R. (2010). A web site that provides resources for assessing students’ statistical literacy, reasoning and thinking. Teaching Statistics, 32 (1), 2–7. Garfield, J., & Franklin, C. (2011). Assessment of learning, for learning, and as learning in statistics education.
Teaching Statistics in School
Mathematics-Challenges for Teaching and Teacher Education, 133–145. Garfield, J., Zieffler, A., Kaplan, D., Cobb, G. W., Chance, B. L., & Holcomb, J. P. (2011). Rethinking assessment of student learning in statistics courses. The American Statistician, 65 (1), 1–10. Garfield, J. B. (1994). Beyond testing and grading: Using assessment to improve student learning. Journal of Statistics Education, 2 (1), 1–11.
140
BIBLIOGRAPHY
Gill, O., O’Donoghue, J., Faulkner, F., & Hannigan, A. (2010). Trends in performance of science and technology students (1997–2008) in Ireland. International Journal of Mathematical Education in Science and Technology, 41 (3), 323–339. Gok, T. (2011). Comparison of student performance using web-and paper-based homework in large enrollment introductory physics courses. International Journal of Physical Sciences, 6 (15), 3778–3784. González-Tablas, A. I., de Fuentes, J. M., Hernández-Ardieta, J. L., & Ramos, B. (2013). Leveraging quiz-based multiple-prize web tournaments for reinforcing routine mathematical skills. Educational Technology & Society, 16 (3), 28–43. Goossens, M., Mittelbach, F., & Samarin, A. (1994). The latex companion. Reading, MA: Citeseer. Graham, C., Swafford, M., & Brown, D. (1997). Mallard: A java enhanced learning environment. In WebNet (pp. 634–636). Toronto, Canada. Hart, D., Woolf, B., Day, R., Botch, B., & Vining, W. (1999). OWL: An integrated web-based learning environment. In International conference on mathematics/science education and technology (pp. 106–112). San Antonio. Hauk, S., & Segalla, A. (2005). Student perceptions of the web-based homework program WeBWorK in moderate enrollment college algebra classes. Journal of Computers in Mathematics and Science Teaching, 24 (3), 229–253. Heck, A., & Van Gastel, L. (2006). Mathematics on the threshold. International Journal of mathematical education in science and technology, 37 (8), 925– 945. Heift, T., & Nicholson, D. (2001). Web delivery of adaptive and interactive language tutoring. International Journal of Artificial Intelligence in Education, 12 (4), 310–325. Hodge, A., Richardson, J. C., & York, C. S. (2009). The impact of a webbased homework tool in university algebra courses on student learning and strategies. Journal of Online Learning and Teaching, 5 (4), 616–628. Hourigan, M., & O’Donoghue, J. (2007). Mathematical under-preparedness: the influence of the pre-tertiary mathematics experience on students’ ability to make a successful transition to tertiary level mathematics courses in Ireland. International Journal of Mathematical Education in Science and Technology, 38 (4), 461–476. Hoyles, C., Newman, K., & Noss, R. (2001). Changing patterns of transition
BIBLIOGRAPHY
141
from school to university mathematics. International Journal of Mathematical Education in Science and Technology, 32 (6), 829–845. Hsiao, I., Brusilovsky, P., & Sosnovsky, S. (2008). Web-based parameterized questions for object-oriented programming. In World conference on elearning. Las Vegas: AACE. Hunt, D. N., & Lawson, D. A. (1996). Trends in mathematical competency of A-level students on entry to university. Teaching mathematics and its applications, 15 (4), 167–173. Ismail, J. (2001). The design of an e-learning system: Beyond the hype. The internet and higher education, 4 (3-4), 329–336. James, A., Montelle, C., & Williams, P. (2008). From lessons to lectures: NCEA mathematics results and first-year mathematics performance. International Journal of Mathematical Education in Science and Technology, 39 (8), 1037–1050. Jonsdottir, A. H., Briem, E., Hreinsdottir, F., Thorarinsson, F., Magnusson, J. I., & Moller, R. G.
(2014).
Úttekt a stærðfrædikennslu i
framhaldsskólum. Reykjavík: Ministry of Education, Science and Culture. (In Icelandic) Jonsdottir, A. H., Jakobasdottir, A., & Stefansson, G. (2015). Development and use of an adaptive learning environment to research online study behaviour. Educational Technology & Society, 18 (1), 132–144. Jonsdottir, A. H., & Stefansson, G. (2011). Enhanced learning with webassisted education. In Jsm proceedings, section on statistical education. Alexandria, VA: American Statistical Association. Jonsdottir, A. H., & Stefansson, G. (2014). From evaluation to learning: Some aspects of designing a cyber-university. Computers & Education, 78 , 344– 351. Kajander, A., & Lovric, M. (2005). Transition from secondary to tertiary mathematics: Mcmaster university experience. International Journal of Mathematical Education in Science and Technology, 36 (2-3), 149–160. Kodippili, A., & Senaratne, D. (2008). Is computer-generated interactive mathematics homework more effective than traditional instructor-graded homework? British Journal of Educational Technology, 39 (5), 928–932. Kortemeyer, G., Kashy, E., Benenson, W., & Bauer, W. (2008). Experiences using the open-source learning content management and assessment system lon-capa in introductory physics courses. American Journal of Physics, 76 , 438–444.
142
BIBLIOGRAPHY
Kuznetsova, A., Brockhoff, P. B., & Christensen, R. H. B. (2013). lmertest: Tests for random and fixed effects for linear mixed effect models (lmer objects of lme4 package). R package version, 2–0. Retrieved from http:// cran.r-project.org/web/packages/lmerTest/ LaRose, P. G. (2010). The impact of implementing web homework in secondsemester calculus. Primus, 20 (8), 664–683. Lenth, R. V. (2014). lsmeans: Least-squares means. R package version, 2–12. Retrieved from http://CRAN.R-project.org/package=lsmeans Lentin, J., Jonsdottir, A. H., Stern, D., Mokua, V., & Stefansson, G. (2014). A mobile web for enhancing statistics and mathematics education. In ICOTS9 Proceedings. (arXiv:1406.5004) Lenz, L. (2010). The effect of a web-based homework system on student outcomes in a first-year mathematics course. Journal of Computers in Mathematics and Science Teaching, 29 (3), 233–246. Lord, F. (1980). Applications of item response theory to practical testing problems. Hillsdale, NJ: L. Erlbaum Associates. Melis, E., Andres, E., Budenbender, J., Frischauf, A., Goduadze, G., Libbrecht, P., . . . Ullrich, C. (2001). ActiveMath: A generic and adaptive web-based learning environment. International Journal of Artificial Intelligence in Education, 12 , 385–407. Ministry of Education, Science and Culture. (1999). The Icelandic National Curriculum Guide for Upper Secondary Schools: Mathematics 1999. Ministry of Education, Science and Culture. (2011). The Icelandic National Curriculum Guide for Upper Secondary Schools: General Section 2011. Mitrovic, A. (2003). An intelligent SQL tutor on the web. International Journal of Artificial Intelligence in Education, 13 (2-4), 173–197. Mokua, V., Stern, D., Jonsdottir, A. H., & Mbasu, Z. (2013). Using tutor-web and video making to improve first year service mathematics teaching at maseno university, kenya. In Africme 4. Maseru, Lesotho. Mustoe, L. (2002). The mathematics background of undergraduate engineers. International Journal of Electrical Engineering Education, 39 (3), 192– 200. Nagle, R. (2010). A user’s guide to plone 4. Houston, TX: Enfold Systems Inc. Neter, J., Wasserman, W., Kutner, M. H., et al. (1996). Applied linear statistical models (Vol. 4). Chicago: Irwin. Northedge, A. (2003). Rethinking teaching in the context of diversity. Teaching in Higher Education, 8 (1), 17–32.
BIBLIOGRAPHY
143
Nyingi Githua, B., & Gowland Mwangi, J. (2003). Students’ mathematics self-concept and motivation to learn mathematics: relationship and gender differences among kenya’s secondary-school students in nairobi and rift valley provinces. International Journal of Educational Development, 23 (5), 487–499. OECD. (2013). Education at a glance 2013. Organisation for Economic Cooperation and Development. Own, Z. (2006). The application of an adaptive web-based learning environment on oxidation–reduction reactions. International Journal of Science and Mathematics Education, 4 (1), 73–96. Palocsay, S. W., & Stevens, S. P. (2008). A study of the effectiveness of webbased homework in teaching undergraduate business statistics. Decision Sciences Journal of Innovative Education, 6 (2), 213–232. Pathak, S., & Brusilovsky, P. (2002). Assessing student programming knowledge with web-based dynamic parameterized quizzes. In Proceedings of EDMEDIA (pp. 24–29). Denver, CO. Piccoli, G., Ahmad, R., & Ives, B. (2001). Web-based virtual learning environments: A research framework and a preliminary assessment of effectiveness in basic it skills training. Mis Quarterly, 25 (4), 401–426. R Core Team. (2014). R: A language and environment for statistical computing. Vienna, Austria: R Foundation for Statistical Computing. Retrieved from http://www.R-project.org/ Ramaprasad, A. (1983). On the definition of feedback. Behavioral Science, 28 (1), 4–13. Razzaq, L. M., Feng, M., Nuzzo-Jones, G., Heffernan, N. T., Koedinger, K. R., Junker, B., . . . others (2005). The Assistment project: Blending assessment and assisting. In Proceedings of the 12th annual conference on artificial intelligence in education (pp. 555–562). Amsterdam. Robin, X., Turck, N., Hainard, A., Tiberti, N., Lisacek, F., Sanchez, J.-C., & Muller, M. (2011). pROC: an open-source package for R and S+ to analyze and compare ROC curves. BMC Bioinformatics, 12 , 77. Romero, C., & Ventura, S. (2007). Educational data mining: A survey from 1995 to 2005. Expert Systems with Applications, 33 (1), 135–146. Roth, V., Ivanchenko, V., & Record, N. (2008). Evaluating student response to webwork, a web-based homework delivery and grading system. Computers & Education, 50 (4), 1462–1482. Rylands, L., & Coady, C. (2009). Performance of students with weak math-
144
BIBLIOGRAPHY
ematics in first-year mathematics and science. International Journal of Mathematical Education in Science and Technology, 40 (6), 741–753. Sadler, D. R. (1989). Formative assessment and the design of instructional systems. Instructional science, 18 (2), 119–144. Searle, S. R., Speed, F. M., & Milliken, G. A. (1980). Population marginal means in the linear model: an alternative to least squares means. The American Statistician, 34 (4), 216–221. SENS.
(2014).
https://ugla.hi.is/kennsluskra/index.php?tab=
skoli&chapter=content&id=30327&kennsluar=2014.
(Accessed:
10/11/2014, in Icelandic) Seymour, E. (2001). Tracking the processes of change in us undergraduate education in science, mathematics, engineering, and technology. Science Education, 86 (1), 79–105. Smolira, J. C. (2008). Student perceptions of online homework in introductory finance courses. Journal of Education for Business, 84 (2), 90–95. Stefansson, G. (2004). The tutor-web: An educational system for classroom presentation, evaluation and self-study. Computers & Education, 43 (4), 315–343. Stefansson, G., & Jonsdottir, A. H. (2015). Design and analysis of experiments linking on-line drilling methods to improvements in knowledge. Journal of Statistical Science and Applications. (In press) Stefansson, G., & Sigurdardottir, A. J. (2011). Web-assisted education: From evaluation to learning. J. Instr. Psych., 38 (1), 47–60. Stobart, G. (2008). Testing times: The uses and abuses of assessment. New York: Routledge. Tantau, T., Wright, J., & Miletić, V. (2013). The beamer class. Retrieved from http://texdoc.net/texmf-dist/doc/latex/beamer/doc/ beameruserguide.pdf Taras, M. (2005). Assessment–summative and formative–some theoretical reflections. British Journal of Educational Studies, 53 (4), 466–478. Tempelaar, D. T., Rienties, B., Giesbers, B., & van der Loeff, S. S. (2012). Effectiveness of a voluntary postsecondary remediation program in mathematics. In Learning at the crossroads of theory and practice (pp. 199–222). Springer. Thomas, M., de Freitas Druck, I., Huillet, D., Ju, M.-K., Nardi, E., Rasmussen, C., & Xie, J. (2012). Survey team 4: Key mathematical concepts in the transition from secondary to university. ICME12, Seoul, Korea.
BIBLIOGRAPHY
145
VanLehn, K., Lynch, C., Schulze, K., Shapiro, J. A., Shelby, R., Taylor, L., . . . Wintersgill, M. (2005). The Andes physics tutoring system: Lessons learned.
International Journal of Artificial Intelligence in Education,
15 (3), 147–204. Varsavsky, C. (2010). Chances of success in and engagement with mathematics for students who enter university with a weak mathematics background. International Journal of Mathematical Education in Science and Technology, 41 (8), 1037–1049. Wainer, H. (2000). Computerized adaptive testing. Hillsdale, NJ: L. Erlbaum Associates. Wauters, K., Desmet, P., & Van Den Noortgate, W. (2010). Adaptive itembased learning environments based on the item response theory: possibilities and challenges. Journal of Computer Assisted Learning, 26 (6), 549–562. Weber, G., Brusilovsky, P., et al. (2001). ELM-ART: An adaptive versatile system for Web-based instruction. International Journal of Artificial Intelligence in Education (IJAIED), 12 , 351–384. Williams, A. (2012). Online homework vs. traditional homework: Statistics anxiety and self-efficacy in an educational statistics course. Technology Innovations in Statistics Education, 6 (1). Williams, T., & Kelley, C. (2011). Gnuplot 4.4-an interactive plotting program. Retrieved from http://www.gnuplot.info/docs_4.4/gnuplot.pdf Wilson, T. M., & MacGillivray, H. L. (2007). Counting on the basics: mathematical skills among tertiary entrants. International Journal of mathematical education in science and technology, 38 (1), 19–41. Wright, B. D. (1977). Solving measurement problems with the rasch model. Journal of Educational Measurement, 14 (2), 97–116. Youden, W. (1950). Index for rating diagnostic tests. Cancer , 3 (1), 32–35. Zhang, L., VanLehn, K., Girard, S., Burleson, W., Chavez-Echeagaray, M. E., Gonzalez-Sanchez, J., & Hidalgo-Pontet, Y. (2014). Evaluation of a metatutor for constructing models of dynamic systems. Computers & Education, 75 , 196–217.