between gas- and particle phase ... gas chromatography coupled with mass spectrometry detection. Gp ... 4 - metoxyacetophenol ...... metal (smelting, welding, etc.) .... however that clear-cut recognition of one of those characteristics as the most ...
Wissenschaftszentrum Weihenstephan für Ernährung, Landnutzung und Umwelt Department für Biowissenschaftliche Grundlagen Lehrstuhl für Ökologische Chemie und Umweltanalytik Technische Universität München
Development and testing of sampling methods for the determination of selected semi volatile organic components distributed in aerosols between gas- and particle phase
Dariusz Antkowiak
Vollständiger Abdruck der von der Fakultät Wissenschaftszentrum Weihenstephan für Ernährung, Landnutzung und Umwelt der Technischen Universität München zur Erlangung des akademischen Grades eines
Doktors der Naturwissenschaften
genehmigten Dissertation.
Vorsitzender Univ.-Prof. Dr.-Ing. R. Meyer-Pittroff Prüfer der Dissertation 1.
Univ.-Prof. Dr. rer. nat., Dr. h. c. (RO) A. Kettrup
2.
Univ. -Prof. Dr. rer. nat., Dr. agr. habil., Dr. h. c. (Zonguldak Univ./ Türkei) H. Parlar
Die Dissertation wurde am 10.05.2006 bei der Technischen Universität München eingereicht und durch die Fakultät Wissenschaftszentrum Weihenstephan für Ernährung, Landnutzung und Umwelt am 22.06.2006 angenommen.
Acknowledgements
The proposed work was carried out in the Institute of Ecological Chemistry of GSF - National Research Centre for Environment and Health, Neuherberg within the GSF Focus Network Aerosols and Health.
I would like to acknowledgement my PhD supervisor Prof. Antonius Kettrup for the opportunity to undertake this work, his confidence and support.
Grateful thanks to the project leader Dr Wolfgang Kreyling as well as to Dr Georg Matuschek and Dr Jürgen Schnelle-Kreis for their precious help, ideas and valuable discussions.
I thank Prof. H. Parlar for the acceptance to be reviewer of this work.
I thank Dr Rene Otjes from ECN Netherlands for his help in the filed of SJAC.
Many thanks to Dr Jutta Lintelmann for her support in the field of HPLC/ASE as well as Yongbo Liu, Reinhard Widera, Franz Erbe and Erwin Karg for their technical advising.
Warmly thanks to Dr Monica Heil França, Dr Agnes Fekete, Anita Wüst, Dr Patrick Bohn and Dr Istvan Gebefügi for their help and friendly atmosphere.
I thank my Parents for their support and heaving faith in me.
Enormous thanks to my fiancée Aleksandra for her endless patient, faith and love.
For Aleksandra and my Parents
Abbreviations and acronyms A
- ampere
ACN
- acetonitrile
APS
- aerodynamic particle sizer
ASE
- Accelerated Solvent Extraction
BC
- black carbon
C11OH
- n-undecanol
C17
- n-heptadecane
C28
- n-octacosane
CdFA
- charcoal denuder/filter/adsorber sampling train
CPC
- condensation particle counter
D50
- n-tetracosane-d50
da
- aerodynamic diameter
DCM
- dichloromethane
DMA
- differential mobility analyzer
DMF
- dimethylformamid
EC
- elemental carbon
ECN
- Energy Research Centre of the Netherlands
ED
- extraction disk
FA
- filter/adsorber sampling train
FLD
- fluorescent detector
G1
- adsorber gas phase sample of SJAC
G2
- aqueous gas phase sample of SJAC
GC
- gas chromatography
GC-MS
- gas chromatography coupled with mass spectrometry detection
Gp
- gas phase
HPLC
- high performance liquid chromatography
LLE
- liquid-liquid extraction
LOD
- limit of detection
LOQ
- limit of quantification
ml
- millilitre
MOAP
- 4 - metoxyacetophenol
n
- repetition time 4
n.d.
- not detected
Nap
- naphthalene
ng
- nanogram
nm
- nanometre
OC
- organic carbon
OD
- outer diameter
OdFA
- ozone denuder/filter/adsorber sampling train
P
- aqueous particle sample of SJAC
p
- pressure
PAH
- polycyclic aromatic hydrocarbons
pg
- picogram
PM
- particulate phase
PM10 / PM2.5 - particles smaller than 10/2.5 µm aerodynamic diameter QFF
- quartz-fibre filters
RH
- relative humidity
s
- second
SJAC
- Steam Jet Aerosol Collector
SMPS
- Scanning Mobility Particle Sizer
SPE
- solid phase extraction
SVOC
- semi volatile organic compounds
T
- temperature
TC
- total carbon
U.S. EPA
- USA Environmental Protection Agency
UFP
- ultrafine particles
V
- volt
v
- volume
XAD2/4
- styrene-divinylbenzene adsorber resin
µl
- micro litre
µm
- micrometer
5
CONTENT Abbreviations and aronyms................................................................................... 4 1. INTRODUCTION ........................................................................................ 9 1.1.
General ........................................................................................................................ 9
1.2.
Characteristic of the ambient aerosols ........................................................................ 9
1.2.1.
Ambient particle size modes ..................................................................................... 10
1.2.2.
Sources ...................................................................................................................... 12
1.2.3.
Composition .............................................................................................................. 14
1.2.4.
Inhalation properties and health effects .................................................................... 15
1.2.5.
Environmental impact ............................................................................................... 18
1.2.6.
Physicochemical interactions .................................................................................... 19
1.3.
The general objective of the thesis............................................................................ 24
2. AEROSOL MEASUREMENTS ............................................................... 25 2.1.
Physical properties .................................................................................................... 25
2.1.1.
Particle mass concentrations ..................................................................................... 25
2.1.1.1. Manual methods ........................................................................................................ 25 2.1.1.2. Automated methods................................................................................................... 27 2.1.2.
Number concentration ............................................................................................... 29
2.1.3.
Size-resolved measurements ..................................................................................... 29
2.2.
Measurements of aerosol chemical composition ...................................................... 31
2.2.1.
Off-line measurements .............................................................................................. 32
2.2.1.1. Size-selective inlets ................................................................................................... 32 2.2.1.2. Sampling substrates................................................................................................... 34 2.2.1.3. Artefacts and undertaken prevention......................................................................... 36 2.2.1.4. Determination of the chemical composition of semivolatile organic compounds .... 39 2.2.2.
Real-time measurements ........................................................................................... 43
3. THE STEAM JET AEROSOL COLLECTOR....................................... 45 3.1.
The original setup of the instrument ......................................................................... 45
3.2.
Evolution of the sampling setup................................................................................ 46
3.2.1.
Instruments and materials.......................................................................................... 46
3.2.2.
The modified SJAC setup ......................................................................................... 47
6
Content
3.2.3.
Hardware development ............................................................................................. 48
3.2.3.1. Adsorbent cartridge ................................................................................................... 48 3.2.3.2. Steamers .................................................................................................................. 49
4. LABORATORY STUDIES ....................................................................... 51 4.1.
Particle number measurements – instruments and methodology .............................. 51
4.2.
Particle generation..................................................................................................... 53
4.2.1.
Instruments and materials.......................................................................................... 53
4.2.2.
Graphite particles ...................................................................................................... 54
4.2.3.
Octacosane particles .................................................................................................. 55
4.2.4.
Indoor air and candle light particles .......................................................................... 55
4.3.
Gas phase generation................................................................................................. 56
4.3.1.
Instruments and materials.......................................................................................... 56
4.3.2.
Methodology ............................................................................................................. 56
4.4.
Chemical characterization of the fractions of SJAC ................................................. 57
4.4.1.
Instruments and materials.......................................................................................... 57
4.4.2.
Sample preparation − methodology .......................................................................... 58
4.4.3.
GC-MS analysis − methodology ............................................................................... 60
4.5.
Statistical methods..................................................................................................... 61
4.6.
Quality assurance ...................................................................................................... 62
4.6.1.
SMPS measurements................................................................................................. 62
4.6.2.
GC-MS analysis ........................................................................................................ 62
4.6.3.
Gas phase generation.....................................................................................................
5. OUTDOOR COMPARISON SAMPLING.............................................. 65 5.1.
Instruments and materials.......................................................................................... 65
5.2.
Ambient aerosol sampling: site and conditions......................................................... 66
5.3.
Methodology ............................................................................................................. 67
5.3.1.
Modified SJAC sampling system .............................................................................. 67
5.3.2.
Filter based samplers ................................................................................................. 67
5.4.
Sample preparation.................................................................................................... 70
5.4.1.
Modified SJAC sampling system .............................................................................. 70
5.4.2.
Filter based samplers ................................................................................................. 71
5.5.
Chemical analysis...................................................................................................... 71
5.6.
Quality control and statistic....................................................................................... 73
7
Content
6. RESULTS FROM THE LABORATORY STUDIES ............................. 76 6.1.
Optimisation of the working condition ..................................................................... 76
6.2.
Particle collection efficiency of the SJAC ................................................................ 77
6.2.1.
Effect of the steam injection type.............................................................................. 78
6.2.2.
Effect of the particle type .......................................................................................... 80
6.2.3.
Effect of the location of the sampling line ................................................................ 81
6.3.
Gas phase experiments .............................................................................................. 84
6.3.1.
Generation ................................................................................................................. 84
6.3.2.
Recovery of the analytical procedure........................................................................ 85
6.3.3.
Transfer of gas phase to the particle fraction of the SJAC ....................................... 87
7. RESULTS FROM THE COMPARATIVE OUTDOOR SAMPLING. 90 7.1.
Recovery of the analytical procedure........................................................................ 91
7.2.
Weather conditions.................................................................................................... 94
7.3.
Concentration of PAH............................................................................................... 95
7.4.
Partitioning of PAH................................................................................................... 97
7.5.
Charcoal and ozone denuder influence on PAH sampling........................................ 98
7.6.
Evaluation of the SJAC ........................................................................................... 100
7.7.
Degradation of the PAH before chemical analysis ................................................. 107
8. CONCLUSIONS AND OUTLOOK ....................................................... 105 9. ABSTRACT .............................................................................................. 108 10. REFFERENCES...................................................................................... 110 ANNEXE........................................................................................................... 121 Annex 1. List of tables ........................................................................................................... 121 Annex 2. List of figures.......................................................................................................... 122
CURRICULUM VITAE ................................................................................... 126
8
1. INTRODUCTION 1.1. General Ambient aerosols are everlasting contributors of the human environment. Throughout natural and man activities they can be observed in the everyday life in the form of fog, cloud, dust, smoke, fume etc. Impact of the atmospheric aerosols on the man’s surroundings can be quite easily noticed by changing both climate- (e.g. visibility) and health properties (e.g. breathing air quality). And those two interacting fields are the main reasons for the fast development of the ambient aerosol science in the last few decades. Recent studies give further proves that the fine fraction (below 2 µm) of atmospheric particle phase is the major reason for their negative activity. The organic fraction is one of the main contributors of atmospheric fine aerosols with their enormous variety of individuals, complex chemistry and proven severe ecological impact and toxicity. Because of the long lifetimes fine particles are able to travel much longer in the atmosphere than coarse particles. They can be found in regions very distant from their origin (e.g. Artic). Therefore emission of aerosol pollutants into the atmosphere is no longer a region scale problem and global strategy for protecting the Earth is necessary for cooperatively decreasing ambient aerosol pollution. One of the key factors for such activities is the analytical characterization of ambient aerosols. The first and most susceptible stage of it is the collection of the representative sample. One of the major groups of aerosol constituents is semi volatile organic compounds (SVOC). Since both health and ecological impacts of SVOC depend on their physical form of appearance, it is very important to be able to determine their concentration in the gas- (Gp) and particulate phase (PM).
1.2. Characteristic of the ambient aerosols The term “aerosol” refers to an assembly of liquid or solid particles suspended in gaseous medium long enough to enable observation or measurement [Hinds 1982]. By definition aerosol component can refer to chemical compounds in condensed as well as in the gaseous state. In practice however, the term aerosol component usually refers to semi- and non-volatile particle components but not to volatile compounds residing exclusively in the gas phase [Pöschl 2005]. Atmospheric particles are often non spherical, have a range of densities,
9
Introduction
and consist of liquids, solids, or a solid core surrounded by liquids. Therefore, their diameters are described by an ‘‘equivalent’’ diameter which refers to a diameter that is a measurable index of the particle (spheres of the same specific physical property value as the irregular shaped particles being measured). Aerodynamic diameter (da) is the diameter of a unit-density sphere having the same gravitational settling velocity as the particle being measured. Reference to aerodynamic diameter is useful for environmental chemists (behaviour in sampling devices such as filters, cyclones and impactors) as well as for toxicologists (settling and inertial behaviour in the respiratory tract) [Baron and Willeke 1993, Wilson et al. 2002]. In this work the term “diameter” da refers to equivalent aerodynamic diameter.
1.2.1. Ambient particle size modes Generally, the sizes of aerosol particles are in the range 0,001 – 100 µm. In order to differentiate particles within this huge, five decade, size range several classification methods are used. The aerosol community uses four different conventions in the classification of particles by size: (1) modes, based on the observed size distributions and formation mechanisms; (2) cutpoint, usually based on the 50% cutpoint of the specific sampling device; (3) occupational sizes, based on the entrance into various compartments of the respiratory system; and (4) legally specified, regulatory sizes for air quality standards [Wilson et al. 2002].
Figure 1.1. Idealized size distribution of traffic-related particulate matter [U.S. EPA 2004], Dp, particle diameter.
10
Introduction
Classification involving formation process of aerosols distinguishes two main modes: coarse mode covering particles with da higher than 2-2.5 µm and fine mode when da is smaller than the limit value. The fine particles are typically subdivided into another two fractions: below and over 0.1 µm. The bigger fraction was named as an accumulation mode. The other is known as ultrafine particles (UFP, EPA 2004) and can be further divided [Kulmala 2004] into nucleation (< 0.02 µm) and Aitken (0.02-0.09 µm) mode (Figure 1.1). The nucleation mode particles are emitted directly from combustion sources or by the condensation of gases to primary particles which then coagulate to aggregates [John 1993]. Typically newly formed nucleation mode particles are in the range of 1-2 nm in diameter, but rapid growth generally occurs, typically to particles of ca. 20-30 nm in diameter. The formation can occur both in hot combustion gases and in metallurgical processes, involving the condensation from the vapour to form particles, or within the atmosphere itself from chemical reactions of gases to form non-volatile species which condense to form particles [Harrison et al. 2000]. Coagulation increases size of nuclei mode particles but they do not tend to grow over the range of the accumulation mode, where they can move by coagulation with accumulation mode particles. The nuclei mode has a relatively short lifetime (one hour) and is usually not prominent in ambient aerosols [John 1993]. This size range can be detected when fresh emissions sources are close to a measurement site or when new particles have been recently formed in the atmosphere [Chow 1995]. The accumulation mode is formed by coagulation of smaller particles from combustion sources, condensation of volatile species, gas-to-particle conversion through chemical reactions, and from ground dust particles [Chow 1995]. Their growth rate from condensation slows down with increasing particle diameter and because of their low number concentration, but is continuous until deposition occurs. The accumulation mode does not extend much beyond a few microns in diameter and remains distinct from the larger particles in the coarse mode [John 1993]. They are subject to rather inefficient loss from the atmosphere by wet and dry deposition processes. Their atmospheric lifetime is in the range of several days and therefore they can travel over very long distances within the atmosphere [Harrison et al. 2000]. The coarse mode mainly consists of particles generated by mechanical and disintegration processes like wind-blown suspension of land surface dusts and soil, sea salt spray and plant material [John 1993]. Their atmospheric lifetime becomes rather short. Because they arise quite differently from fine mode particles they can be quite distinct in their chemical composition [Harrison et al. 2000]. 11
Introduction
In the countries where improved burning and abatement technologies emission situation has changed considerably the particulate emissions from transportation, fuel combustion, etc. now are containing fine particles, with sizes less than 2 µm, only. The coarse particulates in industrial emissions are very efficiently removed by modern air cleaning equipment, but fine and ultra fine particulates penetrate into the atmospheric environment [Spurny 1998].
1.2.2. Sources Ambient aerosol particles can be of primary or secondary origin. Primary aerosols are emitted in particulate form directly from their sources, while secondary particles are formed in the atmosphere from gaseous precursors [e.g. Pandis et al. 1992, Jacobson et al. 2000]. Both primary and secondary aerosols can come from either natural or anthropogenic activities. Natural particles include the following origins: –
marine – sea salt aerosols generated by the sea spray of waves at high wind speed,
–
mineral – materials derived from the earth's crust,
–
volcanic – injection of gases and particles during eruption, hot lava,
–
biogenic – forest fires, pollens, fungi, bacteria, viruses, biogenic magnetite, action of living organisms, microparticles (< 100 nm; activated cells), disintegration and dispersion of bulk plant material,
–
cosmic – some matter from the solar system entering the atmosphere
[Gourdeau 2003, Oberdörster et al. 2005]
On the global scale, natural sources matter much more since they are emitted from large areas such as the oceans or deserts. On the other hand, anthropogenic sources are likely to surpass those natural e.g. in case of cities with the high traffic and industrial areas with dominant combustion processes and industrial activities [Vouitsis et al. 2003, Morawska and Zhang 2002].
Examples of anthropogenic aerosols sources are listed below, they include also those from the field of nanotechnology which according to Oberdörster [2005] should also be taken into account as a relevant source especially of UFP.
12
Introduction
Unintentional: –
dust from roads and construction sites,
–
pulverization of coal or rock crushing,
–
solid waste disposal and transportation,
–
fuel combustion in power generation, vehicles, residential heating,
–
industrial paint use
–
printing industry
–
internal combustion engines
–
incinerators
–
metal (smelting, welding, etc.), polymer and other fumes
–
heated surfaces
–
frying, broiling, grilling
–
electric motors
Intentional: –
controlled size and shape, designed for functionality
–
metals, semiconductors, metal oxides, carbon, polymers
–
nanospheres, -wires, -needles, -tubes, -shells, -rings, -platelets − untreated, coated (nanotechnology applied to many products: cosmetics, medical, fabrics, electronics, optics, displays, etc.).
[Rogge et al. 1991, 1993, 1998, Jacobson et al. 2000, Gourdeau 2003, Oberdörster et al. 2005]
Most of the naturally formed secondary aerosols in the atmosphere are the result from reaction of sulphur gas emissions. In the marine environment dimethyl sulphide (DMS) is emitted by phytoplankton and by reaction in the atmosphere forms sulphur dioxide (SO2). Volcanoes also directly release SO2 into the air which can further react to form sulphate particles. Additional, humans also produce nitrogen species that give nitrate aerosol [Gourdeau 2003]. Secondary organic aerosol (SOA) is a product of the atmospheric oxidation of reactive organic gases (ROG) by one of three electrophilic gases present in trace amounts in the atmosphere: the hydroxyl radical (OH), ozone (O3), and the nitrate radical (NO3) [Jacobson et al. 2000]. ROGs are emitted by many anthropogenic and natural sources such as burning of fossil fuels and wood, biomass burning, solvent use, emission by vegetation and the oceans [e.g. Duce et al. 1983]. Common atmospheric ROGs include alkenes, aromatics and phenols [Jacobson et al. 2000]. 13
Introduction
1.2.3. Composition Atmospheric particulate matter is basically more difficult to study than gas-phase components of the atmosphere because of its high variability and its very complex make-up [Harrison et al. 2000]. Both inorganic and organic compounds contribute to ambient aerosol. This composition share is closely related to the size and origin of the ambient aerosol and location of the sampling site. Other parameters which play an important role in physicochemical processes involved in formation of the particulate matter refer to the residence time in the atmosphere and meteorological condition (e.g. temperature, UV radiation and RH) [Pöschl 2005]. In coastal areas for example sodium and chloride will dominate, in other places where traffic is the main source of aerosols the fraction of organic carbon can be found at a higher than normal level. Therefore terms like kerbside, urban, rural, background or coastal area are often used to describe the location of the sampling site. Size distribution also predestines chemical composition and generally fine particles consist of much more organic compounds than coarse. Nevertheless major inorganic constituents common for mostly all kind of the ambient aerosols include sulphate, nitrate, ammonium, sea salt, geological material (oxides of aluminium, silicon, calcium, titanium and iron), metal ions – sodium, potassium, iron and transition and heavy metals such as V, Cr, Zn, Ni, Co, or Pb , trace elements and water (absorbed by soluble species when RH > 70 %). Carbonaceous aerosol components are elemental or black carbon (EC, BC) and organic carbon (OC) [Chow 1995, Tsai and Cheng 2004, Sheesley et al. 2003, Mouli et al. 2003]. Measurements of BC and EC are generally based on optical and thermochemical techniques, and OC is operationally defined as the difference between total carbon (TC, the sum of all carbon contained in the particles, except in the form of inorganic carbonates) and BC or EC. EC consist of the carbon content of the graphite-like material usually contained in soot (technically defined as the black product of incomplete hydrocarbon combustion or pyrolysis) and other combustion aerosol particles, which can be pictured as more or less disordered stacks of graphene layers or large polycyclic aromatics [Sadezky et al. 2005]. Despite of very large amount of studies and efforts of ambient aerosol scientists there is only a partial knowledge about the organic composition of the ambient aerosols (Figure 1.2). Several thousand compounds have been identified, but the full chemical description has not been achieved yet [Mazurek 2002].
14
Introduction
Figure 1.2. Chemical mass balance of fine-particle concentrations [Rogge et al. 1993]
Prominent organic substance classes that were characterized and identified in organic fraction of fine PM on a molecular level include the following three characteristic magnitudes of the mass proportion [Pöschl 2005]: –
10–1 – fatty acids and other alkanoic acids, aliphatic dicarboxylic acids, aromatic (poly-) carboxylic acids, multifunctional aliphatic and aromatic compounds (OH, CO, COOH), secondary organic oligomers/polymers and humic-like substances, proteins and other amino compounds, levoglucosan,
–
10–2 – aliphatic hydrocarbons, aliphatic alcohols and carbonyls, cellulose and other carbohydrates
–
10–3 – polycyclic aromatic hydrocarbons (PAHs), nitro- and oxy-PAHs
1.2.4. Inhalation properties and health effects There are many epidemiological and toxicological studies dealing with the influence of ambient aerosols on the human health. Main findings were reviewed in a number of publications [Spurny 1996, 1998, Wichmann and Peters 2000, Oberdörster 2000, 2005]. Epidemiological studies attempt to determine relationships between ambient aerosol concentrations, physical or chemical properties and health indicatory such as hospital admissions, school absenteeism, and frequency of respiratory illness, reduced lung capacity and mortality, especially respiratory and cardiovascular. Toxicological studies on the other
15
Introduction
hand try to identify and explain biological effects of ambient aerosol in living organisms or cells. Deposition efficiencies of the ambient aerosol in the human body is one of the main factors affecting their health impact. Figure 1.3 shows the fraction of different size PM that deposit in the different parts of respiratory tract when particle-laden air is inhaled. All particles with diameters below 10 µm are nominated as the ‘respirable’ or ‘thoracic’ fraction [e.g. Hinds 1982, Spurny 1998]. The highest deposition efficiency in the alveolar region (~ 50%) have 20 nm particles whereas in tracheobronchial and nasopharyngeal regions particle with da ∼ 7 nm and ∼ 5 µm respectively show highest deposition rates. These different deposition efficiencies should have consequences for potential effects induced by inhaled fine particles of different sizes as well as for their disposition to extrapulmonary organs [e.g. Oberdörster et al. 2005].
Figure 1.3. Predicted fractional deposition of inhaled particles in the nasopharyngeal, tracheobronchial, and alveolar region of the human respiratory tract during nose breathing. Based on data from the International Commission on Radiological Protection [1994]. Drawing courtesy of J. Harkema.
16
Introduction
Fine- and ultrafine aerosols are proved to be the most dangerous fractions of the ambient aerosol and brought special attention of aerosol scientists [Kao and Friedlander 1995, Spurny 1998, Oberdörster 2000]. The results of existing toxicological studies (in vivo and in vitro) suggest, that both their physical (particle size, shape, surface and biopersistence) as well as chemical (dissolved and adsorbed toxic chemicals and surface catalytic reactions) properties are involved in observed health effects [Spurny 1998]. It has to be underlined however that clear-cut recognition of one of those characteristics as the most important in terms of health effect is not possible at the moment. Better correlation of fine PM concentrations and mortality-rate ratio (in six U.S. cities, Dockery et al., 1993) is probably due to combined effects resulting from their very high deposition in the deep respiratory tract described above and the nature of the fine particles themselves (Table 1.1). Much higher particle number for a given aerosol mass concentration and larger surface area when compared with larger particles allow them to be carried to the deep lung together with adsorbed toxic compounds (reactive gases, radicals, transition metals or organics). Surface area can also provide the interface between the retained particles and cells, fluids, and tissues of the lungs that can increase surface dependent reactions for particles not readily soluble in the epithelial lining fluid [Oberdörster et al. 1995].
Table 1.1. Influence of particle size on particle number and surface area for a given particle mass [Harrison et al. 2000] particle diameter (µm)
10
1
0.1
0.01
relative number of particles
1
103
106
109
relative surface area
1
102
104
106
There are several types of highly toxic organic compounds found in the atmospheric environment, but polycyclic aromatic hydrocarbons (PAHs), oxy- and nitro-PAH, polychlorinated biphenyls (PCBs), and other organochlorine compounds have received the most attention as pollutants that occur in the aerosol phase [Jacobson et al. 2000]. They can be adsorbed or absorbed in fine and ultrafine insoluble particles, as e.g. soot particulates and enhance toxicity and carcinogenicity of PM [Finlayson-Pitts and Pitts, 1997]. Pöschl [2005] turned attention also onto macromolecular chemical compounds (e.g. proteins, HULIS) which can cause inflammatory and allergic diseases.
17
Introduction
1.2.5. Environmental impact There are two kinds of environmental effects from ambient aerosol: direct and indirect. Direct mechanisms relate to the scattering, reflection and absorption of solar and terrestrial radiation by aerosol particles. [Harrison et al. 2000]. First two processes tend to cause direct cooling effect [Grambsch 1997, Hoornaert and van Grieken 2002] whereas the absorption of terrestrial radiation by greenhouse gases and clouds tend to warm Earth (greenhouse effect) [Houghton et al. 2001]. The indirect mechanisms, which may eventually prove more important, operate through the role of airborne particles as cloud condensation- and ice nuclei (CCN, IN) what is affecting water cycling. Although standard cloud-nucleation theory is based on the assumption that CCN are composed of highly soluble inorganic salts, there are many highly and slightly soluble organic compounds that also can be cloud active [Kulmala et al. 1996]. Reactions on polar stratospheric cloud particles were the key to the chemistry leading to dramatic ozone depletion - Antarctic ozone hole [Harrison et al. 2000]. Atmospheric aerosol plays also important role in rainwater chemistry and acidification. Although rainwater acidification is generally caused by sulfuric and nitric acid also organic acids (predominating formic and acetic acid) have been found in precipitation samples [e.g. Munger et al. 1989]. In areas affected by anthropogenic emissions, organic compounds found in aerosol particles (e.g. C2 and higher diacids as well as formic and acetic acid) may be major contributors to the free acidity of rainwater in more remote regions, where strong inorganic acids are scarce [Weathers et al. 1988]. Organic compounds (both natural and anthropogenic) are involved in tropospheric ozone production because organic peroxy radicals (RO2) react with NO, converting it to NO2. Peroxy radicals are intermediate products resulting from initial reaction of organic compounds with hydroxyl radicals (OH). Thus ozone production is sensitive to the amount of organic material with respect to the amount of NOx (NO + NO2). [National Research Council 1991]. Since organic aerosols are also a product of VOC oxidation by ozone, photochemical smog episodes have nearly always been associated with organic aerosols. [e.g. Rogge et al. 1993; Hildemann et al. 1994]. There is evidence that aerosols are produced in significant quantities from the large amount of volatile compounds emitted naturally [Fehsenfeld et al. 1992; Hoornaert and van Grieken 2002]. The biogeochemical cycling of natural compounds (photosynthesis, decay of
18
Introduction
biomass, metabolism) plays a large role in balancing the global carbon and sulphur cycle and also in the formation of oxidants. Visibility degradation is another symptom of the abundance (presence) of ambient aerosol. Aerosol particles, particularly those with sizes comparable to the wavelengths of visible light, scatter and absorb light and thereby control the transmission of light through the atmosphere. White [1990] has summarized calculations for apportionment of fine-particle scattering and reports that organics are sometimes responsible for as much as 60% of this scattering, especially in the urban areas of the western United States. Smoke plumes from combustion sources utilizing fossil or biomass fuels have a significant organic content and can absorb light due to the presence of a variety of light-absorbing chromophores in the carbon-containing molecules.
1.2.6. Physicochemical interactions
Figure 1.4. PRA (Pöschl, Rudich, and Ammann) framework model compartments, transport processes, and chemical reactions at the gas–particle interface (double-layer surface model): fluxes of diffusion in the gas phase and particle bulk, adsorption and desorption, transfer between sorption layer and quasistatic surface layer and between quasi-static surface layer and near-surface particle bulk indicated by vertical bold arrows on the left side; elementary chemical reactions between species in the same or in different model compartments indicated by horizontal and vertical thin arrows, respectively [Pöschl et al. 2005].
19
Introduction
Despite of number of laboratory and field investigations, the current understanding of the mechanisms and kinetics of mass transport, phase transitions, and chemical reactions in atmospheric aerosols and clouds is very limited. Complexity of these phenomena illustrates a comprehensive kinetic model framework for aerosol and cloud surface chemistry and gas– particle interactions recently proposed by Pöschl, Rudich, and Ammann (Figure 1.4) [Pöschl et al. 2005].
Partitioning characteristics
Chemical compounds from atmospheric aerosol are found in both the gas and condensed phases. Considering of a compound’s partitioning characteristics is crucial issue because of several reasons. The efficiency and location of SVOC deposition in the respiratory tract is strongly dependent on gas/particle partitioning [Pankow 2001]. The dominant removal mechanisms for gases (diffusion to surfaces with subsequent sorption) and particles (impaction, interception, and gravitational settling) differ. Also the rates of atmospheric reactions for SVOC representatives - PAHs are typically lower in the particulate phase than in the gas phase. Partitioning of SVOC is the most important factor determining the distribution and residence time in atmosphere [Pankow 1987, 2001; Pankow and Bidleman 1992] as well influences indoor air quality (e.g. for PAH, Naumowa et al. 2003). It has also an impact on light scattering and cloud drop formation [Jacobson et al. 2000]. Finally, partitioning plays very important role when sampling organic aerosol as well as ammonium nitrate because positive and negative artifacts are inherent when collecting semivolatile material [Jacobson et. al 2000, Wilson and Chow 2002]. In general, partitioning of a compound towards particles depends on its vapour pressure (controlled by the molecular form) as well as on the amount and chemical nature of particles available as condensation sites, and temperature (Figure 1.5). This means that understanding a trace substance such as PAH necessarily requires information on the other organic and inorganic substances and the amount of liquid water present in the particles [Jacobson et al. 2000].
20
Introduction
Figure 1.5. (a) Initial mixture of six equally abundant compounds of varying volatility (red=most volatile; violet=least volatile). Compounds marked with a central dot are also hydrophilic. (b) Distribution of the six compounds between the gas phase and a twophase particle according to volatility and hydrophilicity. The internal droplet is a largely aqueous phase, and the surrounding material is a largely organic phase.(c) Same as (b) but with randomized distributions [Pankow 2003].
Traditionally, it has been assumed that the semivolatile organic compounds (SVOC) remains in the gas phase until its concentration reaches a point that it sorbs onto available seed particles or homogeneously nucleates. This process continues until there is thermodynamic equilibrium between the gas and particle phases. It has been parameterized by the temperature-dependent equilibrium partitioning constant (partitioning coefficient) Kp (m3/ug) according to following relationship [Yamasaki et al. 1982, Pankow 1987]
Kp = cp / cg (TSP)
Equation 1.1
where cp and cg are the concentrations of the semivolatile material in the particle and gas phases, respectively; and TSP (ug/m3) is the concentration of total suspended particulate. The distribution cp / cg can be measured by collecting particles on a filter with an adsorbent downstream to catch the gas phase portion.
21
Introduction
Several theoretical predictions were developed in order to describe SVOC gas/particle partitioning. They are based on either adsorption model using subcooled liquid vapor pressure [Yamasaki et al. 1982, Ligocki and Pankow 1989], on the adsorption to the surface of the particle and absorption into an organic surface layer [Pankow 1994], the absorption model using octanol-air partition coefficient KOA [Finizio et al. 1997, Harner and Bildeman 1998], or combine black carbon adsorption and organic matter absorption [Dachs and Eisenreich 2000]. Odum et al. [1996] suggested that absorption to the organic component of urban particles is probably a more important mechanism in the partitioning of these compounds but that in a rural environment where there is a considerable amount of soil and inorganic continental mineral dust, adsorption still may be important. Lohmann and Lammel [2004] showed that theoretical values of gas-particle partition coefficient Kp calculated according to different models disagree with each other and developed another model which combines diesel soot adsorption and organic matter absorption. Thus, finding a really unified method to predict SVOC partitioning seems to be rather difficult.
Chemical Transformations
Another factor which can influence properties of atmospheric particles and their effects on climate and human health are chemical reactions processed at the surface and in the bulk of solid and liquid aerosol particles. Because of their high surface-to-volume ratio, fine particles, mainly composed of organics, can be very efficiently transformed upon interaction with solar radiation (photolysis) and reactive trace gases. Since the majority of organic aerosol mass remains poorly characterized, the study of chemical reactions involving organics in the condensed phase is sparse, especially in the ambient atmosphere. The most reactive atmospheric species are oxidants, such as the hydroxyl radical, atomic oxygen, ozone, and molecular oxygen. Organic aerosol components as well as the surface layers can react with them or other chemicals such as acids (HNO3, H2SO4, etc.) or water what causes so called chemical aging (Figure 1.6). Like in case of atmospheric gas-phase photochemistry oxidation, nitration, hydrolysis, and photolysis transform hydrocarbons and derivatives with one or few functional groups into multifunctional hydrocarbon derivatives. In general, if organic compounds are reactive, they become smaller and more polar through oxidative cleavage and the addition of oxygen. On the other hand condensation reactions and radical-initiated oligoor polymerization can decrease the volatility of organic aerosol components and promote the formation of secondary organic aerosol particulate matter. Generally chemical aging 22
Introduction
decreases reactivity of aerosol particles (with some examples like in case of oxidized PAH where oxy-PAH are more reactive than original PAH), increases their hygroscopicity and cloud condensation activity, and can change their optical properties [Pöschl 2005, Jacobson et al. 2000].
Figure 1.6. Generic reaction pathways for the atmospheric transformation (chemical aging) of organic aerosol components (left side: low molecular mass; right side: high molecular mass) [Pöschl 2005].
Hygroscopic Growth
The most ubiquitous condensable gas in the atmosphere is water vapour. It can adsorb to the surface or absorb into the bulk of the particles. For particles consisting of water-soluble material, the uptake of water vapour leads to hygroscopic growth even at low relative humidities. At water vapour supersaturation (RH>100%) aerosol particles can act as nuclei for the formation of liquid cloud droplets (cloud condensation nuclei, CCN). The minimum supersaturation at which aerosol particles can be effectively activated as CCN or IN, respectively, is called critical supersaturation. It is determined by the physical structure and chemical composition of the particles and generally decreases with increasing particle size. For insoluble CCN the critical supersaturation depends on the wettability of the surface (contact angle of liquid water), and for partially or fully soluble CCN it depends on the mass fraction, hygroscopicity, and surfactant activity of the water-soluble particulate matter. Generally hygroscopic growth of organic particles is less pronounced than for inorganic salts but still significant e.g. for proteins, surfactants and other macromolecular compounds, and some organic compounds found in wood smoke [Pöschl 2005, Jacobson et al. 2000].
23
Introduction
1.3. The general objective of the thesis One of the most important issues of an analytical procedure is a representative sample. Because both health and ecological impacts of certain compounds depend on their appearance form it is very important to distinguish between their concentration in the gas- and particle phase. Aerosol collection, especially for semi volatile compounds, is subject to significant artefacts connected with evaporation and adsorption processes and chemical degradation, therefore finding proper sampling technique is not an easy issue. The Steam Jet Aerosol Collector (SJAC, ECN Netherlands) was originally designed for the online determination of inorganic compounds from the particle phase. This work concentrates on the adaptation of the original concept of the SJAC for sampling of organic compounds both in particle and gas phase. For this purpose several modification of the sampling setup as well as optimisation using both laboratory generated particles and gaseous phase were carried out. In order to compare the modified SJAC with other currently available off-line sampling methods, and also to verify the sampler operation in the field, outdoor sampling campaign was carried out in autumn 2005. For this purpose besides SJAC three types of low volume filter based sampling techniques were used. These covered: –
charcoal denuded/filter/adsorber – to check the possible physical artefacts connected with adsorption of gaseous phase compounds to the filter and evaporation the originally particle associated compounds from the collected material
–
KNO2 denuded/filter/adsorber – to verify the potential chemical artefacts associated with degradation of collected particle and gaseous semivolatile compounds due to reactive gases occurring in the ambient air
–
undenuded sampler consisting of filter and adsorber – reflecting the most common approach in aerosol sampling.
24
2. AEROSOL MEASUREMENTS 2.1. Physical properties Complexity of the ambient aerosol, size and composition relationship and dynamic nature of its interactions both on the physical and chemical level creates necessity of the integrated approach to the aerosol measurements issue. Disconnecting physical characteristic from chemical analysis is therefore very improper when aiming into the deeper characteristic of ambient aerosol. Some of physical measurements like particle mass, number and size turned out to be the most useful for the sake of studies where the main task is to characterize the chemical composition of the given aerosol.
2.1.1. Particle mass concentrations Measurements of particulate mass concentrations, because of their simplicity, were one of the first applied aerosol measurement methods. They are important for regulatory and scientific reasons. The current US National Ambient Air Quality Standard for particulate matter refers to mass concentrations of particles smaller than 10 µm aerodynamic diameter (PM10), and a new standard for mass concentrations of particles smaller than 2.5 µm aerodynamic diameter (PM2.5) has been promulgated [Federal Register 1997].
2.1.1.1. Manual methods The most commonly used technique for measuring particulate mass concentrations involves filtration. [e.g. Chow 1995, McMurry 2000, Jacobson et al 2000, Wilson et al. 2002] Filters are weighed under controlled temperature and relative humidity conditions before and after sampling, and mass concentrations are determined from the increase in filter mass and the volume of air sampled. Combined impactor / filter samplers are most commonly equipped with inlets that eliminate particles above a specified size cut (typically 10, 2.5, 1 µm). Note impactors will be explained below. Fibre, membrane, granular bed and Nucleporefilters made from a wide variety of materials are used to collect aerosols [Lippmann 1989, Lee and Ramamurthi 1993, Chow 1995]. The physics of particle collection by filters is similar for all types of filters (Figure
25
Aerosol measurements
2.1). Particles smaller than about 0.1 µm are collected by diffusion. Because particle diffusivities increase with decreasing size, collection efficiencies increase as size drops below 0.1 µm. Particles larger than about 0.5 µm are collected by interception and impaction. Collection efficiencies by these mechanisms increase with increasing size. Therefore, collection efficiencies tend to increase with increasing size above 0.5 µm. It follows that the most penetrating particle size typically falls between 0.1 and 0.5 µm. The value of this most penetrating particle size depends on the filter characteristics and the flow rate through the filter [Lee and Liu 1980].
Figure 2.1. Filtration mechanisms and collection efficiency of a fibrous filter [Hinds 1982]
Overall collection efficiency of the filtration is usually 99% for aerosol measurement of the non-volatile material but factors including water adsorption/desorption by the filter media, adsorption or volatilization of species, particle losses associated with handling, etc., lead to higher uncertainties than those coming from the accuracy of gravimetric measurements. [McMurry 2000]. In the impaction process, the air stream is first accelerated through a (small) hole (nozzle) or slit. The air stream is directed so that it ‘‘impacts’’ on a surface. Depending on the velocity and pressure of the air stream, particles smaller than a certain size will follow the air stream around the impactor surface. Larger particles with sufficient inertia will impact on the surface. Cascade impactors with a series of stages (Figure 2.2), each with a successively smaller cut point, are commonly used to collect size-resolved atmospheric samples for
26
Aerosol measurements
chemical analysis e.g. Berner- [Berner et al. 1979] or MOUDI, the Micro Orifice Uniform Deposit Impactor [Marple et al. 1991]. Since mass measurements are integrated part of the chemical analysis this issue will be described in detail in the next sections.
Figure 2.2. Schematic diagram of cascade impactor.
2.1.1.2. Automated methods All currently available continuous measurements of suspended particle mass share the problem of dealing with semivolatile components of PM. In order not to include particlebound water as part of the mass, it must be removed by heating or dehumidification (Figure 2.3). However, heating also causes loss of ammonium nitrate and semivolatile organic components [Wilson et al. 2002]. The group of the on-line methods covers techniques using beta gauges, light scattering, piezoelectric crystals and harmonic oscillating element [McMurry 2000, Wilson et al. 2002]. First method uses the attenuation of beta emitting radiation from a radioactive source through a particle-laden filter measuring the aerosol mass concentrations. Two commercially produced beta gauges have been designated by EPA as Equivalent Methods for measuring sub-10 µm particulate mass concentrations. Piezoelectric crystal mass monitors
27
Aerosol measurements
determine aerosol mass loadings by measuring the change in the resonant vibrational frequency caused by the deposition of particles from a known volume of air.
Figure 2.3. Schematic showing major non-volatile and semivolatile components of PM2.5. Semivolatile components are subject to partial to complete loss during equilibration or heating. The optimal technique would be to remove all particle-bound water but no ammonium nitrate or semivolatile organic PM [Wilson et al. 2002].
The unique component of the harmonic oscillating element instruments is a tapered tube, the wide end of which is mounted to a rigid base. Particles are collected on a replaceable filter that is mounted on the narrow end of the tapered element, which is free to oscillate. The element vibrates at a frequency that depends on its geometrical and mechanical properties and on the mass of the filter. Tapered element oscillating microbalance (TEOM, Patashnick and Rupprecht 1991) as an equivalent method for PM10 and is also being used to measure PM2.5. The TEOM differs from the federal reference methods for particulate mass in that it does not require equilibration of the samples at a specified temperature and RH. Moreover, the TEOM samples at a constant temperature, typically heated to some temperature higher than the ambient temperature. Volatilization losses in the TEOM sampler can be reduced by change of the temperature from typical 50 °C to the 30 °C and by using Nafion dryers on the inlet like it is done in a real-time total ambient mass sampler (RAMS, Eatough et al. 1999, Pang et al. 2001, Pang et al. 2002a,b) which allows determination of total fine particulate mass, including semivolatile species, based on diffusion denuder and TEOM monitor technology.
28
Aerosol measurements
2.1.2. Number concentration Condensation nucleus counters (also referred to as condensation particle counters CNCs, CPCs) measure the total aerosol number concentration larger than some minimum detectable size. Particles are grown by condensation in CNCs until they are sufficiently large to be detected optically (Figure 2.4).
Figure 2.4. Principle of operation of the typical CPC [www.tsi.com] Diameter growth factors as large as ∼100-1000 are common. CNCs can detect individual particles as small as 3 nm (∼10-20 g), so they provide an extraordinarily sensitive means for detecting small amounts of material. A variety of substances have been used as the condensing vapour, but n-butyl alcohol and water are currently used most often. Because the supersaturation of the condensing vapour is very high, the response of CNCs is typically insensitive to the composition of the measured particles [McMurry 2000].
2.1.3. Size-resolved measurements Particle sizing measurements have been carried out using a number of methods using a variety of approaches. As a result different sizes can be reported for the same particle depending on the used technique. 29
Aerosol measurements
Optical particle counters (OPCs) are the most common method for counting and sizing large particles of up to several tens of microns in diameters. The basic principle of OPCs is to measure the amount of light scattered by individual particles as they traverse a tightly focused beam of light. A fraction of the scattered light is collected and directed to a photodetector, where it is converted to a voltage pulse. Particle size is determined from the magnitude of this voltage pulse by using a calibration curve usually obtained from measurements using spherical particles of known sizes and refractive index. Typically particles less than 0.2 µm in diameter are not big enough to produce signals above the noise level [McMurry 2000]. The aerodynamic particle sizers (APSs) are another method of simultaneously counting and sizing particles. As an aerosol is rapidly accelerated through a nozzle into a partially evacuated chamber, particles tend to lag behind the carrier gas due to inertia. The difference between the particle and gas speeds increases with size and density since inertia increases with these properties. Aerodynamic particle size is inferred from particle velocity, which is determined by measuring the time of flight taken by the particle to travel a known distance. Aerodynamic particle sizers use the scattered light to detect particles at both ends of the flight distance. The smallest reported size that can be measured with these instruments varies with instrument design and ranges from 0.2 – 0.5 µm in diameter. These instruments are capable of providing high-resolution information on aerodynamic size distribution in real time. However, the cooling and pressure drop associated with expansion of the flow into vacuum can lead to a change in relative humidity and may therefore affect measurements of particle size and possibly particle number if the particles are entirely composed of semivolatile material [McMurry, 2000]. Differential mobility analyzers (DMAs, also known as electrostatic classifiers) [Knutson and Whitby 1975, Winklmayr et al. 1991, Flagan 1998] classify particles according to their electrical mobility, which depends on gas properties, particle charge, and the geometric particle size but is independent of the other particle properties such as density. The principle of DMA is based on the monotonic relationship between electrical mobility and particle size with singly charged particles. To ensure a fixed percentage of particles carrying one unit of charge, the particles are introduced to a bipolar charge (“neutralization”) As a result, an equilibrium state is obtained, with known percentages of particles carrying no charge, a single charge, or multiple charges of both positive and negative polarity. These aerosol particles are then measured with the differential mobility analyzer. The mobility distribution, and hence size distribution, can be determined from the measurement. 30
Aerosol measurements
Using a CPC for particle detection, and the act of stepping or scanning the DMA’s voltage can generate a complete size-resolved number distribution. This is the principle applied in instruments such as the Differential Mobility Particle Sizer (DMPS) and Scanning Mobility Particle Sizer (SMPS) (e.g. TSI model 3080). These instruments are widely used to measure size distributions in the 3 – 1000 nm diameter range at a very high size resolution. However, the time resolution is limited to the period required to carry out a complete scan of the range of sizes required which can take up to several minutes. Artefacts caused by the presence of particles with multiple electron charges can be corrected for at the analysis stage because the positive and negative charges are distributed amongst the particles in a predictable manner, providing the aerosol reaches equilibrium in the neutralizer [McMurry 2000]. Advanced methods for the determination of volatility and hygroscopicity use two DMAs operated in series (tandem differential mobility analysis, V- and H-TDMA) [Pöschl 2005]. Electrical Low Pressure Impactor (ELPI) enables real time particle size distribution and concentration measurement in the size range from 30 nm up to 10 µm. The ELPI is based on combining electrical detection principles with low-pressure impactor size classification. The particle number concentrations in individual impactor stages are determined by charging the collected particles in a corona charger before they enter the impactor, and by measuring the current carried by these particles onto the electrically-insulated impaction plates using sensitive electrometers. Recently TSI invented FMPS (fast mobility particle sizer). It measures particles in the range from 5.6 to 560 nm, offering a total of 32 channels of resolution (16 channels per decade). It uses an electrical mobility measurement technique similar to that used in our SMPS. However, instead of a CPC, the FMPS spectrometer uses multiple, low-noise electrometers for particle detection. This produces particle-size-distribution measurements with one-second resolution, providing the ability to visualize particle events and changes in particle size distribution in real time.
2.2. Measurements of aerosol chemical composition Determining the chemical composition of ambient aerosols is much more complicated than counting and sizing them. This is mostly because atmospheric aerosols (in particular the organic fraction) can contain up to thousands of compounds spanning a wide range of
31
Aerosol measurements
chemical and thermodynamic properties [Saxena and Hildemann 1996]. Concentrations of organic components depend on the site and varies from the highest to the lowest - road tunnels, urban, suburban, rural, coastal area, Antarctica. For that reason different ways of sampling (low, medium and high volume samplers with the flow rates of ca. 20, 100 and 1000 l/min respectively) and sampling times (typically from hours to few weeks) are applied for various sites. There are many different methods of sampling, sample preparation and final analysis of aerosol components collected from atmospheric aerosols. The most essential are described below. Recently movement towards on-line sample collection and analysis has taken place. However conventional measurements of the aerosol chemical composition (offsite laboratory) hardly allow the resolution of the high spatial and temporal variability of atmospheric aerosols, they are still dominating in this field also as a reference methods.
2.2.1. Off-line measurements Most traditional methods for the sampling and chemical composition of ambient aerosol are “off-line”. Typically they involve the storage, transfer, sample preparation and final chemical analysis of material deposited on the sampling substrate in a laboratory some time after sample collection. Typical constituents of the off-line samplers, chemical characterization steps as well as problems associated with this issue are described in following sections.
2.2.1.1. Size-selective inlets Size-selective inlets define the particle size fraction being sampled. Air is drawn through these inlets to remove particles that exceed a specified aerodynamic diameter, typically 10, 2.5 and 1 µm, prior to exposure of the filter to the air stream. Inlets are characterized by sampling effectiveness curves that show the fraction of spherical particles of unit density which penetrate the inlet as a function of their aerodynamic diameters. Sampling effectiveness curves are summarized by their 50 percent cutpoints (d50, the diameter at which half of the particles pass through the inlet and the other half are deposited in the inlet), and by their slopes (the square root of the particle diameter ratios for inlet penetrations at 16 percent and 84 percent, [d16/d84]0.5). These curves are determined by presenting particles of known
32
Aerosol measurements
diameter to the inlet and measuring the concentrations before and after passage through the inlet [Chow 1993]. The principles of operation for different size-selective inlets include direct impaction, virtual impaction, cyclonic flow, selective filtration, and elutriation.
C
Figure 2.5. Inertial collection: a) impactor, b) cyclone, c) virtual impactor
The virtual impactor (Figure 2.5c) operates on a similar principle to those of the impaction process described before in section 2.1.1.1 (Figure 2.5a), with the exception that the impaction surface is replaced by an opening which directs the larger particles to one sampling substrate while the smaller particles follow the streamlines to another substrate. Cyclones employ tangential inlets which impart a circular motion to the gas, resulting in a centripetal force on the particles that moves them toward the walls (Figure 2.5b). Those particles reaching the tube wall either adhere to it, often with the help of an oil or grease coating, or drop into a “hopper” at the bottom of the collection device. Selective filtration uses the uniform pore size and known sampling effectiveness of etched polycarbonate filters manufactured by Corning CoStar (formerly Nuclepore Corporation) to collect large particles on a pre-filter and pass smaller particles to a backup filter. Elutriator inlets draw air into a stilled-air chamber surrounding an open duct which leads to the filter. When the upward velocity due to flow through the inlet exceeds the particle settling velocity, that particle penetrates the inlet. When the settling velocity exceeds the upward velocity, the particle is not transmitted [Chow 1995].
33
Aerosol measurements
2.2.1.2. Sampling substrates Filters are the most commonly used collection substrates [Chow 1995, McMurry 2000, Wilson et al. 2002]. They consist of a tightly woven fibrous mat or of a plastic membrane that has been penetrated by microscopic pores. No single filter medium is appropriate for all desired analyses, and it is often necessary to sample on multiple substrates when chemical characterization is desired. Several characteristics are important to the selection of filter media for compliance measurements: particle sampling efficiency (regardless of particle size or flow rate), mechanical and chemical stability (reactions with the deposit, even when submitted to strong extraction solvents, and they should not absorb gases that are not intended to be collected), temperature stability (retained porosity and structure in the presence of temperatures typical of the sampled air stream and of the analysis methods), blank concentrations (significant and highly variable concentrations of the chemicals which are being sought by analysis, each batch of the unexposed filters should be examined for blank concentration levels prior to field sampling), flow resistance and loading capacity, cost and availability. Some filters require pre-treatment before sampling for intended chemical characterization. For example, quartz-fibre filters (QFF) can be baked at high temperatures (greater than 500 °C) to remove adsorbed organic vapours. Nylon-membrane filters, used to collect nitric acid and total particulate nitrate, absorb nitric acid over time and need to be tested and/or cleaned prior to use. Filters intended for organic compound analyses need to be cleaned by extraction with proper solvents. For organic compounds measurements glass fibre filter (GFF) are not proper because of reactions, which can take place (elemental additives) and adsorption of the gas-phase. Quartz fibre filter still most common used for this purpose also suffer from adsorption bias. Teflon membrane filters (TMF) have shown less significant adsorption potential but problem is flow resistance. Teflon–coated glass fibre filter (TGF) with their better filtering qualities and reduced surface activity seems to be the promising option but their cost are much higher than e.g. QFF [McDow 1990, McDow and Huntzicker 1990, Chow 1995]. A variety of impaction substrates have been used for sampling ambient aerosols with impactors [McMurry 2000]. Aluminium foil is often used when samples are to be analyzed for organic and elemental carbon (OC/EC), since precleaning can reduce the carbon blanks in these substrates to very low levels. Carbon-free substrates are required since OC/EC analyses
34
Aerosol measurements
involve measuring the amount of CO2 that is released when the samples and substrates are burned. Precleaned Teflon or Mylar film is often used for ion chromatography analyses, since ion blanks can be made very low on such surfaces. Teflon membrane filters have also been used as impaction substrates. Although these are more costly than film or foil substrates, they do not require precleaning, and they are compatible with non-destructive analytical methods such as X-ray fluorescence analysis (XRF) or proton induced X-ray emission (PIXE). Cellulose-fibre and quartz-fibre filters can be soaked in solutions of gas-absorbing chemicals prior to sampling to collect HNO3, NH3, SO2, and NO2 as well as organic gaseous compounds. Sulphuric acid, oxalic acid, phosphoric acid, sodium carbonate, and citric acid have been used as active agents in the sampling of ammonia. Potassium carbonate and sodium carbonate with glycerine impregnating solutions have been used for collecting sulphur dioxide, nitric acid, and organic acids. Sodium chloride solutions have been used for nitric acid collection. Triethanolamine (TEA) has been used as an absorbent for NO2. The TEA is usually mixed with glycol or glycerine to improve its absorbing capacity [Chow 1995]. A number of solid adsorbents are available commercially [Zielinska and Fujita 1994]. Porous polymers, such as Tenax (phenyl-phenylene oxide), XAD (styrene-divinylbenzene) resins, and polyurethane foam (PUF), have found wide application in organic gas sampling. Tenax is useful sorbent, mainly because of its high thermal stability (up to 350 °C), and hence low bleed on thermal desorption and extremely low affinity to water vapour. The main disadvantage of Tenax is the possibility of chemical reactions occurring during sampling in the presence of some reactive gases and during thermal desorption [Zielinska et al., 1986]. Other types of sorbents, such as various types of charcoal, carbon molecular sieves and other carbon-based sorbents are also widely used, especially for more volatile, lower molecular weight compounds. However, due to their high surface activity, chemical reactions may occur during storage and desorption of the samples [Rudling et al. 1986]. For PAH and other SVOC – XAD [e.g. Kaup and McLachlan 1999, Aragon et al. 2000] and PUF are most popular [e.g. Smith and Harrison 1996, Obadasi et al. 1999, Mandalakis et al. 2002, Tsapakis and Stephanou 2005]. For those adsorbents solvent extraction is used for cleaning and releasing adsorbed gaseous compounds. Denuders are used as part of, or immediately behind, size selective inlets to remove gases that might interfere with aerosol measurements, or to quantify the concentration of gas phase compounds. Denuders take advantage of the fact that gas molecules diffuse through air much more rapidly than small particles [Chow 1995]. Geometries of the denuders can be rectangular, cylindrical, annual, or honeycomb; where as honeycomb design provides the 35
Aerosol measurements
highest gas collection surface area and minimum lengths [Koutrakis et al. 1993]. The denuder technique has been applied not only to measure nitric acid, sulphur dioxide, ammonia gases, semi volatile particulates, such as ammonium nitrate, but also semi-volatile organic compounds. The denuder internal surface is inert (such as glass or steel) and coated with substances that absorb or adsorb the gases of interest, followed by solvent extraction for cleaning or chemical analyses of gases. The denuder collection efficiencies of gases depend on the denuder surface area, temperature and relative humidity of the airflow, diffusivity and vapour pressure of the interest species, as well as presence of potential competing species. The gas collection efficiency decreases when the air temperature, relative humidity, flow rate, or gas vapour pressure are high. It is important to evaluate the denuder collection efficiency for compounds of interest over the range of conditions, which could be encountered during sampling [Turpin et al. 2000]
2.2.1.3. Artefacts and undertaken prevention Filter- as well denuder-based sampling methods are prone to artefacts caused by evaporation of particle components, adsorption or absorption of additional gas-phase components, and chemical reaction during sample collection, storage, transport, and preparation. The potential for measurement artefacts is particularly high for reactive and semivolatile organic aerosol components, and elaborate sampling techniques combining parallel or consecutive trains of denuders, filters, and adsorbent cartridges have been developed to minimize or at least quantify the effects outlined above [Jacobson et al. 2000, McMurry 2000, Chow 1995]. Semivolatile material is the most problematic constituent of the ambient aerosol when physical artefacts are concerned. The simplest method used to collect separately particulate and gaseous components is filter/adsorber technique (F/A). During such a sampling physical artefacts are caused by evaporation of components from particulate matter (PM, collected on the filter and inside denuder, blow off) and adsorption of gas phase (Gp, to the filter and PM collected on the filter, blow on). Evaporation can occur because of pressure drop in the sampler, which upsets the equilibrium between the deposited particles and the vapour or due to changes in temperature, relative humidity or composition of the incoming aerosol during sampling. This phenomenon underestimates concentration of components in the PM while the
36
Aerosol measurements
adsorption overestimates it. Even 100 % overestimation of PM because of blow on or 20 % underestimation - from blow off can occur [Mader et al. 2003]. One of the methods for correction of the adsorption bias is using the backup filter (BF) after the front filter (FF) mainly done for QFF [McDow and Huntzicker 1990]. This solution assumes that both filters adsorb the same amount of the Gp, so mass collected on BF has to be subtracted from that what was collected on FF. However reaching this equilibrium conditions seems to be somewhat problematic. First because of the time when the BF will reach the equilibrium and second evaporation of the material from PM collected on FF is neglected.
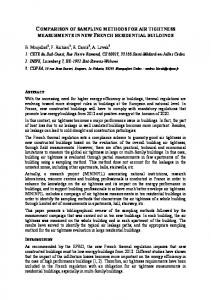
Figure 2.6. Important processes occurring in a denuder/filter sampler [Mader et al. 2001].
Other solution is to use denuder technique. This method also has its limitations [Mader et al. 2003]. Particle losses in the denuder can be determined by measuring the concentration of the non volatile elemental carbon (EC) fraction in separate parallel sampling line without denuder. Denuder efficiency can be verified by means of dynamic blank (again a separate parallel sampling line) where Teflon membrane filter (TMF) is placed before denuder and the material collected on the adsorber after denuder is treated as a gaseous material which escapes from denuder and should be subtracted from the mass collected on the FF of the proper
37
Aerosol measurements
sampling line. Till now however no way to avoid bias caused by evaporation of semivolatile material from PM inside the denuder was found. This process occurs as a result of a new equilibrium caused by fast diffusion of gaseous compounds to the adsorbing wall of denuder (Figure 2.6). Recent comparison of filter- and denuder-based methods used for diesel exhaust measurements showed that none of these methods can be applied for accurate determination of Kp [Volckens and Leith 2003]. Particle bounce is an inherent problem with impactors. Various techniques have been used to reduce it. One technique is to use a porous substance such as a glass or quartz fibre filter [Chang et al. 1999] material or polyurethane foam [e.g. Breum 2001]. These techniques may result in adsorption bias and a less precise size separation and yield a sample that must be extracted before chemical analyses can be performed. Coated substrates (with soft wax or grease) largely eliminate bounce and are commonly used for atmospheric sampling. Measurements have shown that liquid oils tend to provide better bounce-prevention characteristics than do viscous greases. While coatings that do not interfere with some types of chemical analysis have been found, no available coating is compatible with measurements of the particulate organic carbon content. An alternative approach involves sampling at elevated relative humidities, where submicron atmospheric particles typically contain enough liquid water to prevent bounce. [McMurry 2000, Wilson et al. 2002]
Another source of error is chemical degradation. PM is exposed to high amount of air containing reactive gases (e.g. O3, NOx) which pass through the collected material, especially during sampling with the high volume samplers. It can cause chemical reactions, hence the determined amounts of target analytes can be inaccurate or lead to missclassification. Schauer et al. [2003] has used two-line sampler one with denuder (activated carbon removing O3, NO2 and similarly reactive trace gases) and the other one without it. Some five- and six-ring PAHs and BaP were negatively correlated with ozone concentration. Plot of ratio of PAH concentration without denuder over concentration with denuder in line vs. ozone concentration showed that the deviation of the denuder ratio from unity describes the fractional loss of PAH deposited on the aerosol filter by chemical reaction with trace gas oxidants that are removed by the applied diffusion denuder (filter reaction artefact). Other approaches to retain O3 and other oxidants is to use honeycomb denuder coated with MnO2 or
38
Aerosol measurements
KNO2 solutions [Liu et al. 2006, 2005] or denuder with tubes coated with a water/glycerol KNO2 solution [Tsapakis and Stephanou 2003].
2.2.1.4. Determination of the chemical composition of semivolatile organic compounds Off-line methods relying on the collection of particles onto substrate include postanalysis with techniques such as scanning electron microscope (SEM, Figure 2.7), electron probe X-ray microanalysis (EPMA), neutron activation, X-ray fluorescence, atomic absorption, particle induced X-ray emission, GC, HPLC, ion chromatography (IC), secondary ion mass spectrometry (SIMS), inductively coupled plasma mass spectrometry (ICPMS), and laser microprobe mass spectrometry [McMurry 2000, Sipin et al. 2003].
Figure 2.7. SEM-micrographs of soot present in atmospheric samples from Paris. Soot consists generally at their emission in the atmosphere as single and approximately spherical particles of a few 10 nm in diameter (A) or organized in a chain or clusters of a few 100 nm (B). After time passed in the atmosphere, soot coalescence in large aggregates of few micrometers (C and D) [Baulig et al. 2004].
39
Aerosol measurements
Electron microscopy in combination with electron probe X-ray microanalysis (EPXMA) has been valuable in analyzing single particles for size, morphology, and chemical composition. Collected particles are irradiated by electrons under vacuum conditions. Information on elemental composition is achieved by measuring the X-ray energy spectrum produced by interactions of the electrons with the particles. The measurement of volatile species by electron microscopy is problematic. Volatilization occurs because particles are exposed to vacuum conditions for extended times during analysis and because samples are heated by the electron beam. For example, nitrates, which tend to be relatively volatile, are usually not detected by X-ray analysis even though they are often present in significant quantities. Similar losses of semivolatile organic compounds are likely. Despite the limitations outlined above, electron microscopy has provided valuable information on the composition, sources, and atmospheric transformations of atmospheric aerosols. Electron microscopy is the only individual particle technique that provides both morphological and compositional information on ultrafine particles. Laser microprobe mass spectrometry (LAMMS) also involves the off-line analysis of particles collected on a substrate. Particles are irradiated with a high-power pulse laser, and the ejected ion fragments are analyzed by mass spectrometry. LAMMS can detect trace levels of metals in individual particles at the parts-per-million level, speciate inorganic compounds including nitrates and sulphates and is able to detect trace organic compounds. Because LAMMS is an off-line technique that exposes particles to a vacuum environment before they are analyzed, particle composition can be altered by chemical reactions or evaporation before analysis. Mass spectral analysis is commonly used for depth profiling of aerosols [Sipin et al. 2003]. In TOF-SIMS technique charged species (sample is bombarded with a pulsed beam of high energy ions) are ejected off the surface as secondary ions and detected by time-of-flight mass spectrometry. It has been applied to size-segregated filter samples from forest fires, snowmobile exhaust, lava, sea salt, and dust and has shown that the surface composition of these particles can be very different from the core.
Sample preparation is the essential step in chemical characterization of collected aerosol material for SVOC. First components have to be isolate from the matrix. This is usually done by thermodesorption or extraction [e.g. Aragon 2000, Peltonen and Kuljukka 1995]. Although first method has obvious limitation because of high boiling compounds (lower desorption efficiency and degradation) thermodesorption is preferred over solvent 40
Aerosol measurements
extraction, since it avoids the dilution of an enriched sample with a solvent; it allows the entire amount of a collected sample to be injected at once into a gas chromatographic column, thus providing maximum sensitivity [Lanier and England 2004]. Extraction is performed with various solvents (hexane, dichloromethane, acetone, toluene, petrol, ethers, benzene, isopropanol, acetonitrile, ethylacetate, hydroxytoluene) and different techniques (Soxhlet, sonification, pressurized fluid extraction, supercritical fluid- and microwave-assisted extraction). Extraction times range from 15 minutes to 20 hours. Also other alternative methods are used like extraction for the isolation of the collected compounds from the aerosol samples. Because of the complexity of the aerosol sample very often clean up steps are necessary. It covers filtration of the extract where remaining fine particles and/or water has to be discarded. Silica acid or alumina filled columns or HPLC are used to pre-separate polar, semi-polar and non-polar components. Size Exclusion Chromatography on the other hand separates isolated compounds according to the molecular size.
Chemical analysis
There are many different methods of the final analysis of organic components collected from atmospheric aerosols. The most essential are thermo/optical- chromatographic and electrophoresis methods as well as spectroscopic methods and mass spectrometry [Peltonen and Kuljukka 1995, Jacobson et al. 2000, McMurry 2000]. Thermal/optical carbon analysis (TOCA) is a technique for separating and measuring the total amount of organic and elemental carbon, generally from quartz filter samples. Generally sequentially heating the filters with temperatures range from 200 to 800°C take place. Once the maximum temperature has been reached and organic compounds cease to be liberated from the sample, a small amount of oxygen is added to the gas mixture over the sample. This causes combustion of any elemental carbon present on the filter. The CO2 is then either measured directly by nondispersive infrared spectrometry (NDIR) or in some cases passed through a methanator, which reduces the carbon to CH4, which is then measured by flame ionization detection (FID). A problem with this type of carbon analysis is that some organic compounds char during the initial heating stages, turning into elemental carbon. This leads to underestimation of organic carbon and overestimation of elemental carbon [Cadle et al. 1983]. Because of relatively easy automation this method is often used for on-line measurements [McDow and Huntzicker 1990].
41
Aerosol measurements
Gas chromatography coupled with mass spectrometry detection (GC-MS) is widely used, it allows identification of many classes of volatile and semivolatile components [e.g. Mazurek et al. 1987, Rogge et al. 1993]. Saxena and Hildemann [1996] also present a thorough discussion of some problems in using GC-MS alone for identifying atmospheric organic compounds. A few of these problems are related to gas chromatography itself: polar solvents, especially aqueous solutions, can not be introduced onto the GC column. Polar compounds such as carboxylic acids which do dissolve in certain nonpolar media may bind so strongly to the GC column that they will not elute or may not be sufficiently volatile. These compounds must first be derivatized to less polar forms. Other kinds of detectors used with GC are FID and in rare cases also nitrogen and phosphorus detector (NPD). Relatively new powerful method is the comprehensive two-dimensional GC (GCxGC) coupled with time of flight mass spectrometry (TOFMS) was used for the chemical characterization of the ambient aerosol [Welthagen et al. 2005]. In order to analyze different compound classes GC uses a wide range of columns with very different properties (polarity, optical activity etc.) but the greater variability of (HP)LC application derives from the various combinations of a very wide range of columns with different polarity and the variation of solvents, usually even within one chromatographic run. There are other two distinct advantages in using LC methods, especially for polar compounds: aqueous solutions can be injected onto many columns, and second, polar compounds do not need to go through a derivatization step in order to elute from most LC columns. For PAH usually fluorescent (FLD) but sometimes also UV detectors are applied [Peltonen and Kuljukka 1995, Aragon 2000]. The use of liquid chromatography coupled to mass spectrometry (HPLC-MS, e.g. with Fourier transform ion cyclotron resonance mass spectrometry (FT-ICR-MS) or nuclear magnetic resonance (NMR) shows its potential in this research area. It may be useful especially for the investigation of large biomolecules such as proteins and humic substances (complex class of refractory, high molecular weight, heterogeneous organic compounds often associated with biomass burning and degradation of plant matter). Characterizing the water-soluble organic carbon (WSOC) in aerosols but also in fogs, clouds, and rain have employed analysis by means of IC, Size exclusion chromatography (SEC, separate compounds depending on their molecular weight) and capillary electrophoresis, (CE).
42
Aerosol measurements
2.2.2. Real-time measurements Turpin et al. [1990] developed an automated instrument for in situ measurements of fine particle organic and elemental carbon. Sampling involves parallel trains for collecting particles and for adsorbing organic vapours. Particulate samples (train 1) are collected on a quartz filter after coarse particles are removed with a 2.5 um impactor. Adsorbing vapours (train 2) are collected on a quartz filter located downstream of a Teflon filter that removes particles but presumably not organic vapours [McDow and Huntzicker, 1990]. Samples are analyzed for organic carbon and soot by TOCA method. An ambient carbon particulate monitor is available commercially [Rupprecht et al. 1995]. In this instrument, sub-10 µm particles are collected at 16.7 l/min. Sources of measurement error include evaporative losses, pyrolysis of the sample which may lead to an overestimate of the soot concentration, and omission of particles smaller than 0.14 µm, which will lead to an underestimate of the true particulate carbon content. Several groups have reported techniques for in situ measurements of particulate sulfur concentrations. Many of these techniques involve the use of flame photometric detectors (FPD). Particles and gases are usually separated before they enter the hydrogen-rich flame. For measurements of sulphur-containing gases, the sample flows through a filter prior to entering the flame. For particulate sulphur measurements, the interfering gases are usually removed with a denuder. Jaklevic et al. [1981] developed an automated sampler in which particulate sulphur concentrations were determined by X-ray fluorescence (XRF) analysis. Ion chromatographs (ICs) have also been adapted to semicontinuous measurements of particulate and gaseous species. Simon and Dasgupta [1995] and Khlystov et al. [SJAC, 1995] used an IC to analyze the effluent from a parallel plate wet denuder to determine concentrations of gas-phase nitrous (HONO) and nitric (HNO3) acids. Particulate sulphate, nitrite, and nitrate were collected with a vapour condensation aerosol collection system and analyzed by IC. SJAC will be described in detail in the experimental section. Over the past few years substantial progress has been made in the development of aerosol mass spectrometers for real-time measurements of size-selected (single) particles. As the methods of vaporization, ionization, calibration, and data analysis are improved, these instruments promise reliable quantitative analyses, especially for chemical elements and inorganic species. Some of them also allow differentiation between surface and bulk composition, but the influence of matrix effects on vaporization and ionization efficiencies
43
Aerosol measurements
and thus on the interpretation of the measurement data still remains to be sorted out reliably [McMurry 2000, Sipin et al. 2003, Pöschl 2005]. This rapidly advancing technology involves rapid depressurization of the aerosol, formation of a particle beam, and irradiation of particles by a high power pulse laser to produce ions that are analyzed by mass spectrometry. Although particles must be brought into a vacuum before they can be analyzed, the time at reduced pressure is typically ∼ 1 ms, which is short enough to avoid losses of most semivolatile compounds, although some loss of water is likely. Most of the real-time instruments currently under development measure particle composition with time-of-flight mass spectrometry. Depending on particle size, however, various approaches are used to trigger the pulse laser and to measure particle size. For particles larger than about 0.2 µm, particles are usually detected as they flow through a volume illuminated by a low-power continuous wave (cw) laser. Although most measurements to date do not provide quantitative information on mass concentrations, recent works has provided some encouragement that obtaining quantitative mass concentration may be possible [Sullivan and Prather 2005 and references there in].
44
3. THE STEAM JET AEROSOL COLLECTOR 3.1. The original setup of the instrument Aerosol growth technique is widely used in Condensation Particle Counters (CPC). Commonly used condensing liquid is butanol and recently also water. The Steam Jet Aerosol Collector (SJAC, Khlystov et al. 1995) and Gas and Aerosol Monitoring System (GAMS, Simon and Dasgupta 1995) were the first approaches using water condensation onto PM for chemical measurements of aerosol. This technique was later applied to other methods with different technical setups e.g. Versatile aerosol concentration enrichment system (VACES, Kim et al. 2001), Particle-into-Liquid Collector (PILC, Weber et al. 2001), a condensationgrowth and impaction system, (C-GIS, Sierau et al. 2003). All those approaches were specifically interested in water soluble fraction of PM.
Figure 3.1. Overview of SJAC sampling system for automated inorganic compounds measurement [Slanina et al. 2001]. SJAC was originally designed for online determination of inorganic ions (NH4+, SO42-, NO3-, Cl-) in the particle phase. In this concept (Figure 3.1) the aerosol passes through a wet denuder [Keuken et al. 1988] in order to remove gas phase components (NH3, HNO2, HNO3, SO2). The absorption solution is a 10−5 M carbonate solution. Rapidly mixing (within 0.1 s), 45
The Steam Jet Aerosol Collector
the aerosol (cold stream) with the injected water steam (hot stream) creates supersaturation conditions. This causes condensational growth of particles to droplet sizes of several microns. Those are removed by means of the cyclone with the cut point aerodynamic diameter of about 2 µm. The solution collected in the cyclone is constantly pumped out with a peristaltic pump and is subsequently analysed online for inorganic compounds by ion chromatography. The mass sampling efficiency of the instrument was found to be at least 99%. In fact, counting particles at the inlet and outlet of the SJAC indicates that the efficiency is at least 99.9% for particles over 10 nm [Slanina et al. 2001]. Not only water-soluble aerosol (ammonium sulphate) is sampled but the same sampling efficiency is also found for insoluble material such as carbon black. Important parameters such as the sample flow, volume of the condensation vessel, thermal isolation of the vessel, efficiency depending on sample flow and amount of steam injection, and design of the cyclone were systematically studied in order to optimize the apparatus. The conclusion, quite surprising, was that the apparatus functions rather well regardless of the variations of these parameters. The optimal conditions for sampling are obtained at a sampling flow of ca. 20−30 l/min, using 2.5 g/min steam. About 0.4 ml condensed water which leaves the cyclone is used for the analysis, the rest of the water is found back in the condenser and as vapour pumped off by the sampling pump. The condenser (glass vessel ~ 2 l) is used to reduce the amount of steam entering the pump and to reduce the influence of ambient temperature fluctuations on the flow rate into the sampler [Slanina et al. 2001].
3.2. Evolution of the sampling setup 3.2.1. Instruments and materials Instruments -
Chiller − Aquatherm WGB, Flüssigkeitskühler, Gilching, Germany
-
Water pump − Waters Model 590 Programmable Solvent Delivery System Module, Milford, USA
-
Main air pump (1) − Desaga, Gasprobenehmer GS 450, Sarstedt, Germany
-
Cyclone air pump (2) − Desaga, Gasprobenehmer GS 312, Heidelberg, Germany
-
Power supply − Variable Transformer EA-4000, Elektro-Automatik, Viersen, Germany
46
The Steam Jet Aerosol Collector
Materials -
Water – from Milli-Q Plus Ultrapure Water Purification Systems – Millipore Molsheim, Deutschland
-
2-Propanol, for analysis grade, Merck, Darmstadt, Germany
-
Amberlite XAD4 resin – styrene divinylbenzene copolymer – Rohm and Haas Company, USA
-
Teflon tube, ID 1 mm, VWR, Germany
-
Stainless steel capillary, 1 m length, 0.2 mm ID, 0.5 mm OD, VWR, Germany
-
Round-bottom glass flasks: 100, 250, 500 ml − Duran, Germany
-
Home made adsorbent cartridge (Figure 3.3): �
stainless steal extraction cell, ID 20 mm, 118 mm length, 36 ml volume, Dionex, USA
�
Quartz wool, VWR, Germany
�
Stainless steal end cup
�
Steal mesh with holes diameter ca. 1 mm
�
Viton seals
3.2.2. The modified SJAC setup In this work adaptation of the original concept of the SJAC for sampling water soluble as well insoluble organic compounds both in particle and gas phase is performed. SJAC modification is based on the reverse to original sampling order concept [Antkowiak et al. 2005]. In this setup no denuder technique is used therefore collection of gas phase components follows particle phase collection (Figure 3.2). Ideally Gp and PM go through the inlet to the mixing chamber, where steam is injected. Then water vapour starts to condense onto PM because of supersaturated conditions. Grown particles are removed by the cyclone like in the original setup (aqueous solution of particle phase sample P). Gp compounds either absorb in water steam condensed inside the cooler (aqueous solution of gas phase sample G1) or are adsorbed in the adsorbent cartridge containing XAD4 (gas phase sample G2). The addition of the cooler prior to XAD4 adsorber was necessary in order to get rid of the high amount of water from the cyclone exhaust, which would cause increase of the pressure drop (XAD4 swelling) and lower sorption efficiency of the adsorbent. Because of low solubility of
47
The Steam Jet Aerosol Collector
most of the organic material in water samples of the modified SJAC can not be analysed by means of online methods so previous extraction step with offline analysis is carried out. primary PM
mixing chamber
aerosol inlet
grown PM IzOH/H2O
steam cooler condensational growth sector
G1 cyclone
P
G2 XAD4 tube
pump 1
pump 2
Figure 3.2. Setup of the modified SJAC for differential measurements of organic compounds in the gas and particle phase; P – particle sample, G1, G2 – gas phase samples [Antkowiak et al. 2005].
3.2.3. Hardware development 3.2.3.1. Adsorbent cartridge In order to minimize the amount of the handling steps regarding Gp adsorber, which might have resulted in increased blank level, stainless steel ASE extraction cell as an adsorbent (XAD4) cartridge was used. Additional connectors as well as other internal parts have been made to adjust the cartridge to the modified SJAC sampling setup (Figure 3.3).
48
The Steam Jet Aerosol Collector
Viton seal Metal mesh
End cup
XAD4 and glass wool inside ASE extraction cell
Figure 3.3. Adsorbent cartridge based on ASE extraction cell
3.2.3.2. Steamers Original boiling pot Since SJAC was designed for inorganic compounds measurements there was concern the plastic (polyethylene) parts might somehow disturb measurements of the organics. On the other hand during first test with the instrument it turned out that plastic connector is not always tight what can disturb its sampling efficiency. Therefore polyethylene connector was replaced by glass joint and also connectors to the cooler and cyclone outlet were changed for glass ball joints (Figure 3.4).
a)
b)
glass joints
Figure 3.4. Main parts of the original− (a) [de Groot, www.ecn.nl / Biomass, Coal and Environmental Research / Air Quality and Climate Change] and modified SJAC (b) with changed joints as well the cooler and sample P collection adapters
49
The Steam Jet Aerosol Collector
Electrical resistance heated steal capillary The Electrical resistance heated steal capillary (Figure 3.5) was tested as a steam generator. A stainless steel capillary was connected to the mixing chamber of the SJAC by means of a Teflon adapter and on the other side to a HPLC pump. In order to generate steam a direct electric current was applied to the capillary. For the safety conditions Teflon tube was used as isolation.
b)
a)
steam
resistive heated capillary home made Teflon / steal adapter
water
transformer
HPLC pump
insulation
Figure 3.5. Electrical resistance heated steal capillary as a steamer in SJAC: a) home made Teflon / steal adapter; b) general scheme.
50
4. LABORATORY STUDIES 4.1. Particle number measurements – instruments and methodology Particle collection efficiency is crucial parameter characterising the usefulness of the aerosol sampler. Therefore several types of non volatile, laboratory generated particles were applied in order to verify the utility of the modified SJAC setup.
Instruments -
Scanning Mobility Particle Sizer (SMPS) Model 3936 – TSI Inc., St. Paul, Minnesota, USA (Figure 4.1, left),
-
Condenstion particle counter (CPC) Model 3025A – TSI Inc., St. Paul, Minnesota
-
Flow meter − Gilibrator-2 – Gilian Instrument Incorp., USA
-
Notebook, Fujitsu-Siemens, Germany
-
Humidity / Temperature Meter (RH/T-Meter) − Lutron, Taiwan
-
Universal Oven, Memmert, Schwabach, Germany
Figure 4.1. TSI Scanning Mobility Particle Sizer, Model 3936.
51
Laboratory studies
Materials -
Home made dryer (Figure 4.2) plastic tube: 30 cm length, 10 cm OD; metal net: 32 cm length, 1.5 cm OD filled with the silica gel, ca. 4 mm diameter, VWR, Germany
-
1-Butanol, for analysis grade, Merck, Darmstadt, Germany
-
Glass cooler, VWR, Germany
Silica gel Metal net Figure 4.2. Scheme of the home made dryer
All measurements of the SJAC particle separation efficiency were carried out by means of SMPS. Working conditions are summarised in the Table 4.1.
Table 4.1. SMPS − operating conditions Controller platform
Model 3080 with 3077 Aerosol Neutralizer
Electrostatic Classifier
Long DMA, Model 3081
Particle counter:
Ultrafine CPC, Model 3025A
Aerosol flow:
0,3 l/min
Sheath flow:
3,0 l/min
Impactor nozzle
0,0457 cm
Theoretical size range:
13-833 nm
Particle collection efficiency measurements of the modified SJAC setup were carried out with different steam parameters and were compared to measurements without steam application. Locations of the sampling lines (m, n) are shown in the Figure 4.3. In order to minimise the water vapour entry to the SMPS instrument which could disturb the particle measurements either location “n” where water vapour was below 30% RH was used or home made dryer with the heater was applied (Figure 4.2). Drying efficiency of the home made dryer was assured by daily drying the silica gel in the oven (120°C overnight) and was checked by means of the RH/T-Meter. It has found that the home made dryer sufficiently reduced (from 100% to 20% RH) water vapour from the sampling line for minimum 8 hours during particle measurement tests.
52
Laboratory studies
~ 100 °C m) heater
aerosol inlet
dryer
SMPS
cooler
steam
P
n)
G2
G1 cyclone
SMPS
XAD-4 tube
pump1
pump 2
Figure 4.3. Scheme of the particle sampling lines (m, n) in the modified SJAC setup.
4.2. Particle generation 4.2.1. Instruments and materials Instruments -
Spark generator − Aerosolgenerator, GFG 1000 - Palas GmbH, Karlsruhe,Germany
-
Flow controller − Digitaler Strömungsmesser – Analyt, Germany
-
Chiller − Büchi 700, Recirculation Chiller, Büchi, Switzerland
-
Muffle oven, M 110 − Heraeus, Hanau, Germany
-
Manometer − Magnehelic Incorp., Michigan, USA
-
Thermometer, ama-digit − Precision, Germany
-
Thermostat − Haake Model F3, Haake, Karlsruhe, Germany
Materials -
n-Octacosane (C28), > 99%, Merck – Schuchardt, Hohenbrunn, Germany
-
high resistance wire D 0.2 mm
-
Teflon tube, ID ca 0.5 mm, VWR, Germany
-
Silicone tube, VWR, Germany
-
Mixing reservoir − 50 ml, two neck glass round flask
-
Headline Filters, Disposable Inline Filters, DIF-N50, Headline House, Kent, England
53
Laboratory studies
-
Candle
-
Argon (Ar) 5.0, Linde, Unterschleissheim, Germany
-
Synthetic air according to DIN 3188, Linde, Unterschleissheim, Germany
-
Nitrogen (N2) 5.0, Linde, Unterschleissheim, Germany
-
Needle valve, Swagelok Company, Solon, USA
-
Silica gel, VWR, Germany
4.2.2. Graphite particles Chain aggregated soot particles (5-10 nm primary particles) were delivered from the spark generator supplied in Ar (0.8 bar, 3 l/min) in the mean diameter range from 35 to 300 nm. Particles with mean diameter of ca. 35, 70 and 170 nm and the geometric standard deviation (GSD) of 1.6 were obtained with spark frequency of about 3, 100 and 800 Hz respectively and were immediately diluted by means of dilution unit and then by means of synthetic air. The dilution unit (one or two in series) consisting of a needle valve and headline filter in parallel (Figure 4.4) was found to effectively reduce the soot particle concentration by a factor ranging from 5 to 100. 250 and 300 nm particles were generated by 300 and 400 Hz spark frequency respectively and using a 20 l glass vessel for continuing coagulation growth of the soot particles. Number concentration of soot particles was adjusted by means of the dilution unit consisting of the filter and needle valve. Location of the spark generator, SJAC as well as other parts of the setup for soot particle generating are shown in the Figure 4.4.
mixing reservoir
bypass
pressurised air
SJAC
filter coagulation vessel (optional)
pressurised Ar
Palas generator filter
dilution unit
Figure 4.4. Soot particles generation setup.
54
Laboratory studies
4.2.3. Octacosane particles Octacosane (C28) condensation particles were generated by purging constant flow (ca. 150 ml/min) of nitrogen through a heated impinger vial containing C28. In order to maximize the vaporization area a rolled piece of quartz fibre filter (QFF) soaked in octacosane was inserted into the impinger. QFF was previously backed in 450°C in the oven to prevent contamination. Additionally to increase the vapour mass transfer heating of the impinger outlet tubing by means of high resistance wire was used. For safety conditions Teflon tube was used as electrical insulation. Subsequent cooling of the C28 vapour led to homogeneous nucleation (Figure 4.5). After dilution with the air stream and cooling the total stream (ca. 19°C) monodisperese aerosol with median diameter of 70 and 110 nm was obtained at temperatures of the impinger vial of 80 and 90°C, respectively.
bypass
pressurised air pressurised N2
high resistance wire
cooler
filter
SJAC
filter
transformator
thermostat
chiller
octacosane
Figure 4.5. Octacosane particles generation setup
4.2.4. Indoor air and candle light particles In order to increase the particle number concentration from the indoor level (clean laboratory air) candle light particles were used what resulted in increasing the total number concentration by a factor of three. The candle was lit under the hood and a stream of the laboratory indoor air with spontaneously created particles was sampled through the SJAC.
55
Laboratory studies
4.3. Gas phase generation In order to estimate the amount of possible bias caused by the transfer of components from gas phase to the particle fraction pure vapours of individual semi volatile organic compounds (SVOC) with dilution air were applied into the modified SJAC setup.
4.3.1. Instruments and materials Instruments -
Chiller − Büchi 700, Recirculation Chiller, Büchi, Switzerland
-
Flow controller − Digitaler Strömungsmesser – Analyt, Germany
Materials -
n-heptadecane (C17) > 99%, Fluka Chemie, Buchs, Switzerland
-
n-undecanol (C11OH) > 99%, Fluka Chemie, Buchs, Switzerland
-
naphthalene (Nap) > 99%, Aldrich Chemie, Steinheim, Germany
-
4 - metoxyacetophenol (MOAP) > 99%, Aldrich Chemie, Steinheim, Germany
4.3.2. Methodology mixing reservoir
bypass
SJAC
pressurised air filter
XAD-4
pressurised N2 filter
thermostat
compound to be analysed
Figure 4.6. Gas phase measurements setup, dashed lines represent additional sampling line used for reference measurement of the gas phase concentration.
Pure vapours of individual SVOC (heptadecane, undecanol, naphthalene and metoxyacetophenol) with dilution air were applied to the sampling system. Vapour generation took place by purging constant flow of particle free nitrogen (20 - 100 ml/min, depending on the compound and the desired concentration) through a thermostated impinger vial containing 56
Laboratory studies
the compound to be analysed. Additional sampling line was occasionally used for reference measurement of gas-phase concentrations for characterization of the internal losses of the sampling system (Figure 4.6).
4.4. Chemical characterization of the fractions of SJAC 4.4.1. Instruments and materials Instruments -
Gas Chromatography (CG) system – equipped with Mass Spectrometer (MS), Detector and Autosampler Controller, all parts HP 6890 Series – Hewlett Packard, USA
-
Evaporator - Integrated Vacuum System – Büchi Vac V-513 with Büchi Syncore Platform – BÜCHI Labortechnik AG, Switzerland
-
ASE Accelerated Solvent Extractor – ASE® 200 Extraction Systems – Dionex Corporation, USA
-
Milli-Q Plus Ultrapure Water Purification Systems – Millipore Corporate; USA
-
Condensation Particle Counter (CPC, Model 3020) TSI Inc., St. Paul, Minnesota, USA
-
Ultrasonic bath, Sonorex RK 510S, Bandelin Electronic, Berlin, Germany
Materials Standards: -
heptadecane, undecanol, naphthalene and metoxyacetophenol (see 4.3)
-
n-Tetracosane-d50 (D50) in toluene, 1 mg/ml, Chiron AS, Trondheim, Norway
Solvents: -
Water – from Milli-Q Plus
-
Double distillate water
-
Hexane – for residue analysis grade, Sigma-Aldrich, Germany
-
Toluene – for residue analysis grade, Sigma-Aldrich, Germany
-
Acetone – technical grade, – for analysis grade, for residue analysis grade, Merck, Darmstadt, Germany
-
Methanol − for residue analysis grade, Merck, Darmstadt, Germany
57
Laboratory studies
-
Dichloromethane – for residue analysis grade, Sigma-Aldrich, Germany
-
Cyclohexane – for residue analysis grade, Sigma-Aldrich, Germany
Other materials: -
Sodium Sulphate (Na2SO4), ACS, 99.0% min. – VWR, Germany
-
Helium, 5.0, Linde, Untterschleissheim, Germany
-
Folded paper filters Ø 150 mm – Schleicher & Schuell Microscience GmbH, Germany
-
1.5 ml autosampler vials, VWR, Germany
-
Büchi glass vessel, BÜCHI Labortechnik AG, Switzerland
4.4.2. Sample preparation − methodology Standard solutions Solution of the deuterated alkane (n-Tetracosane-d50, D50) was prepared by dilution of stock solution in hexane to the final concentration of 95 ng/µl. Initial solutions of each test compounds − heptadecane, undecanol, naphthalene and metoxyacetophenol − were prepared by dissolving each of the standards in toluene to the final concentration of 2.3, 3.0, 1.9 and 2.7 µg/µl respectively. Mixtures of all test compounds were prepared by dilution of the toluene standards with acetone (for water spiking experiments) and hexane (for GC analysis) to the concentration of 230, 300, 190 and 270 ng/µl respectively.
Aqueous samples – particle fraction P and gas phase fraction G1 Liquid-liquid ultrasonic-assisted extraction with dichloromethane (4 x 25 ml) was performed direct in the sample flasks. Extracts were combined and dried with sodium sulphate, filtered with paper filter direct into the Büchi glass vessel. Then the solvent was reduced to ca 1 ml in Büchi evaporator, 1 ml hexane was added and finally further reduced by means of gentle stream of nitrogen to ca 500 µl in 1.5 ml autosampler vials. Extraction efficiency tests were performed and the recovery (Rec, calculated according to Eq. 4.1) was taken into consideration during later calculations of the masses of the compounds of interest (Eq. 4.2).
58
Laboratory studies
mx
Rec = (m y / m x) · 100%
Equation 4.1.
m Rec = (m / Rec) · 100%
Equation 4.2.
initial mass of the compound of interest without the previous sample preparation procedure
my
mass of the compound of interest with the sample preparation procedure
m Rec
final mass of the compound of interest with respect of the recovery during sample preparation procedure
m
mass of the compound of interest corrected for recovery during sample preparation procedure
XAD4 samples – gas phase fraction G2 XAD4 cartridges were extracted with method 1 by means of Accelerated Solvent Extraction (ASE) based on the Dionex Application Note 347 [Dionex Extraction Applications]. XAD4 after each proper extraction (method 1) was additionally cleaned and dried (method 2) by ASE (Table 4.2).
Table 4.2. ASE extraction method details method 1
method 2
Solvent:
acetone/hexane 30/70 (v/v)
acetone
Temp.:
100°C
100°C
Pressure:
100 bar
100 bar
Static time:
5 min.
5 min.
Number of cycles:
3
1
Flush volume:
90%
90%
Nitrogen purging time:
20 s
200 s
In order to minimize the blank concentration of XAD4 samples ASE extraction cells were used as adsorbent containers during sampling. ASE extraction was followed by drying extracts with sodium sulphate, filtration with paper filter direct into the Büchi glass vessel, reduction of solvent in Büchi evaporator and finally further reduction by means of gentle stream of nitrogen to ca 500 µl in 1.5 ml autosampler vials.
59
Laboratory studies
Extraction efficiency tests were performed and the recovery was taken into consideration during later calculations of the masses of the compounds of interest (Eq. 4.2).
4.4.3. GC-MS analysis − methodology Extracts in hexane containing the analytes were determined by means of GC-MS system. Characteristic of the analytical instrument and working conditions are described in the Table 4.3.
Table 4.3. GC-MS operating conditions Varian CP 8944 capillary column, Factor Four 30m x 0.25 mm Column
fused silica column coated with 0.25 µm VF-5MS, modified equivalent of 5% phenyl 95% methyl
Injection volume
2 µl
Injection mode
Splitless
Injection port temperature
280°C
Flow rate
1,5 ml/min, He
Temperature programme
40°C for 2 min.; 30 K/min to 80°C; hold for 2 min; 20 K/min to 310°C; hold for 5 min
Detector
quadrupole mass spectrometer
Mass spectrometer
Electron impact, 70 eV
MS temperature
250°C
The standard mixture was analysed in scan mode first in order to see the fragmentation pattern of each compound. All the ions in between 35 and 570 amu were scanned. Qualitative analysis was performed on the basis of characteristic retention times and mass spectra compounds of interest. After scanning the standard target ions were determined for each compound and used for quantitative analysis (Table 4.4).
Just before analysis all final samples were spiked with the known amount of the internal standard D50 to correct the variations of the injection volume and fluctuations in the ionization efficiency of the mass spectrometer. Quantitative analysis was performed on the basis of the internal standard calibration curve − known mass of a compound of interest vs.
60
Laboratory studies
the ratio of the peak area of the compound of interest and internal standard. Linearity of the calibration curves in all cases was satisfactory, r2 ≥ 0.98.
Table 4.4. Retention times and target ions of analysed compounds. Component
Abbreviation
Retention time (min)
Target ions (m/z)
n-Heptadecane
C17
12.32
85
n-Undecanol
C11OH
10.29
83
Naphthalene
Nap
8.93
128
Metoxyacetophenol
MOAP
9.84
135
n-Tetracosane-d50
D50
16.69
66
4.5. Statistical methods Correlation factor:
N
∑ (x r=
i =1
N
∑ (x i =1
i
i
− x)( yi − y )
− x)
Equation 4.3.
N 2
∑(y i =1
i
− y)
2
Standard deviation:
s=
x
random variable
y
dependent variable
_
x _
1 N ( xi − x ) 2 ∑ N − 1 i =1
Equation 4.4
arithmetic mean of all xi
y
arithmetic mean of all yi
N
number of all xi
i
index
61
Laboratory studies
4.6. Quality assurance 4.6.1. SMPS measurements SMPS measurements on reproducibility were tested by means of continuous stream of soot particles obtained from Palas generator, with 3 Hz frequency. Standard deviation from 5 consecutive measurements was below 1%. During every day sampling the SMPS blank/noise level was determined by means of the inline filter placed before the instrument inlet. Number concentrations were always below 5 particles per cm3 as determined by the CPC 3020. During tests using octacosane (C28) and candle light particles stability of the obtained aerosol parameters was verified. Number concentration was considered to be constant if the variation were below 5% during at least 30 min. During every series of SMPS measurements (i.e. with and without the steam in the SJAC sampling set) steam−, dryer−, SJAC set noise level was determined and obtained noise number concentration was subtracted from the number concentration measured during the test. During every series of SMPS measurements number concentration decreased after applying steam to some constant value within specific period of time. In case of measurement with and without the dryer it was 2 and 4 sampling times (4 and 8 min respectively). The number concentration was considered to be stable if the variation was below 5% of the total number concentration. The mean value was calculated from at least 5 measurements. The dilution unit working profile was ensured by checking the stability of the particle number concentration and visual examination of the headline filter (changing the colour from white to black caused by the deposition of soot particles) and was found to work properly for 30 to 90 hours of experiments depending on applied particle mass concentration. As soon as stability of the dilution unit was decreasing the headline filter was replaced.
4.6.2. GC-MS analysis Limits of detection (LOD) were calculated from a triple ratio of signal to noise (S/N) of the compounds of interest and limits of quantification (LOQ) were calculated as a triple value of LOD; results are summarized in the Table 4.5. Mass of the compound of interest
62
Laboratory studies
obtained from the blank samples (P, G1 and G2) were subtract from those obtained from the SJAC sampling setup.
Table 4.5. Limits of detection (LOD) and quantification (LOQ) for tested compounds and internal standard. Component
LOD (pg/µl)
LOQ (pg/µl)
n-Heptadecane
60
180
n-Undecanol
40
120
Naphthalene
100
300
Metoxyacetophenol
150
450
n-Tetracosane-d50
40
120
4.6.3. Gas phase generation In order to prevent any particle formation process, inline filters were applied in both N2 and air lines (elimination of the possible condensation nuclei) and particle concentration at the entrance of the generation setup (homogeneous nucleation) was measured by means of CPC always at the beginning of the test. Gas phase generation process was arranged by the calculation of the theoretical mass of the gas phase of the compounds of interest according to equation of state (4.5). Temperature of the thermostat and the nitrogen flow rate through the impinger was selected to obtain the desired concentration of the compound of interest in the gaseous phase with the concentration below the saturation; that prevented homogeneous formation of particles.
Equation 4.5
pV = nRT
p
Pressure [Pa]
V
Volume [m3]
T
Temperature [K]
R
Ideal gas law constant (8.314 l·kPa/K·mol)
n
Amount of moles [mol]
63
Laboratory studies
Breakthrough tests were made with two pairs of XAD4 tubes (in row) spiked with the mixture of C17, C11OH, Nap and MOAP. Sorbent beds were then blown with the cleaned nitrogen for 3 hours (ca. 1 hour longer than during the tests) with the flow rate of ca. 17 l/min. Concentration of the tested compounds in the backup-XAD4 cups were negligible. After the series of tests with 2 to 4 of the compounds the whole system was rinsed with acetone and hexane, than washed in the washing machine and dried overnight in the oven. Blank samples were obtained from the runs without the test compound and were found to be below the LOQ for all test compounds except naphthalene in case of G2 sample (XAD4). Internal loss tests were performed in order to check the possible adsorption onto instrument walls of the applied gaseous test compounds and the reference line ratio (Ref) were calculated according to the following equation.
Ref = (mP + mG1 + mG2 / mRef ) * 100%
Equation 4.6
mP
mass of the test compound in the P sample of the SJAC
mG1
mass of the test compound in the G1 sample of the SJAC
mG2
mass of the test compound in the G2 sample of the SJAC
mRef
mass of the test compound in the reference line sample (XAD4 alone, Figure 4.6)
Memory effect caused by the possible adsorption of the tested compound onto the sampler walls was always controlled during these studies. It was carried out by the analysis of the previously purged compound (without washing the system) and it was found to be always below 0.1% of the mass determined during the proper (previous) test.
64
5. OUTDOOR COMPARISON SAMPLING 5.1. Instruments and materials Instruments -
Sequential speciation sampler, Partisol Model 2300, Rupprecht & Patashnick, NY, USA
-
HPLC System, HP Series 1100, Agillent Technologies, Böblingen, Germany
-
Programmable Fluorescence Detector HP 1046 A, Agillent Technologies, Böblingen, Germany
-
Universal Oven, Memmert, Schwabach, Germany
-
Analytical balance, Sartorius Model RC 210P, Göttingen, Germany
-
Water double distillation station, Westdeutsche Quarzschmelze Geesthacht, Germany
Materials Standards: -
Polycyclic aromatic hydrocarbons (PAH, 500 ng/µl) stock solution (Naphthalene, Acenapthene, Fluorene, Phenanthrene, Anthracene, Fluoranthene, Pyrene, Benz[a]anthracene, Chrysene, Benzo[b]fluoranthene, Benzo[k]fluoranthrene, Benzo[a]pyrene, Dibenz[a,h]anthracene, Benz[g,h,i]perylene, Indeno[1,2,3cd]perylene, Dr. Ehrensdorfer, Augsburg, Germany
Solvents: -
Acetonitrile (ACN) HPLC grade, Sigma Aldrich, , Germany
-
Double distillate water
Other materials: -
Empore High Performance Extraction Disc, C18 Octadecyl 47 mm, 3M Center, St. Paul, USA
-
Filtration setup, Sartorius, Göttingen, Germany
-
XAD2 and XAD4 resin − Sigma-Aldrich, Munich, Germany
-
47 mm quartz fibre filter, QM-A, Whatman International Ltd., Maidstone, England
-
37 mm quartz fibre filter, QM-A, Whatman International Ltd., Maidstone, England
-
Ceramic denuders, 40 mm OD, 36 mm length, contained about 740 squared channels (1.2 x 1.2 mm2), Rupprecht & Pataschnik, USA
65
Outdoor comparison sampling
-
Charcoal denuders, 40 mm OD, 36 mm length, contained about 740 squared channels (1.2 x 1.2 mm2), Rupprecht & Pataschnik, USA
-
KNO2, Merck, Darmstadt, Germany
-
Soxhlet extracting apparatus − VWR, Germany
-
Dimethylformamid (DMF), Rathburn Chemicals Ltd. Walkerburn, Schottland
-
1.5 ml autosampler vials, Wicom, Happenheim, Germany
-
300 µl inserts, Wicom, Happenheim, Germany
-
Universal aluminium foil 30
-
Desiccators, Schott, Germany
5.2. Ambient aerosol sampling: site and conditions Sampling campaign took place on the GSF campus in Neuherberg, Germany (Figure 5.1). The sampling site is close to a quite busy road but is directly influenced by wind speed and direction.
Figure 5.1. Location of the sampling site in the GSF campus [http://earth.google.com/].
66
Outdoor comparison sampling
Samples were collected from 19th October to 15th November 2005. During this time 13 sampling events took place and in general four parallel samples from modified SJAC and three diverse filter based methods were collected. Because of technical reasons SJAC sampler was not operated twice. Sampling duration was twelve hours ± 15 min. (from 9:00 a.m. to 9:00 p.m.).
Weather conditions During comparison experiments the ambient temperature (T) and relative humidity (RH) were recorded at the sampling site by means of Partisol sampler. Data on inorganic gases (NO2, and O3) and PM10 as were achieved from the nearby stations of the Bavarian air quality monitoring system operated by the Bavarian Environmental Protection Agency (LfU). Both of these stations are within the city Munich. The station at the Lothstrasse is located close to roads with heavy traffic and the station at the Johanneskirchen Strasse represents city background. The stations have distances of about 9 km (Loth.) and 7 km (Johanneskirchen.) to the sampling site.
5.3. Methodology 5.3.1. Modified SJAC sampling system Sampling of the ambient air was carried out without a size selective inlet. Working conditions of the modified SJAC sampling system were as follows: -
Flow rate of the main pump (1)
16.7 l/min.
-
Temperature of the chiller/cooler
1°C
-
Power of boiling pot
1.05 A, 200 V
-
Flow rate of the cyclone pump (2)
ca 200 ml/min
5.3.2. Filter based samplers Sampling of the ambient air was carried out at flow rate of 20 l/min without a size selective inlet for all three filter based samplers. This includes filter/adsorber (FA), ozone denuder/filter/adsorber (OdFA) and charcoal denuder/filter/adsorber (CdFA) sampler.
67
Outdoor comparison sampling
Each sampling train of denuder/filter/adsorber samplers (OdFA and CdFA) consists of an inlet, diffusion denuder, a home-built stainless steel filter holder and a home-built adsorber cartridge. Samples were collected by means of 47 mm, quartz fibre filter (QFF) followed by an adsorption unit packed with 8 g XAD2 (Figure 5.2, Liu et al. 2006).
Ozone or charcoal denuder
Figure 5.2. Denuded sampling trains and ozone/charcoal denuder [Liu et al. 2006].
Filter/adsorber sampling train consists of Teflon filter holder, stainless steel adsorber cartridge (ASE extraction cell) and home-built inlet and adapters (Figure 5.3). Samples were collected by means of 37 mm QFF followed by an adsorption unit packed with 8 g XAD4.
68
Outdoor comparison sampling
Filter holder housing
Adsorber cartridge adapter
XAD4 inside an ASE extraction cell
Inlet
Filter holder
Figure 5.3. Filter/adsorber sampling train.
Figure 5.4. Partisol sequential speciation sampler.
All three filter based sampling trains (FA, OdFA, CdFA) were connected to a Partisol sequential speciation sampler. The sampler has a sampling platform for particulate matter and gaseous species and allows operating up to four sampling trains simultaneously (Figure 5.4). During this campaign tree channels were used.
69
Outdoor comparison sampling
5.4. Sample preparation 5.4.1. Modified SJAC sampling system Because the analytical methods for the polycyclic aromatic hydrocarbons (PAH) determination are well described in the literature and their toxicity is undoubted they were chosen as target components for the comparison of the sampling methods. Since the chosen analytical method for PAH differs from the alkanes-method (HPLC instead of GC) different sample preparation steps were necessary.
Solid phase extraction (SPE) was used for PAH isolation from aqueous samples (P and G1) of the modified SJAC. Octadecyl (C18) Extraction Disks (ED) were conditioned according to the modify 3M procedure [3M Empore Application Procedure]. It covered washing the disk with 10 ml of hexane and drying by applied vacuum. Then 10 ml methanol was added and 1 ml was pulled through the disk so it soaked for ca. 1 minute. Then 10 ml water/acetone (90/10 v/v) was added and 1 ml was pulled through the disk so it soaked for ca. 1 minute. After this preparation step, the aqueous sample was applied. In order to increase the extraction efficiency loaded ED were extracted by means of ASE in 11 ml stainless steal extraction cells (method 1, Table 4.1). Extracts were dried with Sodium Sulphate and filtered with paper filter directly into the Büchi glass vessel where solvent was reduced to ca 1 ml by means of Büchi evaporator. To avoid losses of more volatile components during solvent change, 25 µl of dimethylformamid (DMF) were added. This solution was further reduced by means of a gentle stream of nitrogen to 25 µl in 300 µl insert of the autosampler vials and finally 200 µl of ACN were added. XAD4 cartridges (samples – G2) were handled (extraction, drying, filtration, solvent reduction) as described in previous section (4.4.2). Additional solvent changing for ACN with the help of DMF took place like in the case of aqueous samples described above. In case of all three SJAC samples PAH extraction efficiency tests were performed and the recovery was taken into consideration during later calculations of the masses of the compounds of interest (Eq. 4.2).
70
Outdoor comparison sampling
5.4.2. Filter based samplers All QFF were extracted by ASE method 1 based on the previous studies with extraction of PM by ASE [Lintelmann 2003] and than extracts were handled as for extraction disks to obtain ACN sample for HPLC analysis. XAD4 from FA sampler was handled as the SJAC adsorber cartridge. XAD2 from OdFA and CdFA samplers were extracted directly in home made glass cartridges (with the frit at the bottom and glass-wool at the top of the adsorbent − Figure 5.3). Extraction was carried out by means of Soxhlet apparatus with dichloromethane (DCM, 120 ml) for 16 h (6 cycles/h). Extracts were handled (drying, filtration, solvent reduction) as described in section 4.5.2. Again, additional solvent (of ACN with the help of DMF) changing took place. In case of QFF and XAD samples extraction efficiency tests were performed and the recovery was taken into consideration during later calculations of the masses of the compounds of interest (Eq. 4.1 and 4.2). Ozone denuders were prepared according to the previous studies by Liu et al. [2005a]. First KNO2 denuder was cleaned up with MiliQ water, than 5 times immersed for 2 min in an aqueous KNO2 solution (50% saturated). Remaining water was taken away by means of paper tissue and then by heating in the oven at 300°C for 1 hour. Finally the denuder was conditioned in a desiccator partially filled with water for 12 hours. The charcoal denuder was cleaned after each sampling by Soxhlet extraction with 120 ml of DCM for 16 h. Because of the difficulties with the recovery caused by the high sorption of the SVOC to charcoal no sample was taken for further analysis from the charcoal denuder extract.
5.5. Chemical analysis Table 5.1. HPLC operating conditions Column
MZ-PAH C18 5 µm, 250 mm x 3 mm
Mobile phase
gradient of acetonitrile and water – (Table 5.2)
Detector
fluorescent detector
Injection volume
10 µl
Temperature of the column 34.8°C Flow rate
0.5 ml/min
71
Outdoor comparison sampling
Extracts in ACN containing the analytes were determined by means of the most sensitive tool for PAH analysis – reverse phase HPLC-FLD setup. Characteristics of the analytical instrument and working conditions are described in the Table 5.1 and gradient conditions are given in the Table 5.2.
Table 5.2. Gradient conditions for the PAH separation Time (min)
0.0
35.0
45.0
47.0
65.0
% ACN
58
100
100
58
58
% water
42
0
0
42
42
Table 5.3. Retention times, fluorescent detector excitation/emission time-program quantification for selected PAH Retention time
λex
λem
(min)
(nm)
(nm)
Naphthalene
7.9
275
350
Acenapthene
10.8
280
330
Fluorene
11.2
280
330
Phenanthrene
12.5
246
370
Anthracene
14.4
246
370
Fluoranthene
15.9
270
390
Pyrene
17.2
270
390
Benz[a]anthracene
22.3
260
420
Chrysene
23.8
260
420
Benzo[b]fluoranthene
27.9
284
430
Benzo[k]fluoranthrene
30.7
290
430
Benzo[a]pyrene
32.5
290
430
Dibenz[a,h]anthracene
36.1
290
410
Benz[g,h,i]perylene
36.8
290
410
Indeno[1,2,3-cd]perylene
38.2
250
500
PAH
Standard solution, within the concentration range from 0.79 ng/µl to 20.77 ng/µl, was made from the PAH stock solution by dilution with ACN.
72
Outdoor comparison sampling
Qualitative analysis was performed on the basis of characteristic retention times of selected PAH obtained from the time-programmed FLD (Table 5.3) Quantitative analysis of PAH was carried out by calibration curves based on peak areas of the components. Linearity of the calibration curves in all cases was satisfactory, r2 ≥ 0.99.
5.6. Quality control and statistic All glass ware was washed first with acetone and second in a washing machine each time after use, then rinsed with double distillate water and acetone and finally stored in 220°C in a dryer at a minimum of 12 hours till it was used. Prior to use, all QFF were baked at 450°C for 12 h in a muffle oven. Ozone denuder efficiency was studied before by Liu et al. [2005a] and it was found to remove ozone with over 95% efficiency for at least one week. To make sure the effective working conditions of the ozone denuder after triple 12 hours sampling period it was renewed according to previously described procedure. Charcoal denuder after cleaning was wrapped in an aluminium foil and stored in a desiccator before use. The desiccator was partially filled with charcoal adsorber to retain organic compounds preventing contamination of adsorbers used in the field campaign. The particle transmission (20-3000 nm) was tested by APS and SMPS and no significant particle losses within the denuders were observed [Liu et al. 2006]. XAD4 from FA sampler was handled as in case of SJAC adsorber cartridge (see 4.4.2). XAD2 from OdFA and CdFA samplers after extraction were stored in a desiccator before use. Breakthrough test were made with two pairs of XAD4 cups (placed one under another) spiked with the PAH mixture (ca. 270 ng of each PAH). Sorbent beds were then blown with the cleaned nitrogen for 12 hours with the flow rate of ca. 17 l/min. Concentration of the PAH in the backup-XAD4 cups were found to be negligible. Adsorption properties of XAD4 and XAD2 do not differ radically in terms of PAH sampling and relatively high specific retention volumes both for XAD4 and XAD2 were obtained during other study [Lee et al. 2004]. Therefore it was assumed that also for XAD2 adsorbers from filter based samplers breakthrough effect should be negligible, especially in the cold autumn time when this field campaign was carried out.
73
Outdoor comparison sampling
Mass of the PAH obtained from the blank samples (QFF, XAD and SJAC samples) were subtracted from those obtained from the field measurements.
Limits of detections for PAH were calculated as in case of GC-MS analysis (see Section 4.5.3) and the results are listed in the Table 5.4. HPLC reproducibility - differences in concentrations obtained from 4 injections of the same sample of PAH standard mixture were lower than 2%.
Table 5.4. Limits of detections and quantification for selected PAH. PAH
LOD (pg/µl)
LOQ (pg/µl)
Naphthalene
0.67
1.33
Acenapthene
0.57
1.15
Fluorene
0.58
1.19
Phenanthrene
0.08
0.15
Anthracene
0.06
0.11
Fluoranthene
0.60
1.10
Pyrene
0.21
0.53
Benz[a]anthracene
0.13
0.24
Chrysene
0.29
0.62
Benzo[b]fluoranthene
0.21
0.41
Benzo[k]fluoranthrene
0.03
0.06
Benzo[a]pyrene
0.07
0.16
Dibenz[a,h]anthracene
0.08
0.17
Benz[g,h,i]perylene
0.13
0.25
Indeno[1,2,3-cd]perylene
0.54
1.10
Oxidation test was performed in order to verify the degradation of PAH in the aqueous samples obtained from SJAC during sampling and later overnight storing before chemical analysis. SJAC was run as in case of normal sampling event (12 hours, 1 m3/h). After that aqueous sample P was divided into two parts − 33% and 67% vol. A known amount of the PAH standard solution was added to the second fraction and both were stored in the cooling room overnight as in case of SJAC samples from field campaign. Both parts were than
74
Outdoor comparison sampling
handled and analysed for PAH as described before (5.4.1). Recovery (Rec) of PAH from the second fraction (67%) was calculated according to the
Re c =
Equation 5.1.
m´´− m´ ⋅ 100% m0
Equation 5.1.
m´
mass of the given PAH in the first fraction
m´´
mass of the given PAH in the second fraction
m0
mass of the given PAH added to the second fraction
75
6. RESULTS FROM THE LABORATORY STUDIES As stated in section 3.1. collection efficiency for water soluble particles was found to be over 99% [Slanina et al. 2001] but since hygroscopic growth of organic particles is weaker as for inorganic compounds [Weingartner et al. 1996] there was concern that the particle collection efficiency especially for small, nonpolar particles may be low. The optimum has to be chosen in terms of the particle collection efficiency and a sufficient amount of the sample for the chemical analysis. These factors predetermine the high steam− and air flow rate. On the other hand high air flow rate increases pressure drop and the undesirable transfer of the gas-phase to the particle fraction due to high steam flow rate might occur. Therefore numerous tests with nonpolar particles as well with the gas phases were performed in order to obtain the best separation profile and optimize SJAC operation conditions.
6.1. Optimisation of the working condition Flow rate of the main pump 1 (air sampling rate) was chosen to be 16.7 l/min it proved to provide the maximum undisturbed constant air flow with different steam injection rates during studies. Flow rates above 17 l/min caused problems related to the swelling effect of the XAD4 (increasing the pressure drop) resulting in automatic switching off the pump. Measurements of the pressure drop inside the system confirmed that the resistance is caused mainly by the adsorbent. Pressure drop measured at the 16.7 l/min flow rate before inlet, after cooler and after adsorbent were found to be ~ 20, 80 and 180 mbar, respectively. Temperature of the cooler was set to 1°C in order to ensure the highest steam separation before adsorbent and on the other hand to avoid formation of ice inside the system. Flow rate of pump 2 (Figure 3.2) which removes the aqueous PM solution from the cyclone was set to ~ 200 ml/min. It ensures the constant flow of the slurry from the cyclone which prevents formation of the water film inside the cyclone and on the other hand is low enough to avoid the distortion of the working profile of the cyclone which might disturb its separation efficiency.
76
Results from the laboratory studies
6.2. Particle collection efficiency of the SJAC As shown in the Figure 6.1 there was no significant difference between size distributions of the applied soot particles measured before the inlet of the SJAC and after instrument. It illustrates the usefulness of the SJAC for PM measurements and the fact that no correction factor needs to be taken into account during the calculation of the mass concentration. Only slightly shift of few nm of the particle mean size distribution (from 62 to 67 nm) with the number concentration is seen (from 280000 to 268000 particles/cm3) probably due to the coagulation of soot PM inside the sampler. No significant change within the mass concentration was observed.
800000 ∆∆∆∆
measured after SJAC without the **** steam injection
600000
dN/dlogDp
size distributions primary, measured before SJAC inlet
400000
200000
0 0
50
100
nm
150
200
250
Figure 6.1. SJAC internal losses test with soot particles, mean diameter 70 nm.
77
Results from the laboratory studies
6.2.1. Effect of the steam injection type In order to effectively grow the aerosol particles such that they are collected in the cyclone of the modified SJAC independent optimisation of both of the steamers was carried out. It was realized by SMPS measurements in sampling location “n” (Figure 4.3). In case of the original boiling pot the variable power of the heating coil (Figure 3.4) was applied resulting in different steam injection flow rates. Experiments with the electrical resistance heated steel capillary as a SJAC steamer were carried out with variable current applied to the capillary and with changeable water flow rates of the pumped through the steel capillary (Figure 3.5).
250000
---200000
∆∆∆∆ □□□□
dN/dlogDp
○○○○
size distributions primary, without steam after SJAC − 150 V - 1.4 ml/min after SJAC − 170 V - 2.0 ml/min after SJAC − 200 V - 2.7 ml/min
150000
100000
50000
0 0
100
nm
200
300
Figure 6.2. Soot particle separation efficiency with different power of the boiling pot of SJAC; mean diameter 70 nm, SMPS sampling location “n”.
Results showed (Figure 6.2) that the original boiling pot power set for 1.05 A, 200V ensures over 99% (particles number) collection efficiency. As predicted bigger PM are more effective collected by SJAC than smaller ones. It can be observed as a residual peak especially with the lower steam injection rates (150 and 170 V).
78
Results from the laboratory studies
40000
a) ----
****
after SJAC − 1.5 ml/min after SJAC − 2.5 ml/min
○○○○
after SJAC − 2.0 ml/min
∆∆∆∆
30000
size distributions primary, without steam
dN/dlogDp
20000
10000
0 0
200
nm
400
600
180000
b) 135000
dN/dlogDp
90000
45000
0 0
100
nm
200
300
Figure 6.3. Soot particle separation efficiency with different water flow rates at maximum power of the electrical resistance heated steal capillary; mean diameter 190 nm (a), 90 nm (b), SMPS sampling location “n”.
As shown in the Figure 6.3a the electrical resistance heated steel capillary used as a steamer at maximum technically obtainable current (2.5 A) guarantees only 66% (particles number) separation efficiency for the water flow rate of 2 ml/min. A change of the water flow rate did not improve the separation efficiency. When higher amount of smaller particles were examined (Figure 6.3b) efficiency with the optimum steam injection conditions decreased to 55%.
79
Results from the laboratory studies
6.2.2. Effect of the particle type 200000
4500000
a)
b) 150000
dN/dlog Dp
dN/dlogDp
3000000
1500000
100000
50000
0
0 0
100
200
nm
300
0
50
nm 100
150
200
Figure 6.4. Octacosane particle separation efficiency with optimal power of the boiling pot; - - - primary size distributions, without steam, ○○○ size distributions after SJAC; mean diameter 70 nm (a), 110 nm (b), SMPS sampling location “n”.
8000
dN/dlogDp
6000
4000
2000
0 0
200
nm 400
600
Figure 6.5. Candle light- with indoor air particles separation efficiency with optimal power of the boiling pot; - - - primary size distributions, without steam, ○○○ size distributions after SJAC; mean diameter ~ 150 nm, SMPS sampling location “n”.
80
Results from the laboratory studies
As shown above also for strongly nonpolar material like octacosane- (Figure 6.4a) as well as for candle light particles (Figure 6.5) SJAC collection efficiency was found to be over 99%. Only in case of extremely high C28 particle concentration, in reality not occurring in the ambient air, SJAC demonstrated its lower trapping efficiency for smaller PM (Figure 6.4b).
6.2.3. Effect of the location of the sampling line SMPS measurements in location “n” (see Section 4.1) are subject to overestimation of SJAC efficiency because of additional supersaturation and homogeneous nucleation caused by the decreased temperature in the cooler. Therefore additional studies were performed with the SMPS sampling line moved downstream the cyclone. In this case water vapour concentration was much higher than in position “n” hence heater and dryer were used (location “m” – Figure 4.3).
400000
dN/dlogDp
300000
----
size distributions primary, without steam
○○○○
after SJAC, 200 V (2.7ml/min)
****
after SJAC, 210 V (3.1 ml/min)
∆∆∆∆
after SJAC, 220 V (3.6 ml/min)
200000
100000
0 0
50
nm
100
150
Figure 6.6. Soot particle separation efficiency with different power of the boiling pot; mean diameter 35 nm, SMPS sampling location “m”.
As shown in the Figure 6.6 SJAC separation efficiency measured in SMPS sampling location “m” is still satisfactory ~ 95% (particle number) even for the worst case, i.e. a quite high concentration of the particle fraction with very small mean diameters. For further experiments the optimum power of the boiling pot was set to 200V, 1.05 A.
81
Results from the laboratory studies
120000
100000
a)
b) 75000
dN/dlogDp
dN/dlogDp
80000
40000
50000
25000
0
0
0
50
100
nm
150
200
250
0
200
nm
400
600
Figure 6.7. Effect of the soot particle size and concentration on the SJAC separation efficiency with optimal boiling pot power; - - - primary size distributions, without steam, ○○○
size distributions after SJAC, mean diameter a) 70 nm, b) 250 nm, SMPS sampling
location “m”.
A little shift in the particle size mean diameter from 35 nm (Figure 6.6) to 70 nm (Figure 6.7a) increased the overall collection efficiency to over 98%. In case of bigger particles with quite broad size spectrum the separation efficiency was even better (Figure 6.7b). SJAC efficiency also slightly increased (~ 97%) when lower concentration of relatively small PM was applied (Figure 6.8a with comparison to the Figure 6.6). Powering the boiling pot by 200V, 1.05 A corresponds to ca. 2.7 ml/min steam flow and is slightly higher then the optimum steam flow rate used for inorganic compounds measurements (2.5 ml/min; Slanina et al. 2001). Further increase of the steamer power did not considerably enhance the separation efficiency but the distinct increase of the steam flow rate took place. This might result in undesirable dissolving of polar, water soluble compounds from the gas phase in water droplets which will be removed by the cyclone and overestimate the particle sample P. Therefore, for the subsequent studies the above mentioned settings were chosen as the optimum.
82
Results from the laboratory studies
200000
200000
a)
d) 150000
100000
100000 dN/dlogDp
dN/dlogDp
150000
50000
50000
0
0 0
50
nm
100
150
0
200
nm
400
12000
12
600
e)
dM/dlogDp (µg/m³)
dM/dlogDp (µg/m³)
b)
8000
8
4000
4
0
0 0
50
nm
100
0
150
1,2E+09
200
nm
400
600
1,0E+11
f)
c)
dS/dlogDp (nm²/cm³)
dS/dlogDp (nm²/cm³)
7,5E+10 8,0E+08
4,0E+08
5,0E+10
2,5E+10
0,0E+00
0,0E+00 0
50
nm
100
150
0
200 nm 400
600
Figure 6.8. SJAC separation efficiency with respect to soot particle size, mass and surface area; optimal power of the boiling pot; number size distribution a)−c) 35 nm, d)−f) 300 nm, SMPS sampling location “m”; - - - primary size distributions, without steam, ○○○
size distributions after SJAC.
83
Results from the laboratory studies
When particle mass and surface area (calculated by SMPS software) is taken under consideration as a determinant of the instrument efficiency the overall instrument efficiency exceeded 98% already for the particle fraction with the smallest mean diameter (35 nm, Figure 6.8a-c) and it was close to 100% for bigger particles with a high number concentration (Figure 6.8d-f). Keeping in mind that even freshly generated particles coming from the traffic sources which are mostly responsible for the occurrence of the particulate fraction of the persistent organic pollutants (POP, e.g. PAH) are in the range of 50-150 nm in size SJAC efficiency seems to be sufficient for further outdoor studies as for a organic compounds sampler. Because of the large active surface of the dryer, used in the experiments with the carbon particles (SMPS sampling location “m”), octacosane and candle light particles adsorption to drying material took place. Therefore no experiments with the last two kinds of particles were carried out. Yet negligible differences in SJAC collection efficiency of soot particles obtained from sampling location “m” and “n” proved validity of SMPS measurements of octacosane particles in position “n”.
6.3. Gas phase experiments 6.3.1. Generation Comparison of the concentrations of n-heptadecane (C17), n-undecanol (C11OH), naphthalene (Nap) and 4 - metoxyacetophenol (MOAP) calculated from the equation of state (Eq. 4.5) with those obtained from the chemical analysis of the gas phase samples showed that the efficiency of the generation setup varied in the range from 10 to 60% depending on the nitrogen flow rate through the impinger. The crucial thing was to obtain a stable flow rate of the gas phase which enters the SJAC. Its concentration is below the saturation which prevents homogeneous formation of particles. Therefore for the purpose of these experiments the obtained efficiency and accuracy of the generation setup was found to be sufficient.
84
Results from the laboratory studies
6.3.2. Recovery of the analytical procedure Extraction efficiency tests for aqueous samples of the SJAC were performed for the water samples (P, G1) and XAD4 cartridges (G2) spiked with known amount of the acetone mixture of analyzed compounds and were carried out exactly like in case of the real sample. Recoveries (according to Eq. 4.1) for all four compounds were found to be higher for XAD4 samples employing ASE then for water samples employing liquid-liquid extraction (LLE). Optimisation of the extraction conditions for water samples was carried out in terms of the repetition number of the extractions (LLE) with 20 ml of dichloromethane (DCM). Also the effect of the sonification was checked. Triple sonification (3xS) without shaking as well as shaking alone (3xSH) had led to low recoveries. Combination of both methods (S/SH) yielded to the best recoveries and increasing or decreasing of the repetition number did not improve the recoveries. In all cases recoveries for heptadecane and naphthalene were lower than for undecanol and metoxyacetophenol (Figure 6.9). It can be explained by the adsorption effect (heptadecane) onto the glass walls and high vapour pressure of the naphthalene which influences also the evaporation step.
100 C17
Recovery [%]
80
C11OH NAP
60
MOAP
40 20 0 3xS
3xSH
2xS/SH
3xS/SH
4xS/SH
3xS/SH*
Figure 6.9. Recoveries of analyzed compounds from spiked 120 ml water samples (3xS/SH* = 360 ml) with different extraction conditions, S – sonification, SH – shaking, mean values, standard deviations ≤ 12%, n=3.
Because the water amount from the SJAC samples P and G1 differ by factor ranging from 2 to 3 the optimum extraction method for 50 ml water (hypothetical SJAC sample P) was applied also to 360 ml sample (hypothetical SJAC sample G1). Results showed that
85
Results from the laboratory studies
recoveries from sample with larger amount of water (3xS/SH*) were only slightly lower with comparison to samples with 120 ml what is in agreement with the results from Desideri et al. [1992]. Recoveries for all four compounds were taken into consideration during calculation of the final masses.
Optimisation of the ASE conditions for XAD4 extraction was carried out in terms of the temperature and cycles number. As shown in the Figure 6.10 conditions for ASE with the extraction temperature of 75°C (recommended for PAH in Dionex Application Note 347) yielded lower recovery level than in case of 100°C (used for the extraction of PAH from PM on QFF, Lintelmann et al. 2003). Average recoveries were found to be 84 and 68% for 100 and 75°C respectively. The recovery for heptadecane and undecanol were slightly better than for naphthalene and metoxyacetophenol (100°C). That is understandable because of the higher volatility of the latter. In case of the influence of the cycle number 3 cycles were found to be the best selection – negligible amount of the test compound in the extract from the 4th extraction cycle for both temperatures.
100 100 °C
75 °C
Recovery [%]
80 C17
60
C11OH 40
NAP MOAP
20 0 3 cycles
4th cycle
3 cycles
4th cycle
Figure 6.10. Recoveries of analyzed compounds from spiked XAD4 samples under different ASE conditions, mean values, standard deviations ≤ 8%, n=3.
Masses of compounds of interest obtained from the blank samples (P, G1 and G2) were found to be below the LOQ except naphthalene (XAD4 samples) which was than subtracted from those obtained from the SJAC sampling setup.
86
Results from the laboratory studies
6.3.3. Transfer of gas phase to the particle fraction of the SJAC Wide ranges of water solubility and polarity of four individual test compounds (Table 6.1) were applied for gas phase bias measurements in order to cover a broad range of compounds in the ambient aerosol and to check those two properties impacting on behaviour of gas phase in SJAC sampler. In order to verify if the possible bias pattern of the SJAC is independent from the gas phase concentration of the applied compound wide range of concentration was applied (Table 6.1). Different concentrations were obtained by adjusting of the nitrogen flow rate though the impinger vial containing the test compound. Since comparably high concentrations of the gaseous compounds were applied, internal losses due to possible adsorption onto instrument walls might have occurred. The internal losses were calculated according to the Equation 4.6 and were found to be negligible (differences within 8%, n=2) for all test compounds (Table 6.1).
Table 6.1. Properties of test compounds and concentration ranges applied in the experiments [SRC PhysProp Database]. Component Water solubility, [mg/l] Vapor pressure at 25oC, [mm Hg] log P (octanol-water)
heptadecane
undecanol
naphthalene
metoxyacetophenol
0.00029
19.1
31
2030
0.00023
0.003
0.085
0.08
8.7
4.3
3.3
1.8 O
Chemical formula
CH3(CH2)15CH3 CH3(CH2)10OH O
Concentration range, [µg/m3] Reference line ratio [%]
20 – 400
20 – 400
10 – 400
20 – 300
101
94
105
92
“The worst case scenario” assumes that polar, water soluble compounds will partly dissolve in the droplets and be removed by the cyclone and cause overestimation of particle
87
Results from the laboratory studies
sample P. Therefore level of the bias was expected to be higher for undecanol, naphthalene and metoxyacetophenol than for the water insoluble heptadecane which is supposed to have the smallest gas to particle fraction transfer and, hence, the smallest percentage concentrations of the particle fraction P during gas phase experiments.
Table 6.2. Average fractionation of gaseous test compounds between three samples of the modified SJAC during gas phase measurements; data are given in percent with standard deviations, n=5-8. gas phase sample G1
gas phase sample G2
particle phase sample
(cooler)
(XAD4)
P (cyclone)
heptadecane
0.0 ± 0.0
100.0 ± 0.0
0.0 ± 0.0
undecanol
9.5 ± 3.1
88.7 ± 1.7
0.0 ± 0.0
naphthalene
1.2 ± 0.2
98.6 ± 0.4
0.0 ± 0.0
metoxyacetophenol
73.5 ± 1.3
24.0 ± 1.1
2.4 ± 0.7
sample:
Percentage concentrations of each given fraction were calculated dividing the concentration of the fraction by the concentration of the sum of all fractions and multiply by 100%.
The bias caused by transfer from gas to particle fraction was not observed for heptadecane, undecanol and naphthalene – average percentage concentrations in the particle samples P during gas phase experiments were found to be 0% (Table 2). Only in case of metoxyacetophenol, which has the highest water solubility, results showed bias caused by transfer from gas to particle fraction due to dissolving of the relatively high (to e.g. PAH) water soluble metoxyacetophenol vapours in the condensed water which leaves the cyclone. Mean percentage share of the sample P for this compound was 2.4%. Hence it confirms that for much less water soluble compounds than metoxyacetophenol (e.g. alkanes and PAHs) correction for SJAC measurements is not necessary. Distribution between gas phase samples G1 and G2 illustrates differences not only in water solubility but also volatility of examined compounds. G1 fraction of naphthalene is lower than for undecanol but water solubility of naphthalene is higher then that of undecanol. This distribution pattern might be useful as a kind of “online pre-separation” of measured compounds according to water solubility and volatility of SVOC in complex matrices of organic aerosols.
88
Results from the laboratory studies
The distribution pattern shown in the Table 6.2 has proved to be concentration independent for the used range of concentrations (Table 6.1) of test compounds.
Evaluation of the modified SJAC yielded negligible bias caused by transfer from gas to particle phase and high collection efficiency of ultrafine hydrophobic particles. Therefore the next examinations aim for field comparison of the modified SJAC with standard off-line (filter based) sampling methods.
89
7. RESULTS
FROM
THE
COMPARATIVE
OUTDOOR
SAMPLING In order to compare the modified SJAC with other currently available off-line sampling methods, and also to verify the sampler operation in the field, outdoor sampling campaign was carried out. Besides SJAC three types of low volume filter based sampling techniques were used (description below). PAH are well known semivolatile pollutants in the ambient air. Besides others, their properties differ in terms of vapour pressure and water solubility (Table 7.1). It affects their behaviour in the atmosphere as well as during the denuder/filter/adsorber and SJAC sampling.
Table 7.1. Physical properties and structures of selected PAH [Mackay et al. 1992, SRC PhysProp Database]. Compound & abbreviation Naphthalene, Nap Acenapthylene, Ace Fluorene, Flu Phenanthrene, Phe Anthracene, Ant Fluoranthene, Fla Pyrene, Pyr Benz[a]anthracene, Baa
Vapour
Water
Molecular
pressure at
solubility
weight
25°C [Pa]
[mg/l]
[g/mol]
1.1 x 101
3.1 x 101
128.18
C10H8
9.0 x 10⁻¹
3.9
152.20
C12H8
9 x 10⁻²
2.0
166.23
C13H10
2 x 10⁻²
9.9 x 10⁻¹
178.24
C14H10
1 x 10⁻³
4.3 x 10⁻²
178.24
C14H10
1.2 x 10⁻³
2.6 x 10⁻¹
202.26
C16H10
6.0 x 10⁻⁴
1.3 x 10⁻¹
202.26
C16H10
2.8 x 10⁻⁵
1.0 x 10⁻²
228.30
C18H12
90
Formula
Structure
Results from the comparative outdoor sampling
Table 1.1. Physical properties and structures of selected PAH [Mackay et al. 1992, SRC PhysProp Database] − continuation. Compound & abbreviation Chrysene, Cry Benzo[b]fluoranthene, Bbf Benzo[k]fluoranthene, Bkf Benzo[a]pyrene, Bap Dibenz[ah]anthracene, Dba Benz[ghi]perylene, Bgh Indeno[1,2,3-cd]perylene, Ind
Vapour
Water
Molecular
pressure at
solubility
weight
25°C [Pa]
[mg/l]
[g/mol]
5.7 x 10⁻⁷
2.0 x 10⁻³
228.30
C18H12
*6.7 x 10-5
1.5 x 10⁻³
252.32
C20H12
*5.2 x 10-8
5.5 x 10⁻⁴
252.32
C20H12
7.0 x 10⁻⁷
1.6 x 10⁻³
252.32
C20H12
3.7 x 10⁻⁸
5.0 x 10⁻⁴
278.35
C22H14
1.3 x 10⁻⁸
2.6 x 10⁻⁴
276.34
C22H12
*1.3 x 10-8
3.7 x 10⁻³
276.34
C22H12
Formula
Structure
* Vapour pressure at 20°C
7.1. Recovery of the analytical procedure Obtained recoveries for XAD resins spiked with the PAH mixture and extracted by means of Soxhlet and Accelerated Solvent Extraction (ASE) methods did not differ. Recoveries of all PAH were found to be better than 90% except for the volatile Naphthalene which had a little lower recovery (Figure 7.1).
91
Results from the comparative outdoor sampling
120
Recovery [%]
100 80 60 40 Soxhlet
20
ASE
0 Nap Ace
Flu
Phe
Ant
Fla
Pyr
Baa Cry
Bbf
Bkf
Bap Dba Bgh
Ind
Figure 7.1. Recoveries of PAH from XAD2 (Soxhlet) and XAD4 (ASE) samples spiked with the PAH mixture; standard deviations ≤ 9%, n=3.
Contrary to the laboratory experiments with gas phase only (see section 4), PAHs were expected in the particulate phase of the SJAC samples. For this reason, a different approach was applied for aqueous samples − solid phase extraction (SPE) instead of liquid-liquid ultrasonic extraction (LLE). Since particulate matter strongly adsorb PAH – urban dust (SRM 1649a) containing various well described PAHs was applied to both, onto the QFF and into the water samples, instead of PAH acetone mixture. Optimisation of the extraction conditions for aqueous samples (SPE) was performed in terms of acetone addition to the water which was reported to be a necessary modification of the extraction procedure by means of SPE [Kiss et al. 1997]. Generally it was found to prevent collapsing of the hydrophobic C18 chains (what might take place because of the aqueous environment) reduces adsorption of PAH onto the glass walls. The results show that the best recoveries were obtained with a 10% (v/v) addition of acetone (Figure 7.2). Only in case of more volatile PAH (Naphthalene-Phenanthrene) recoveries were slightly lower than in case of lower concentrations of acetone, probably due to breakthrough phenomena [Marcé and Borrull 2000] as well as evaporation losses [Swartz et al. 2000, Filipkowska et al. 2005]. Recoveries for samples with the urban dust (SRM 1649a) applied onto the QFF after ASE with the temperature of 100°C and 3 cycles were high (average 94%, Figure 7.2) therefore no further optimisation in terms of the ASE conditions was carried out.
92
Results from the comparative outdoor sampling
120 Recovery [%]
100 80 60 40 0%
20
5%
10%
15%
ASE
0 Nap Ace
Flu
Phe
Ant
Fla
Pyr
Baa
Cry
Bbf
Bkf
Bap Dba Bgh
Ind
Figure 7.2. Recoveries of PAH extraction from SRM 1649a in water samples (400 ml, SPE with different acetone addition) and on QFF (50 mg, ASE). Recoveries calculated relative to the certified values of the reference material; for Nap, Ace, Flu concentration calculated relative to the ASE results, standard deviations ≤ 12%, n=3.
Because the water amount from the SJAC samples P and G1 differ by factor ranging from 2 to 3 the optimum extraction method for 400 ml water (hypothetical SJAC sample P) was applied also to 1200 ml sample (hypothetical SJAC sample G1). Results show that SPE with 10% addition of acetone yielded better recoveries than sonification assisted LLE (sonification & shaking, S/SH) method for most of the PAH with exception of volatile ones just like in case of the hypothetical SJAC sample P (400 ml water sample).
100
Recovery [%]
80 60 40 20
3x30 S/SH
4x30 S/SH
SPE 0%
SPE 10%
0 Nap Ace
Flu
Phe Ant
Fla
Pyr
Baa Cry
Bbf
Bkf
Bap Dba Bgh
Ind
Figure 7.3. Recoveries of PAH extraction from water samples (1200 ml) spiked with the PAH mixture; S/SH sonification & shaking, standard deviations ≤ 12%, n=3. Breakthrough test with 15 and 23 m3 proved that the applied amount of the XAD resin was sufficient for the outdoor sampling campaign – concentration for none of the PAH in the
93
Results from the comparative outdoor sampling
second (backup) adsorber cartridge exceeded the limit of detection, except Naphthalene where the amount was ca 1% of the mass applied onto the first adsorber.
7.2. Weather conditions As shown in Table 7.2 two periods in terms of temperature can be distinguished. While the average temperatures during whole sampling campaign was 11.0 ± 4.4°C, for the warmer (>10°C, till 28 October) and colder period (15 µg/m³, average 19.0 ± 7.3 µg/m³) 25-28 October, 7 and 14 November; all other days had an average of 5.8 ± 6.8 µg/m³.
Table 7.2. Summary of the weather condition during outdoor sampling Date
PM10 [µg/m³]
Ozone [µg/m³]
NO2 [µg/m³]
T [°C]
p [hPa]
RH [%]
33
11
723
51
83
59
13
720
60
5
86
70
15
716
55
20
26
75
40
15
724
53
13
13
18
65
40
17
721
39
27
23
14
17
54
35
19
724
50
28.10.
49
31
4
6
71
36
13
724
57
31.10.
28
26
5
7
33
23
8
721
67
07.11.
23
25
19
22
51
35
10
728
57
08.11.
19
n.a.*
4
4
45
21
7
726
65
10.11.
48
42
6
6
63
46
9
724
61
14.11.
23
20
16
24
35
21
4
725
62
15.11.
31
37
7
7
66
46
6
715
59
Loth.
Johan.
Loth.
Johan.
Loth.
Johan.
19.10.
39
38
9
12
52
20.10.
53
45
4
4
21.10.
40
42
5
24.10.
24
18
25.10.
16
27.10.
* n.a. – not available
94
Results from the comparative outdoor sampling
During the outdoor sampling the samplers were exposed to temperature fluctuation. The differences between minimum and maximum temperatures ranged from 2 to 18°C and the average variation was 10°C during the sampling time of 12 hours. Other conditions like ambient pressure and RH (averages of 722 ± 4 hPa and 57 ± 7% respectively) as well as PM10 and NO2 (averages of 31 ± 11 µg/m³ and 49 ± 19 µg/m³) did not differ considerably while sampling time. Therefore further differentiation of the two periods of time for the discussion of the results was not reasonable.
7.3. Concentration of PAH Table 7.3. Average concentration [ng/m3] of the PAH in the gas- and particulate phase from all events, from the ozone denuder/filter/adsorber sampler. Compound
PM
Gp
Naphthalene
0.35
160.36
Acenapthylene
0.04
6.18
Fluorene
0.08
7.82
Phenanthrene
0.75
13.25
Anthracene
0.14
1.00
Fluoranthene
1.51
1.89
Pyrene
1.52
1.56
Benz[a]anthracene
0.48
0.01
Chrysene
0.71
0.11
Benzo[b]fluoranthene
0.81
0.02
Benzo[k]fluoranthene
1.06
0.01
Benzo[a]pyrene
0.60
0.01
Dibenz[a,h]anthracene
0.09
n.d.*
Benz[g,h,i]perylene
0.93
n.d.
Indeno[1,2,3-cd]perylene
0.53
n.d.
n.d. – not detected
The
major
contributors
denuder/filter/adsorber
(OdFA)
of
the
sampler
particulate were
phase
Fluoranthene
PAH and
in
the
Pyrene
ozone (average
concentration 1.5 ng/m3, Table 7.3) whereas in the gaseous phase Naphthalene and
95
Results from the comparative outdoor sampling
Phenanthrene were dominant (average concentration of 160 and 13 ng/m3 respectively). Generally PAH concentrations from the outdoor sampling were little lower or comparable with results from other studies in suburban area of Munich carried out during autumn of previous years [Schnelle-Kreis et al. 2001, Wittmaack and Lintelmann 2004, Lintelmann et al. 2005].
Figure 7.4 illustrates that PAH concentrations fluctuate significantly during the period of five weeks by factor of five both for PM and Gp. PAH concentration ranges from 3.0 to 16.4 for particulate 3-6 ring PAH and from 12.1 to 62.8 ng/m3 for gaseous phase 3-4 ring PAH. When also Naphthalene was regarded the range of fluctuations changed from 58.0 to 418.7 ng/m3 for Gp (2-4 ring PAH) and from 3.0 to 16.6 ng/m3 for PM (2-6 ring PAH).
70
Concentration [ng/m3]
60 50
PM PAH 3,6
PM PAH 4
PM PAH 5
Gp PAH 3,4
40 30 20 10 0 19.10 20.10 21.10 24.10 25.10 27.10 28.10 31.10 07.11 08.11 10.11 14.11 15.11
Figure 7.4. Changes of the PAH concentration in ambient aerosol samples collected during this study. Every point represent a sample from ozone denuder/filter/adsorber sampler, lines are to guide the eye.
Several factors can cause seasonal PAH fluctuations at the chosen sampling site [Lintelmann et al. 2005]: -
meteorological conditions − temperature (gas/particle partitioning, dispersion), O3 concentrations and UV radiation (photodegradation and oxidation of PAH), mixing conditions (wind speed and inversion layer hights, which are typical for winters in the
96
Results from the comparative outdoor sampling
Munich area inhibiting exchange in the atmosphere, leading to accumulation of pollutants in the lowest layer), -
vehicular sources − at low temperatures motor vehicles need a longer time to reaching the optimum working temperature which is characterized by constant emission of pollutants. So called ‘‘cold-starts’’ at temperatures below the working temperature lead to increased emission of PAH,
-
domestic heating − a main source for PAH therefore generally higher concentration levels in domestic heating season are observed [Schnelle-Kreis et al. 2005, Schauer et al. 2003].
7.4. Partitioning of PAH The rough estimation of the concentration ratio QFF/adsorber (particulate phase PAH collected on the QFF to gaseous PAH concentration collected on XAD resin) may be interpreted as gas/particle partitioning coefficient. Difficulties of quantifying gas/particle distribution were described in section 2.2.1.3. Warmer intervals promote higher concentration of 3- and 4-ring PAH in the Gp than during colder times what is clearly understandable because temperature is the key factor governing the partitioning behaviour of the semivolatile organic material. During this sampling campaign relationship of the PAH partitioning between Gp and PM with the average temperature was found (Figure 7.5) but only for Chrysene the difference was higher than 10%. For all others the difference was below this value. It can be explained by the temperature difference of only 7°C, impact of other weather conditions (RH) onto the partitioning and finally by the accuracy of the measurements of the low amount of ambient aerosol (~13 m3). Obtained partitioning pattern from the filter/adsorber (FA) sampler do not differ significantly from that obtained from ozone denuder/filter/adsorber (OdFA).
97
Results from the comparative outdoor sampling
Realtive concentration of the Gp, Gp/Gp+PM
100 warmer period
80
colder period 60
40
20
0 Nap
Ace
Flu
Phe
Ant
Fla
Pyr
Baa
Cry
Bbf
Bap
Bgh
Figure 7.5. Comparison of the relative concentration (average ± standard deviation) of the PAH in the gas phase (vs. sum of particulate and gas phase) during warmer (till 28.10, n=7) and colder period (from 31.10, n=6) obtained from the ozone denuder/filter/adsorber sampler.
7.5. Charcoal and ozone denuder influence on PAH sampling Relative concentrations of Phenanthrene, Anthracene, Fluoranthene and Pyrene from QFF sample alone obtained by means of charcoal denuder/filter/adsorber (CdFA) sampler were significantly lower in comparison with other QFF samples (FA and OdFA, Figure 7.6). Theoretically all PAH collected on adsorber in CdFA are regarded as the evaporated from particulate material on QFF. But when PAH from adsorber will be added to this from QFF significant overestimation, increasing with vapour pressure, will occur. This points either at important role of blow off artefact or not complete removing of gaseous PAH by the charcoal denuder. Concentrations of light PAH (Naphthalene, Acenapthylene, Fluorene and Phenanthrene) occurs on high concentration levels in Gp. Since concentration of those PAH found on adsorber in CdFA are much lower (