molecules Article
Development and Validation of a Kit to Measure Drink Antioxidant Capacity Using a Novel Colorimeter Alexandros Priftis 1 , Dimitrios Stagos 1 , Nikolaos Tzioumakis 2 , Konstantinos Konstantinopoulos 3 , Anastasia Patouna 4 , Georgios E. Papadopoulos 1 , Aristides Tsatsakis 5 and Dimitrios Kouretas 1, * 1 2 3 4 5
*
Department of Biochemistry and Biotechnology, University of Thessaly, Larissa 41221, Greece;
[email protected] (A.P.);
[email protected] (D.S.);
[email protected] (G.E.P.) Polytech S.A., Larissa 41222, Greece;
[email protected] Coffee Island S.A., Patras 26334, Greece;
[email protected] Department of Agricultural Engineering Technologists, TEI of Thessaly, Larissa 41110, Greece;
[email protected] Department of Forensic Sciences and Toxicology, Medical School, University of Crete, Heraklion 71003, Greece;
[email protected] Correspondance:
[email protected]; Tel.: +30-2410-565-277; Fax: +30-2410-565-293
Academic Editor: Derek J. McPhee Received: 13 July 2016; Accepted: 27 August 2016; Published: 30 August 2016
Abstract: Measuring the antioxidant capacity of foods is essential, as a means of quality control to ensure that the final product reaching the consumer will be of high standards. Despite the already existing assays with which the antioxidant activity is estimated, new, faster and low cost methods are always sought. Therefore, we have developed a novel colorimeter and combined it with a slightly modified DPPH assay, thus creating a kit that can assess the antioxidant capacity of liquids (e.g., different types of coffee, beer, wine, juices) in a quite fast and low cost manner. The accuracy of the colorimeter was ensured by comparing it to a fully validated Hitachi U-1900 spectrophotometer, and a coefficient was calculated to eliminate the observed differences. In addition, a new, user friendly software was developed, in order to render the procedure as easy as possible, while allowing a central monitoring of the obtained results. Overall, a novel kit was developed, with which the antioxidant activity of liquids can be measured, firstly to ensure their quality and secondly to assess the amount of antioxidants consumed with the respective food. Keywords: kit; antioxidant; quality control; DPPH; colorimeter; drink; beverage
1. Introduction All aerobic organisms are subject to damage from reactive oxygen species (ROS) [1]. ROS are mainly produced by the aerobic metabolism due to the imperfect reduction of O2 to H2 O, as 1%–5% of oxygen gets reduced to the superoxide anion (O2 − ), from which, in turn, the hydroxyl radical (HO ) occurs [2]. However, other sources of ROS production do exist and may lead to the accumulation of an excessive amount of such species. These sources include the “oxidative burst” of the immune system, the activity of many redox enzymes, as well as environmental factors like pollution or smoking [3]. ROS when in excess may cause severe damage to cellular macromolecules, a condition known as oxidative stress that has been associated with many diseases [4–6]. Living organisms have developed a delicate arsenal of endogenous antioxidant mechanisms to keep at a minimum the harmful effects of free radicals, however, sometimes these mechanisms do not suffice [4,7]. Therefore exogenous supplementation of antioxidants is considered necessary, mainly through food
Molecules 2016, 21, 1154; doi:10.3390/molecules21091154
www.mdpi.com/journal/molecules
Molecules 2016, 21, 1154
2 of 8
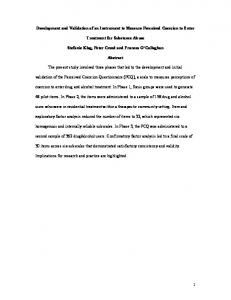
(either liquid or solid) [8,9]. Antioxidant foods have been the focus of numerous studies, in the endeavor to elucidate their properties and how they could be used to improve the overall antioxidant defense system of the human organism [8–10]. Attention has been mainly drawn towards polyphenols that constitute an important part of both edible and non-edible plant parts. Polyphenols are the most abundant plant secondary metabolism products (their number exceeds 8000 species) implicated in many characteristics of plants like color and defense [11]. Many studies have been conducted on polyphenols as they display strong antioxidant properties, among other biological activities [12]. For example, mitochondrial homeostasis may be altered by plant bioactive compounds like resveratrol through the modulation of the AMPK and TOR signaling pathways, favoring mitochondrial biogenesis and mitophagy, a process that eliminates old and malfunctioning mitochondria from the cell thus diminishing excess ROS production. In addition, such compounds may affect the mitochondrial-related apoptosis pathway [13,14]. Therefore, consuming foods and drinks derived from plants may provide the human organism with useful antioxidant molecules that can be employed to improve redox status. However, each plant contains different antioxidants at various amounts, leading to profound differences in the antioxidant capacity of foods and drinks originating from the processing of plants [15]. Therefore, being able to calculate each food's antioxidant capacity would provide useful information, and for this reason food industries conduct such checks routinely, mainly by using the Oxygen Radical Absorbance Capacity (ORAC) assay [16,17]. However, the equipment and the assays they use are quite expensive [18]. As a consequence, new fast, non-expensive assays and the respective equipment are sought, so that not only food industries, but other organizations or professionals will be able to perform food quality checks. In an effort to achieve this aim, a novel colorimeter with an accompanying software were developed as a kit that employs a slightly modified 2,2-diphenyl-1-picrylhydrazyl (DPPH) assay to estimate the antioxidant capacity of commonly consumed drinks such as coffee, wine and juices and beer. The DPPH assay relies on the scavenging of this artificial mauve radical. Generally there are two ways to neutralize a free radical, namely Single-Electron Transfer (SET) and Hydrogen Atom Transfer (HAT) and DPPH can be neutralized by both from antioxidant compounds, yielding the respective yellow hydrazine [19]. The whole idea for the development of this kit was conceived to provide a means to easily measure the antioxidant capacity of drinks and determine the daily intake of antioxidants. 2. Results and Discussion According to the 17 tested samples (espresso coffee, biological replicates) which are shown in Table 1, the newly developed colorimeter yielded very similar results compared to the Hitachi U-1900 which was used as a standard. The intraday standard deviation (SD) of the Radical Scavenging Capacity (RSC) was 1.96% for n = 5 (one sample measured five times within a day, technical replicates), while the 3-day SD of the RSC for n = 5 was 3.80% (five samples measured once daily for three consecutive days). However the 2-day SD of the RSC for the same samples was only 1.94%. This difference can be attributed to a deterioration of the sample's activity. The particular samples were espresso coffee, the activity of which has been found to deteriorate in a time dependent manner in previous measurements in our lab, especially after 24 h (data not published). Therefore the increase in the SD on the third day was expected. Apart from the SD, the Coefficient of Variation (CV) for the same samples was 0.05 for the intraday measurements and 0.09 for the 3-day measurements. In addition, the detection range was from 0.05 µL to 0.70 µL for espresso coffee, and so the limit of detection (LOD) for espresso coffee is 0.05 µL. Furthermore, the assay was very accurate for different concentrations, as 0.2, 0.3 and 0.4 µL of espresso coffee (n = 8) yielded potency values of 98.97, 101.52 and 98.48 µmol DPPH scavenged per mL liquid respectively. According to the statistical analysis, the comparison between the colorimeter and the Hitachi U-1900 spectrophotometer (i.e., the reference instrument) showed that the RSC value obtained by the colorimeter can be reliably predicted using the resulting equation (Figure 1).
Molecules 2016, 21, 1154
3 of 8
Table 1. Comparison of the DPPH assay Radical Scavenging Capacity (RSC) obtained from the colorimeter (inhCOLOR) and the Hitachi U-1900 spectrophotometer (inhSPECT). All measurements are the mean ± SD from each triplicate. inhSPECT
Sample
inhCOLOR
0.00 µL
0.10 µL
0.20 µL
0.30 µL
0.40 µL
0.50 µL
0.00 µL
0.10 µL
0.20 µL
0.30 µL
0.40 µL
0.50 µL
1 2 3 4 5 6 7 8 9 10 11 12 13 14 15 16 17
0.00 0.00 0.00 0.00 0.00 0.00 0.00 0.00 0.00 0.00 0.00 0.00 0.00 0.00 0.00 0.00 0.00
18.28 ± 0.52 7.07 ± 0.16 8.07 ± 0.24 17.22 ± 0.51 18.43 ± 0.35 18.52 ± 0.43 7.16 ± 0.12 6.24 ± 0.09 6.29 ± 0.11 16.59 ± 0.39 9.86 ± 0.20 0.54 ± 0.01 3.79 ± 0.09 8.99 ± 0.12 11.87 ± 0.25 4.17 ± 0.07 18.28 ± 0.67
28.43 ± 0.90 18.58 ± 0.76 26.62 ± 1.02 32.08 ± 1.28 29.13 ± 1.05 30.61 ± 0.78 16.58 ± 0.54 18.91 ± 0.43 16.86 ± 0.87 17.36 ± 0.66 17.14 ± 0.34 14.70 ± 0.66 9.79 ± 0.23 15.93 ± 0.49 22.59 ± 0.75 8.04 ± 0.32 28.43 ± 1.03
41.30 ± 1.35 35.62 ± 1.54 42.30 ± 1.22 42.90 ± 1.15 34.79 ± 1.00 41.65 ± 1.76 26.38 ± 0.95 28.80 ± 0.78 35.23 ± 0.96 34.48 ± 0.66 27.37 ± 0.74 32.70 ± 0.76 23.58 ± 0.69 41.25 ± 1.23 38.70 ± 1.04 30.48 ± 0.77 41.30 ± 0.55
59.46 ± 1.96 48.58 ± 1.55 55.38 ± 1.33 55.44 ± 1.24 50.32 ± 1.01 53.12 ± 1.86 32.68 ± 0.97 30.23 ± 0.78 45.69 ± 1.06 43.05 ± 1.15 36.56 ± 1.05 44.03 ± 1.24 36.29 ± 0.99 60.33 ± 2.01 55.98 ± 1.96 41.20 ± 1.29 59.46 ± 1.78
67.85 ± 2.14 58.85 ± 1.86 70.42 ± 1.99 64.83 ± 2.12 69.21 ± 2.20 62.66 ± 1.66 40.80 ± 0.98 39.00 ± 0.77 61.82 ± 2.03 53.05 ± 1.55 48.38 ± 1.13 47.53 ± 1.22 48.95 ± 1.65 72.75 ± 2.23 70.29 ± 2.10 47.43 ± 1.21 67.85 ± 1.97
0.00 0.00 0.00 0.00 0.00 0.00 0.00 0.00 0.00 0.00 0.00 0.00 0.00 0.00 0.00 0.00 0.00
14.92 ± 0.16 11.43 ± 0.11 13.29 ± 0.09 19.77 ± 0.30 19.28 ± 0.23 19.90 ± 0.17 7.29 ± 0.07 12.06 ± 0.10 15.93 ± 0.33 17.24 ± 0.18 15.78 ± 0.40 6.26 ± 0.15 9.06 ± 0.23 12.23 ± 0.22 13.35 ± 0.38 14.08 ± 0.41 14.92 ± 0.09
28.62 ± 0.70 25.39 ± 0.71 33.57 ± 0.95 37.09 ± 1.01 33.32 ± 0.78 33.90 ± 0.55 17.47 ± 0.16 23.40 ± 0.46 30.33 ± 1.01 29.80 ± 0.88 26.30 ± 0.76 18.28 ± 0.45 16.38 ± 0.35 22.70 ± 0.57 27.61 ± 0.33 11.86 ± 0.30 28.62 ± 0.18
47.23 ± 1.35 40.61 ± 1.15 51.28 ± 1.44 51.53 ± 1.65 40.32 ± 1.04 50.44 ± 1.47 28.00 ± 0.67 32.67 ± 0.88 44.31 ± 1.21 42.84 ± 1.00 38.96 ± 0.73 34.22 ± 0.89 32.05 ± 0.80 42.55 ± 1.10 41.37 ± 1.14 38.27 ± 0.99 47.23 ± 1.21
68.08 ± 2.01 54.65 ± 1.56 69.65 ± 2.15 69.02 ± 2.08 57.88 ± 1.76 64.13 ± 1.43 39.52 ± 1.02 42.77 ± 1.13 58.65 ± 1.43 56.58 ± 1.72 48.66 ± 1.13 43.86 ± 1.10 40.29 ± 1.01 62.34 ± 1.49 61.03 ± 1.86 48.26 ± 1.35 68.08 ± 1.56
86.75 ± 2.43 71.64 ± 1.78 92.59 ± 2.56 83.24 ± 1.97 76.63 ± 1.99 75.21 ± 2.01 50.17 ± 1.43 51.81 ± 1.32 78.37 ± 1.93 69.10 ± 1.77 63.75 ± 1.04 49.90 ± 0.55 51.51 ± 1.43 77.31 ± 2.04 74.01 ± 1.67 63.16 ± 1.59 86.75 ± 2.32
Average
0.00
10.67
20.69
35.22
47.52
58.33
0.00
13.93
26.15
41.40
56.09
70.70
6.04
7.32
6.22
9.77
11.19
4.02
7.02
6.96
10.45
13.71
SD
Molecules 2016, 21, 1154 Molecules 2016, 21, 1154
4 of 8 4 of 8
Figure 1. Comparison between the colorimeter and the Hitachi U-1900 spectrophotometer. spectrophotometer. The graph depicts the correlation between the observed RSC% (or inhibition, inh) from either the colorimeter colorimeter (inhCOLOR, or or thethe spectrophotometer (inhSPECT, y axis). The inhibition levels for each for quantity (inhCOLOR,xxaxis) axis) spectrophotometer (inhSPECT, y axis). The inhibition levels each are taken as averages over 17 samples measured three times each (Table 1). The error bars represent SD. quantity are taken as averages over 17 samples measured three times each (Table 1). The error bars The resulting equation of the regression line is inhSPECT% = inhCOLOR% X 0.8417 − 0.4789 and represent SD. The resulting equation of the regression line is ℎ % = ℎ % 0.8417 − the R2 measure measure is 0.9988. 0.4789 and the is R20.9988.
The regression line and SDSD from all all thethe measurements of the line was wasobtained obtainedby byusing usingthe theaverage average and from measurements of 17 samples shown in Table 1. The difference between the two instruments is linear, however the gap the 17 samples shown in Table 1. The difference between the two instruments is linear, however the is smaller when low low quantity is used andand it increases with higher quantity. Thus, it isit reasonable to gap is smaller when quantity is used it increases with higher quantity. Thus, is reasonable suggest that low quantity is to be used to achieve the highest accuracy. to suggest that low quantity is to be used to achieve the highest accuracy. Pearsoncorrelation correlation coefficient between the instruments two instruments waswith 0.999 < 0.001 The Pearson coefficient between the two was 0.999 p