American Journal of Analytical Chemistry, 2014, 5, 1239-1248 Published Online December 2014 in SciRes. http://www.scirp.org/journal/ajac http://dx.doi.org/10.4236/ajac.2014.517130
Development and Validation of a Stability-Indicating RP-HPLC Method for Determination of Darifenacin Hydrobromide in Bulk Drugs Mohammed Nazeerunnisa1, Lakshmi Garikapati2, Syama Sundar Bethanabhatla1,3* 1
Department of Chemistry, Acharya Nagarjuna University, Guntur, India Centre for Pharmaceutical Sciences, Jawaharlal Nehru Technological University, Hyderabad, India 3 Yogi Vemana University, Kadapa, India * Email:
[email protected] 2
Received 10 October 2014; revised 27 November 2014; accepted 13 December 2014 Academic Editor: Sai Raghuveer Chava, KC Pharmaceuticals Inc., USA Copyright © 2014 by authors and Scientific Research Publishing Inc. This work is licensed under the Creative Commons Attribution International License (CC BY). http://creativecommons.org/licenses/by/4.0/
Abstract An isocratic stability-indicating reversed phase high performance liquid chromatographic method (RP-HPLC) was developed for determination of process related impurities and assay of darifenacin hydrobromide (DRF) in bulk drugs. DRF was subjected to various stress conditions such as hydrolysis (acid, base, and neutral), oxidation, photolysis and thermal degradation as per International Conference on Harmonization (ICH Q1A(R2) and Q1B) prescribed conditions to investigate the stability-indicating ability of the method. Significant degradation was observed during acidic hydrolysis and oxidative stress conditions. The chromatographic separation was accomplished on a Prodigy C8 column (250 × 4.6 mm, 5 µm) with mobile phase consisting of 0.05 M ammonium acetate (pH adjusted to 7.2 by using ammonia solution) and methanol (36% acetonitrile) in 35:65 v/v ratio in an isocratic elution mode at a flow rate of 1.0 mL/min at 25˚C. Detection of analytes was carried out using photo diode array detector at a wavelength of 215 nm. The developed LC method was validated with respect to accuracy, linearity, precision, limits of detection and quantitation and robustness as per ICH guidelines.
Keywords Darifenacin Hydrobromide, Stability-Indicating, Degradation, Validation, RP-HPLC
*
Corresponding author.
How to cite this paper: Nazeerunnisa, M., Garikapati, L. and Bethanabhatla, S.S. (2014) Development and Validation of a Stability-Indicating RP-HPLC Method for Determination of Darifenacin Hydrobromide in Bulk Drugs. American Journal of Analytical Chemistry, 5, 1239-1248. http://dx.doi.org/10.4236/ajac.2014.517130
M. Nazeerunnisa et al.
1. Introduction
Darifenacin hydrobromide (DRF), a novel antimuscarinic agent, chemically known as (S)-2-[1-[2-(2,3-dihydrobenzofuran-5-yl)ethyl] pyrrolidin-3-yl]-2,2-diphenyl-acetamide hydrobromide, is a medication used to treat overactive bladder with symptoms of urge urinary incontinence, urgency, and frequency. It works by blocking the M3 muscarinic acetylcholine receptor selectively, which is primarily responsible for bladder contractions, thereby decreases the urgency to urinate [1] [2]. An extensive survey of literature revealed that few chromatographic methods have been published for the quantification of DRF and related substances. S. Thomas et al. reported a selective stability-indicating HPLC method for DRF in the presence of process related impurities and stress degradation products and characterization of degradation products by LC-MS studies [3]. Despite of the separation of several related substances and DRF, the method has limitations of using ion-pairing mobile phase additive, very high run time, and poor peak shape of DRF. M. V. Murthy et al. reported a stability-indicating UPLC method [4]. A stability-indicating LC method with chemometric evaluation of DRF was also reported [5]. A chiral stability-indicating assay method for the determination of DRF and its enantiomer and a chiral LC Method for enantiomeric purity determination of DRF in bulk drugs and extended release tablets were also reported [6] [7]. K. Srinivas et al. reported an impurity profile method for batch analysis of DRF [8]. In addition, B. Kaye et al. reported a solid phase extraction of DRF in human plasma [9]. To the best of our knowledge, no rapid stability-indicating HPLC method for the quantitative determination of DRF in drug substance in presence of more susceptible process related impurities in bulk drugs was reported. The main target of the present research work was to develop a selective, rapid and stability-indicating HPLC method for the determination of DRF and its related substances. The developed method was validated with respect to specificity, limits of detection (LOD), limits of quantitation (LOQ), linearity, precision, accuracy, solution and mobile phase stabilities, and robustness as per International Conference on Harmonization (ICH Q2R1) guidelines [10]. Forced degradation studies were performed on the DRF drug substance to establish the stabilityindicating nature of the method in accordance with established ICH guidelines [11].
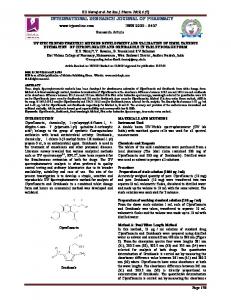
2. Experimental 2.1. Reagents and Chemicals HPLC grade acetonitrile and methanol and AR grade ammonium acetate and ammonia solutions were purchased from S.D. Fine chemicals Pvt. Ltd., Mumbai, India. High purity water was obtained by using Millipore Milli-Q water purification system (Millipore synergy, France). Samples of DRF and its three process related impurities (Imp-1: 2,2-Diphenyl-2-[(3S)-pyrrolidin-3-yl]acetamide tartarate, Imp-2: 5-(2-bromoethyl)-2,3-dihydrobenzofuran, Imp-3: N-(2-(2,3-dihydrobenzofuran-5-yl)ethyl)-2-(1-(2-(2,3-dihydrobenzofuran-5-yl)ethyl)pyrrolidin-3yl)-2,2-diphenyl acetamide) were received from a local industry, Hyderabad, India. Structures of DRF and impurities are shown in Figure 1. Among three impurities Imp-1 and Imp-2 are substrates and Imp-3 is a dimeric by-product. All required sample solutions, and solvents were filtered through 0.45 µm PTFE filter papers.
2.2. Equipment The HPLC system used for method development, forced degradation studies and method validation consisted of a quaternary UFLC LC-20AD liquid chromatograph pump module, a DGU-20A5 degasser, a SIL-20AC auto sampler, a CTO-20AC column oven compartment, a SPD-M20A photo diode array detector, and CBM-20A communications bus module (All from Shimadzu, Kyoto, Japan). The chromatographic and the integrated data were recorded using HP (Hewlett Packard, India) computer system using Lab Solutions data acquisition software (Shimadzu, Kyoto, Japan).
2.3. Chromatographic Conditions The chromatographic column used was Prodigy C8 column (250 × 4.6 mm, 5 μm particle size, 150A˚) of Phenomenex make. The batch and serial numbers of the column are 5182-22 and 585196-1, respectively. All the chromatograms given in this paper are of this column. Another Prodigy C8 column of same dimensions but with
1240
M. Nazeerunnisa et al.
Figure 1. Chemical structures of DRF, impurities (Imp-1, Imp-2, and Imp-3), and degradation of products (A1, A2, O1, and O2).
different batch (5234-033) and serial number (652229-1) is used for intermediate precision study. The mobile phase used consists of (solvent A) 0.05 M ammonium acetate pH adjusted to 7.2 by using ammonia solution, and (solvent B) methanol and acetonitrile in 64:36 v/v ratio. The separation was achieved in an isocratic elution mode at 50:50 v/v ratio of solvent A and solvent B at a flow rate of 1.0 mL/min at a column temperature of 25˚C. The chromatograms were monitored at a wavelength of 215 nm. The injection volume was 10 μL. A mixture of methanol and water (1:1 v/v) was used as diluent.
2.4. Preparation of Standard Solutions and Sample Solutions Stock solutions of DRF (2.0 mg/mL) and all impurities (0.5 mg/mL each) were prepared by dissolving in minimum amount of methanol and made up to volume with diluent. Working solutions of DRF spiked and unspiked with impurities were prepared from the stock solution for the determinations of related substances and assay, respectively.
2.5. Forced Degradation Studies and Specificity Specificity is the ability of the method to measure the analyte (DRF) response unequivocally in the presence of its possible impurities. The specificity of the developed HPLC method for DRF was determined in the presence of its process related impurities (Imp-1 to Imp-3 at 0.15%) and degradation products formed under stress. Forced degradation studies of drug can help to identify the likely degradation products, also they in turn can help to establish the degradation pathways and the intrinsic stability of the molecule. In order to develop a specific stability-indicating method, forced degradation studies were carried out on DRF active pharmaceutical ingredient powder. DRF was subjected to various stress conditions and generated samples were injected into HPLC at regular intervals and the final stress conditions were established in such a way to get significant degradation. Applied stress conditions are acidic hydrolysis (0.5 N HCl, reflux at 70˚C for 18 h), basic hydrolysis (1 N NaOH, reflux at 70˚C for 24 h), neutral hydrolysis (reflux at 70˚C for 24 h), oxidation (3% hydrogen peroxide, in the dark at room temperature for 10 days), thermal (DRF powder in a petri dish was placed in a temperature controlled dry air oven (Cintex Industrial Corporation, Mumbai, India) maintained at 60˚C for 10 days) , and Photo
1241
M. Nazeerunnisa et al.
(DRF powder and solution were kept under fluorescent and UV light in a photostability chamber (Sanyo, UK) for a period of 1.2 million Lux hours and 200 Wh/m2, respectively). Samples of acid and base hydrolyses were neutralized, and all the degradation samples were diluted five times for assay determination. Assays were performed by comparison with standard and the mass balances (% assay + % impurities + % degradation products) were calculated for stressed samples. The three degradation samples of each stress were injected into an LC-PDA system to check the purity and homogeneity of the drug peak.
2.6. Method Validation The validation of the developed HPLC method was carried out for the determination of related substances (Imp1 to Imp-3) and assay of DRF as per ICH guidelines to demonstrate that the method is appropriate for its intended use. 2.6.1. System Suitability The system suitability tests were conducted and evaluated by injecting six replicates of 800 µg/mL (spiked with 0.15% of all impurities), and 100 µg/mL of DRF solutions for related substance and assay methods, respectively. 2.6.2. Precision The system precision was evaluated by analyzing six replicates of standard solution for both assay (DRF 100 µg/mL) and related substances (DRF (800 µg/mL) spiked with 0.15% each impurity) individually. The method precisions for assay and related substances were evaluated by injecting six individual test preparations of DRF (100 µg/mL), and DRF (800 µg/mL) spiked with 0.15% each impurity, respectively. The intermediate precisions were evaluated on three different days by a different analyst using different batch column of same manufacturer and instrument located within the same laboratory. Precision at LOQ levels was also determined by injecting six individual preparations of mixture of all impurities spiked to DRF (800 µg/mL) at their LOQ level. The %RSDs of the areas of each impurity and assay of DRF were calculated for precision studies. 2.6.3. Limit of Detection (LOD) and Limit of Quantification (LOQ) To establish the minimum concentration at which the analyte was reliably detected (LOD) and quantified (LOQ), the signal-to-noise ratios were determined. The LOD and LOQ for Imp-1, Imp-2, Imp-3 and DRF were estimated at a signal-to-noise ratio of 3:1 and 10:1, respectively, by injecting a series of dilute solutions with known concentrations. 2.6.4. Linearity Linearity of the related substance method was established by analyzing series of dilute solutions at six different concentration levels ranging from LOQ to 250% to the specification level of impurities (i.e., LOQ, 0.6, 1.2, 1.8, 2.4, and 3.0 µg/mL) spiked into DRF drug substance (800 µg/mL). The calibration curves were drawn by plotting the peak areas of impurities against their corresponding concentrations. Similarly, assay method linearity was established by injecting DRF at five different concentration levels ranging from 50% to 150% (i.e., 50, 75, 100, 125, and 150 µg/mL) to DRF concentration 100 µg/mL. The correlation coefficients (r2), slopes and Y-intercepts of impurities and DRF were determined from their respective calibration plots. 2.6.5. Accuracy Accuracy of the related substance method was evaluated by spiking known amounts of the impurities into the test sample, analyzing the same and calculating the percent recovered. For related substances, the recovery studies were performed in triplicate at three concentration levels (50%, 100% and 150%) to specification level (0.15%) of impurities (i.e., 0.6, 1.2, and 1.8 µg/mL) with respect to DRF drug substance concentration 800 µg/mL. The accuracy of the DRF assay was evaluated in triplicate at the three concentration levels 50%, 100% and 150% (i.e., 50, 100 and 150 µg/mL) to DRF concentration 100 µg/mL, and the recovery was calculated for each concentration. 2.6.6. Robustness Robustness study was carried out to check the influence of small variations in the optimized chromatographic
1242
M. Nazeerunnisa et al.
conditions. The typical parameters investigated include flow rate (±10% to 1.0 mL/min), mobile phase pH (±0.2 to 7.2), and column temperature (±3˚C to 25˚C). System suitability parameters and changes in assay of DRF and recoveries of impurities were checked. In all the above deliberately altered experimental conditions, the mobile phase compositions were held constant. 2.6.7. Solution Stability and Mobile Phase Stability The solution stability of DRF and its impurities was carried out by leaving unspiked and spiked sample solutions in a tightly capped volumetric flask at 2˚C - 8˚C for 48 h. Content of impurities and assay of DRF were determined at 8 h intervals. Mobile phase stability was assessed by comparative analysis of freshly prepared sample solutions and freshly prepared reference standard solution up to 48 h.
3. Results and Discussion 3.1. Optimization of Chromatographic Conditions The main objective of the development of a chromatographic method was to get the good separation of impurities and stress degradation products from DRF and each other. For method development DRF, DRF spiked with impurities, acid and oxidative stress generated samples were injected simultaneously. In the initial stages of method development with C18 stationary phase columns (Agilents’ XDB and Extend) showed very quick elution of Imp-1 and DRF along with peak asymmetry with several mobile phase compositions consisting of acetate/ phosphate buffers and acetonitrile/methanol due to their high polarity. To increase the retention of DRF, moderately polar C8 stationary phase column was employed instead of nonpolar C18 column. Replacement of C18 with C8 resulted in good peak parameters with increased retentions of Imp-1 and DRF compared to C18. As the pKa value of DRF (≈9.2) is higher, buffers with higher pH were chosen initially with C8 stationary phase column. Disodium hydrogen orthophosphate (0.02 M, pH adjusted to 7.0 with orthophosphoric acid) buffer with acetonitrile showed peak asymmetry (tailing > 2), but with methanol good peak parameters for DRF were resulted. At lower concentrations of methanol, peak fronting and higher retention times of analytes were observed. As the methanol concentration increases to decrease the LC run time, improvement in peak symmetry (tailing factor 1.05) with good column efficiency (Plate count > 9000) for DRF (assay peak) was observed, but showed co-elution of Imp-3 with DRF (spiked sample). Buffers with lower pH (≈4.0) showed peak asymmetry. Trails with mono phosphate buffer (KH2PO4) also resulted in same type of results. Later, improved separation between analytes and difference in elution order was observed when phosphate buffer was replaced by ammonium acetate buffer. During method development with ammonium acetate buffer, several isocratic methods were employed and the effects of ionic strength of buffer, pH and organic modifier compositions on peak parameters were studied. 3.1.1. Effect of Buffer Concentration The effect of concentration of ammonium acetate buffer on separation was studied by varying its concentration from 0.01 to 0.05 M on Prodigy C8 column maintained at 25˚C. The change in the concentration of ammonium acetate had shown no much effect on the retention of the analytes, and on resolution. But peak tailing of DRF was improved form >2 to