Development and Validation of RP-UPLC Method using Experimental Design Approach for Simultaneous Estimation of Candesartan Cilexetil and Chlorthalidone
Singhal M1, Amin S1, Kukrety A1, Chauhan A2, Tiwari VK2, Singh RM2*, Mathur SC2, Saini PK2, Singh GN2
1
Department of Pharmaceutics, Jamia Hamdard University, Hamdard Nagar, New Delhi-110062,
India. 2
Analytical Research & Development Division, Indian Pharmacopoeia Laboratory, Indian
Pharmacopoeia Commission, Ministry of Health & Family Welfare, Govt. of India, Sector-23, Rajnagar, Ghaziabad-201002, India.
*For correspondence Analytical Research & Development Division, Indian Pharmacopoeia Laboratory, Indian Pharmacopoeia Commission, Ministry of Health & Family Welfare, Govt. of India, Sector-23, Rajnagar, Ghaziabad, Uttar Pradesh-201002, India. E-mail:
[email protected]
1
ABSTRACT Candesartan Cilexetil is an antihypertensive agent currently available in combination with Hydrochlorothiazide. However, it has been proven by the research that half dose of Chlorthalidone is equipotent to the dose of Hydrochlorothiazide in similar combination with Candesartan Cilexetil. At present there is no Liquid Chromatographic (LC) method available for the simultaneous estimation of Candesartan Cilexetil and Chlorthalidone in pharmaceutical dosage form. A simple, rapid, reliable and robust reversed phase ultra-performance liquid Chromatography (RP-UPLC) method was developed as per International Conference on Harmonization (ICH) guidelines. The best separation was achieved in less than 5 minutes on a 50 × 2.1 mm, 2.2 µm particle size Dionex C18 column with the gradient mobile phase 5 mM, 6.2 ± 0.5 pH ammonium acetate buffer - acetonitrile at a flow rate of 0.5 mL/min at 215nm. The detector response was linear in the range of 10-200 ppm of these drugs. LOD obtained was 3.04 ppm for Candesartan Cilexetil, 2.82 ppm for Chlorthalidone. Further evaluation of robustness of this method was carried out using Plackett-Burman verification with four factors two levels (high & low) within analytical QbD-principles using statistical software. The outcome of normal probability and overall desirability plots were found acceptable. Keywords: Candesartan Celixetil, Chlorthalidone, UPLC, ICH guidelines, Validation, Hypertension. INTRODUCTION Hypertension is the one of the major cardiovascular risk factor worldwide, contributing to one half of the coronary heart disease and approximately two thirds of the cerebrovascular disease burdens. According to World Health Organization/International Society of Hypertension statement on management of hypertension a low dose diuretic should be considered for initial
2
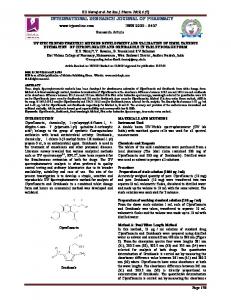
therapy, for patient without a compelling indication for a particular drug. Thiazide diuretic is the best option in most cases1. Chlorthalidone is a thiazide‐related diuretic, provide longer duration of therapeutic benefit and also control oedema. Candesartan Cilexetil provides important clinical benefits when added to standard therapy for chronic heart failure (CHF) at little or no additional cost. Preliminary data from a United State cost-effectiveness analysis based on CHARM (Candesartan in Heart failure - Assessment of mortality and Morbidity) data also showed encouraging results for Candesartan Cilexetil. In conclusion, despite some inherent limitations, the addition of Candesartan Cilexetil to standard therapy of CHF in patients with CHF and compromised Left Ventricular systolic function appears to be cost effective2. Moreover in the recent research it is proved that half dose of Chlorthalidone (12.5 mg) is equipotent to the dose of Hydrochlorothiazide (25 mg) in similar combination with Candesartan Cilexetil (8 mg)3. Candesartan Cilexetil, 1-[[(cyclohexyloxy)carbonyl] oxy]ethyl2-ethoxy-1-[[2'(1H-tetrazol-5yl)[1,1'-biphenyl]-4yl]methyl]-1H-benzimidazole-7-carboxylate
is
a
prodrug
which
is
hydrolyzed to Candesartan, belongs to benzimidazole class. Molecular formula and molecular mass of Candesartan Cilexetil is C33H34N6O6 and 610.66 g/mol respectively4,5. It is practically insoluble in water and sparingly soluble in methanol6. Chlorthalidone, 2-Chloro-5-(1-hydroxy-3oxo-2,3-dihydro-1H-isoindol-1-yl) benzene sulfonamide is a sulphonamide-like diuretic. Molecular formula and molecular mass of Chlorthalidone is C14H11ClN2O4S and 322.77 g/mol respectively7. It is practically insoluble in water and highly soluble in methanol8. Currently, there are few HPLC methods available for the estimation of Candesartan Cilexetil8.9,10,11 and Chlorthalidone12,13,14,15 in pharmaceutical products. However there is no liquid chromatographic method available for the simultaneous estimation of Candesartan Cilexetil and Chlorthalidone in pharmaceutical dosage form. Moreover it is proved that their administration in combination
3
provides improve therapeutic benefits3. So there is a need for the development of simple, reliable and rapid liquid chromatographic method for their simultaneous estimation. Ultra performance liquid chromatography (UPLC) takes advantage of technological advances made in particle chemistry performance, detector design, data processing, system optimization and control. Using instrumentation that operate at high pressure, 2.2 µm particles and mobile phases at high linear velocities than those used in HPLC, remarkable increases in resolution, speed of analysis and sensitivity can be obtained16. EXPERIMENTAL Reagents and chemicals Candesartan Cilexetil WS (Working Standard) was obtained from M/s Mylan Laboratories Ltd, Andhra Pradesh, India (99 % purity) and Chlorthalidone IPRS (Indian Pharmacopoeia Reference Standard) was obtained from Indian Pharmacopoeia Commission, Ghaziabad, India (99 % purity). Tablets dosage forms Blopress (Candesartan Cilexetil), Klorzid (Chlorthalidone) were purchased from Takeda, Japan and Zydus Medica, India respectively. HPLC grade ammonium acetate was obtained from Sisco Research Laboratories (Mumbai, India) and acetonitrile was obtained from Merk Specialities Private Limited (Mumbai, India) Water prepared using Milli-Q system (Millipore Co., Bedford, USA) was used. Nylon syringe filters (0.22 µm) were obtained from Millipore (Bangalore, India). Instrumentation Chromatographic separations were carried out using a Dionex UHPLC Ultimate 3000. The output signals were monitored and processed by Chromeleon software. Analytical balance and pH meter from Mettler Toledo and Ultrasonicator from Branson was used.
4
Chromatographic conditions A Dionex Acclaim RSLC C18 Column 50 mm × 2.1 mm id, 2.2 µm particle size, 120 Aº pore size was used as the stationary phase. A gradient run program at a flow rate of 0.5 mL/ min using 5 mM ammonium acetate buffer, pH 6.2 ± 0.5 was used as mobile phase A and acetonitrile was used as mobile phase B. The column effluent was monitored at 215 nm (Fig. 1).The separation was achieved by step gradient elution technique. The beginning ratio was mobile phase A: mobile phase B; 90:10 (v/v); constant for 3 minutes. Then, the ratio was changed linearly to 45:55 (V/V) within 3.5 minutes up to 6.5 minutes. Then the column was re-equilibrate to initial conditions within 7 minutes up to 10 minutes. The gradient programme is shown in Table I. The mobile phase was filtered through a 0.22 μm Millipore filter before use. UV detection was performed at 215 nm. The sample injection volume was 5 μL. Standard solution preparation Accurately weighed Candesartan Cilexetil (32 mg) and Chlorthalidone (50 mg) were transferred to 100 mL volumetric flask, dissolved and diluted up to mark with methanol to obtain a standard stock solution of Candesartan Cilexetil (320 ppm) and Chlorthalidone (500 ppm). An aliquot of the stock solution (1 mL) was transferred to 10 mL volumetric flask and diluted to the mark with methanol to obtain a mixed standard solution of Candesartan Cilexetil (32 ppm) and Chlorthalidone (50 ppm). The solution was filtered through a 0.22 µm membrane filter and 5 µL was injected. Test solution preparation Candesartan Cilexetil (Blopress) and Chlorthalidone (Klorzid)- 20 tablets each containing 12.5 mg Chlorthalidone and 8 mg Candesartan Cilexetil were weighed, powdered, mixed and analyzed. Powder equivalent to 32 mg of Candesartan Cilexetil was weighed accurately, diluted
5
with methanol in a 100 mL volumetric flask, sonicated for approximately 10 minutes, cooled to room temperature and diluted to volume with same solvent. The solution was filtered using 0.22 µm membrane filter to remove insoluble matter. An aliquot (1 mL) of the sample stock solution was transferred to 10 mL volumetric flask and diluted to mark with methanol to obtain a working sample solution of Candesartan Cilexetil (32 ppm) and Chlorthalidone (50 ppm). Preparation of forced degradation samples (i) Preparation of acid induced degradation sample Initially, 10 mg each of Candesartan Cilexetil and Chlorthalidone was dissolved in methanol, sonicated for about 10 minutes with occasional shaking, 50 mL of 0.1 M hydrochloric acid as stress agent was added to the solution. The solution was refluxed at 80oC for 2 hours and then cooled to the room temperature. The solution was neutralized with 50 mL of 0.1 M sodium hydroxide solution and then make up to 200 mL with methanol to obtain a solution of 50 ppm each of Candesartan Cilexetil and Chlorthalidone. (ii) Preparation of base induced degradation sample Initially, 10 mg each of Candesartan Cilexetil and Chlorthalidone was dissolved in methanol, sonicated for about 10 minutes with occasional shaking, 50 mL of 0.1 M Sodium hydroxide as stress agent was added to the solution. The solution was refluxed at 80oC for 2 hours and then cooled to the room temperature. The solution was neutralized with 50 mL of 0.1 M Hydrochloric acid solution and then make up to 200 mL with methanol to obtain a solution of 50 ppm each of Candesartan Cilexetil and Chlorthalidone. (iii) Preparation of oxidative-stress (H2O2) induced degradation sample Initially, 10 mg each of Candesartan Cilexetil and Chlorthalidone was dissolved in methanol, sonicated for about 10 minutes with occasional shaking, 5 ml of 5 % w/v H2O2 was added to the
6
solution. The solution was kept at room temperature for 15 minutes. The solution was neutralized with 5 mL of 5 % sodium metabisulphite solution and then make up to 200 mL with methanol to obtain a solution of 50 ppm each of Candesartan Cilexetil and Chlorthalidone. (iv) Preparation of thermal induced degradation sample Initially, 10 mg of Candesartan Cilexetil and Chlorthalidone was kept at temperature controlled oven at 80oC for 24 hours. 5 mg each of Candesartan Cilexetil and Chlorthalidone was weighed and transferred to 100 mL volumetric flask, dissolved in methanol and sonicated for about 15 minutes. The solution was make up to 100 mL with methanol to obtain a solution of 50 ppm each of Candesartan Cilexetil and Chlorthalidone. (v) Preparation of photolytic induced degradation sample Initially, 5 mg of Candesartan Cilexetil and Chlorthalidone was weighed and transferred to 100 mL volumetric flask in a UV light cabinet and exposed to radiation 320-400 nm for 8 hrs at 25°. The solution was make up to 100 mL with methanol to obtain a solution of 50 ppm each of Candesartan Cilexetil and Chlorthalidone. RESULTS AND DISCUSSION Method Development For successful method development, preliminary tests were performed in order to select optimum UPLC condition. Parameters such as choice of analytical column, pH of the buffer, mobile phase composition, detection wavelength and other factors were exhaustively studied. Various reverse phase columns and isocratic and gradient mobile phase systems were tried. When experiments were performed with methanol instead of acetonitrile as the organic modifier in the mobile phase, there were late elutions of analytes with peak tailing were observed. Hence, the experiments were carried out with acetonitrile as the organic modifier. Initially, HPLC
7
columns such as C18 (4.6 × 250 mm id, 5 µm partial size) column with same mobile phase and 1-2 mL/min flow rate were examined. There were problem of peak tailing, low resolution between the peaks observed, moreover Candesartan Cilexetil contain an unknown impurity that was also interfering with the principal peak. Due to this problem method was transferred to UPLC initially, isocratic conditions were tried at UPLC column but impurity was merging with the peak. Finally a satisfactory separation of both the drugs was achieved with in 5 min on a 50 × 2.1 mm id, 2.2 µm particle size, 120 Aº pore size, Dionex Acclaim® RSLC C18 column with the gradient mobile phase 5 mM, 6.2 ± 0.5 pH ammonium acetate buffer - acetonitrile at a flow rate of 0.5 mL/min. The column effluents were monitored at 215 nm at ambient column temperature (Figure 1). Method Validation The developed UPLC method was validated to confirm that it was suitable for its intended purpose as described in International conference on Harmonization Q2(R1) guidelines17. ICH Q6A guidelines explicitly require forced decomposition studies to be conducted under a variety of conditions and separation of the pure drug from its degradation products for stabilityindicating assay methods18. UV-degradation was carried out according to ICH (Q1B) guidelines19. The described method was extensively validated in terms of specificity, linearity, accuracy, precision, detection limit, quantitation limit, robustness and system suitability. (a) Specificity (Forced degradation studies) Specificity of the method was ascertained by analyzing reference standard and test sample. Specificity of the method was also evaluated by injecting the stressed solutions of Candesartan Cilexetil and Chlorthalidone as well as standard solutions of Candesartan Cilexetil and Chlorthalidone. The Proposed method resolved both the drugs very efficiently i.e. Chlorthalidone
8
(Rt = 4.34) and Candesartan Cilexetil (Rt = 4.86). No interferences from impurities, excipients or additives were found. Moreover thermal stressed solution show practically no change in chromatogram where as acid, base and oxidative stressed induced sample show impurity without interference with main peak (Fig. 2-6). (b) Linearity The linearity of the method was determined at five concentration level ranging from 10-200 ppm for each drug. The calibration curves were constructed by plotting peak area versus concentration of Candesartan Cilexetil and Chlorthalidone respectively and the regression equations were calculated. Each response was the average of three determinations. Linear correlation was obtained between peak area and concentration in the range of 10-200 ppm for Candesartan Cilexetil and Chlorthalidone. The linearity of the calibration curve was validated by the value of correlation coefficient of the regression (r) and regression coefficient (R2). The regression analysis result of calibration curve is shown in Table II. (c) Accuracy (Recovery) The accuracy of the method was evaluated in triplicate by analysis of standard addition at three concentration levels i.e. 50, 100 and 150 % of the target concentration (50 ppm) of each drug. The recoveries were calculate. The percentages of the recoveries obtained were 93.31 - 96.26 % and 100.53 - 102.43 % for Candesartan Cilexetil and Chlorthalidone respectively is shown in Table III and Table IV. (d) Precision Precision of the method was estimated with respect to both repeatability (intra-assay) and intermediate precision (inter-day). It was performed by using concentration of 50, 100 and 150 ppm each of Candesartan Cilexetil and Chlorthalidone. Intra-assay precision was assessed by
9
analysis of the same sample concentration in triplicate and inter-day precision was assessed by analysis of the same sample concentration in triplicate on three different days over a period of one week. For intra-assay precision (repeatability), the values of RSD of three concentrations 50, 100 and 150 ppm level were obtained as 1.45, 1.45, 1.88 % for Candesartan Cilexetil and 1.24, 2.14, 1.80 % for Chlorthalidone respectively. For inter-day precision, the values of RSD of three concentrations 50, 100 and 150 ppm level were obtained as 1.22, 0.5, 1.22 % for Candesartan Cilexetil and 1.4, 0.9, 1.0 % for Chlorthalidone respectively. The developed method was found to be precise is shown in Table V and Table VI. (e) Limit of detection and limit of quantitation Limit of detection (LOD) and limit of quantitation (LOQ) of Candesartan Cilexetil and Chlorthalidone was estimated using the proposed method and were calculated by using these equations: LOD = 3.3 × σ /S and LOQ = 10 × σ /S, where σ is the standard deviation of the response and S is the slope of the calibration curve. To estimate LOD and LOQ a calibration plot was constructed by plotting peak area against concentration of Candesartan Cilexetil and Chlorthalidone and the regression equation was determined. The residual standard deviation of a regression line may be used as the standard deviation and slope is estimated from the calibration curve. The LOD for Candesartan Cilexetil and Chlorthalidone was obtained as 3.04 and 2.82 ppm respectively while LOQ were 9.23 and 8.56 ppm respectively is shown in Table II. (f) Robustness A Plackett-Burman experimental design consisting of 12 experiments with two replicates in block was used for the robustness testing. By varying different analytical parameters: flow rate (0.45 and 0.55 mL/min), buffer strength (4.5 and 5.5) mM, Ammonium acetate buffer pH (5.8 and 6.2) and column temperature (25°C and 35°C). The responses were assessed using Statistics
10
software (Table VII) Normal probability plots for different chromatographic parameters as a function of operational variables levels were presented in Fig. 7-9. Further from the analysis of data using statistical software for optimization of analytical method, it is evident that the desirability of method is not affected by change in flow rate (0.45 and 0.55 ml/min), buffer strength (4.5 and 5.5 mM), mobile phase pH (5.8 and 6.2) and column temperature (25 and 35°C); hence proved to be robust (Fig. 10). (g) System suitability test The system suitability test represented an integral part of the method validation and were used to ensure retention time, peak area, peak asymmetry, number of theoretical plates and resolution using replicate injection of concentrations 50 ppm for candesartan cilexetil and chlorthalidone (Table VIII). Analysis Of Bulk Drug and Tablet Dosage Form The proposed validated method was successfully applied for analysis of Candesartan Cilexetil and Chlorthalidone in bulk and tablet dosage form. The results obtained for both the drug were comparable to the corresponding labeled amounts. The results of assay in bulk and tablet dosage forms are shown in Tables IX and X. CONCLUSION A RP-UPLC method for simultaneous estimation of Candesartan Cilexetil and Chlorthalidone was developed.
It is a rapid, precise, economic and accurate method that can be utilized to
quantify these anti-hypertensives drugs. Moreover, a gradient mobile phase composition is set which help in separation of process related impurity found in Candesartan Cilexetil. This method can be applied in the routine analysis of Candesartan Cilexetil and Chlorthalidone containing drug products and if a fixed dose combination of Candesartan Cilexetil and Chlorthalidone
11
developed in future this method can be used because it is clinically proved that both drugs in combination provide increased therapeutic response than alone. ACKNOWLEDGMENT We are grateful to M/s Mylan laboratories ltd. (Andhra Pradesh, India) for supplying gift sample of Candesartan Cilexetil. Special thanks to the Indian Pharmacopoeia Commission, Rajnagar (Ghaziabad, India) for providing Chlorthalidone IPRS and instrumental facilities.
REFERENCES 1. Whitworth JA.: 2003 World Health Organization (WHO)/ International Society of Hypertension (ISH) Statement on Management of Hypertension. J Hypertens. 2003, 21, 19831992. 2. Plosker GL., Keam SJ.: Candesartan Cilexetil. Pharmacoeconomics. 2006, 24, 1249-1272. 3. Kwon BJ., Jang SW., Choi KY., Kim DB., Cho EJ., Ihm SH., Youn HJ., Kim JH.: Comparision of the Efficacy between Hydrochlorothiazide and Chlorthalidone on Central Aortic Pressure when added on to Candesartan in Treatment-naïve Patients of Hypertension. Hypertens Res. 2013, 36, 79-84. 4. The Merck Index 13th Ed., White House Station, NJ, (2006), pp 291. 5. Sweetmaan, S.C. (ed.) Martindale: The Complete Drug Reference, Pharmaceutical Press, London, UK, (2011), pp 1363. 6. United States Pharmacopoeia, 36th ed. Rockville, MD: United States Pharmacopoeial Convention; 2013. pp 5827. 7. Sweetmaan, S.C. (ed.) Martindale: The complete Drug Reference, Pharmaceutical Press, London, UK, (2011), pp 1369.
12
8. The British Pharmacopoeia, The British Pharmacopoeia Commission; 2013. pp 507. 9. Subba Rao DV., Radhakrishnanand P.: Suryanarayana MV, Himabindu V. A Stability Indicating LC method for Candesartan Cilexetil, Chromatographia. 2007, 66, 499-507. 10. Annapurnaa MM., Narendra A., Kumar KR.: Liquid Chromatographic Method for the Simultaneous Determination of Candesartan Cilexetil and Hydrochlorthiazide in Pharmaceutical Dosage Form. J Drug Deliv Therap. 2012, 2, 48-54. 11. Stenhoff H., Lagerstrom PO., Andersen C.: Determination of Candesartan Cilexetil, Candesartan, and A Metabolite in Human Plasma and Urine by Liquid Chromatography and Fluorometric Detection. J Chromatogr B Analyt Technol Biomed Life Sci. 1999, 731, 411417. 12. El-Gindy A., Sallam S., Abdel-Salam RA.: HPLC Method for the Simultaneous Determination of Atenolol and Chlorthalidone in Human Breast Milk. J Sep Sci. 2008, 31, 677682. 13. Elshanawane AA., Mostafa SM., Elgawish MS.: Development and Validation of Reversed Phase High Performance Liquid Chromatographic Method for the Simultaneous Estimation Determination of Amiloride Hydrochloride, Atenolol, Hydrochlorothiazide, Chlorthalidone in their Combined Mixtures. J AOAC Int. 2009, 92, 404-409. 14. Gonzalez O., Iriarte G., Ferreirós N., Maguregui MI., Alonso RM., Jiménez RM.: Optimization and Validation of A SPE-HPLC-PDA-Fluorescence Method for the Simultaneous Determination of Drug used in Combined Hypertension Therapy in Human Plasma. J Pharm Biomed Anal. 2009, 50, 630-639. 15. United States Pharmacopoeia, 36th ed. Rockville, MD: United States Pharmacopoeial Convention; 2013 p. 2971.
13
16. Swartz ME.: UPLC: An introduction and review, J Liq Chromatogr Relat Tech. 2005, 28, 1253-1263. 17. ICH Q2(R1), Validation of Analytical Procedures: Test And Methodology, 2005; 1-17. 18. ICH Q6A, Specifications: Test Procedures And Acceptance Criteria For New Drug Substance And New Drug Products: Chemical Substances, 1999; 1-35. 19. ICH Q1B, Stability Testing: Photostability Testing Of New Drug Substances And Products, 1996; 1-12.
14
LIST OF TABLES Table I: Gradient Programme Time (Minutes) Mobile Phase A (Buffer) Mobile Phase B (Acetonitrile) 0 90 10 3 90 10 3.5 45 55 6.5 7 10
45 90 90
55 10 10
Table II: Linear regression data for the calibration curves (n = 3) Parameters Linearity range (ppm) Regression equation Correlation co-efficient (r) Regression co-efficent (R2) Slope ± SD Intercept ± SD LOD (ppm) LOQ (ppm)
Candesartan Cilexetil 10-200 ppm Y= 0.863 x + 1.148 0.998 ± 0.00075 0.999 ± 0.00047 0.863± 0.024 1.148± 0.074 3.04 9.23
Chlorthalidone 10-200 ppm Y =1.013 x + 3.981 0.999 ± 0.00045 0.999 ± 0.00028 1.013± 0.082 3.981± 0.087 2.82 8.56
Table III: Accuracy of Candesartan Cilexetil Level (%)
Initial amount (ppm) 51 53 55 56 58 56 53 52 52
50
100
150
Amount added (ppm) 25
50
75
Total Total amount Recovery Average % amount found (ppm) (%) Recovery RSD (ppm) (%) ± SD 76 71.40 93.95 96.26 ± 2.46 2.55 78 74.86 95.98 80 79.08 98.85 106 97.07 91.57 108 100.70 93.24 93.31 ± 1.77 1.89 106 100.82 95.11 128 121.79 95.14 95.83 ± 0.85 0.89 127 122.93 96.80 127 121.37 95.56 Total Average (%) ± SD = 95.13 ± 1.59 SE = 0.92 % RSD = 1.67
SE
1.42
1.02
0.49
SD = Standard deviation RSD = Relative standard deviation SE = Standard Error
Table IV: Accuracy of Chlorthalidone Level (%)
50
Initial amount (ppm) 52 51 53 53
100
150
Amount added (ppm) 25
Total amount (ppm)
Total amount found (ppm)
Recovery (%)
77 76 78 103
73.60 77.49 81.21 100.50
95.58 101.88 104.12 97.57
50 54 52 48 46 47
75
Average Recovery (%) ± SD
% RSD
SE
100.53 ± 4.42
4.40
2.55
101.02 ± 3.43
3.43
1.98
0.95
0.54
104 105.11 101.07 102 106.52 104.43 123 125.84 102.31 102.43 ± 0.95 121 125.17 103.44 122 123.89 101.55 Total Average (%) ± SD = 101.3329 ± 0.9880 SE = 0.5704 % RSD = 0.9758
SD = Standard deviation RSD = Relative standard deviation
SE = Standard Error TableV: Precision of Candesartan Cilexetil Concentration (ppm)
50 100 150
Repeatability (Intra-assay precision) Average area SE % RSD (mAU)a ± SD 50.23 ± 0.72 0.42 1.45 91.51 ± 1.33 0.77 1.45 135.91 ± 2.56 1.48 1.88
Inter-day precision Average area (mAU)b ± SD 50.78 ± 0.63 92.096 ± 0.53 134.02 ± 1.63
SE
% RSD
0.36 0.30 0.94
1.25 0.58 1.22
SD = Standard deviation RSD = Relative standard deviation SE = Standard Error a Average of triplicate determinations b Average of triplicate determinations in three different days
Table VI: Precision of Chlorthalidone Concentration (ppm)
50 100 150
Repeatability (Intra-assay precision) Average area (mAU)a ± SD 63.86±0.79 117.72±2.52 165.69±2.98
Inter-day precision
SE
% RSD
0.45 1.45 1.72
1.24 2.14 1.80
SD = Standard deviation RSD = Relative standard deviation SE = Standard Error a Average of triplicate determinations b Average of triplicate determinations in three different days
Average area (mAU)b ± SD 64.94±0.96 118.70±1.16 163.70±1.79
SE
% RSD
0.55 0.67 1.03
1.48 0.97 1.09
Table VII: Robustness (Placket-Burman Design)
Trial No.
Flow rate (mL/min)
12 4 8 11 2 6 3 9 5 10 7 1
0.45 0.55 0.45 0.45 0.55 0.55 0.45 0.45 0.55 0.55 0.45 0.55
Buffer strength (mM) 4.5 4.5 4.5 5.5 5.5 5.5 5.5 4.5 5.5 4.5 5.5 4.5
pH 5.8 6.4 6.4 5.8 5.8 6.4 6.4 5.8 5.8 5.8 6.4 6.4
Column Temp (oC) 25 35 35 25 35 25 25 35 35 25 35 25
Resolution 2.6 2.51 2.51 2.6 2.53 2.52 2.57 2.61 2.54 2.6 2.56 2.55
Asymmetry Candesartan ChlorCilexetil thalidone 1.1 1.03 1.07 1.04 1.07 1.04 1.1 1.03 1.07 1.06 1.1 1.02 1.08 1.05 1.09 1.04 1.08 1.05 1.09 1.03 1.06 1.04 1.07 1.06
Retention time Candesartan ChlorCilexetil thalidone 4.86 4.43 4.86 4.43 4.71 4.42 4.86 4.43 4.72 4.43 4.86 4.42 4.86 4.43 4.72 4.43 4.86 4.42 4.86 4.43 4.85 4.42 4.85 4.43
Table VIII: System suitability of proposed method Parameters Theoretical Platesa Asymmetrya RSDa (%) Resolutiona
Candesartan Cilexetil 11862 1.09 1.83
Chlorthalidone 13381 1.032 1.65 2.618
RSD = Relative standard deviation a Average of replicate determinations.
Table IX: Assay of Candesartan Cilexetil and Chlorthalidone in bulk drug Assay (Bulk Drug) S. No. 1 2 3
Assay (%) 101.01 102.3 101.5
Chlorthalidone Average (%) ± SD
% RSD
101.60 ± 0.65
0.64
SD = Standard deviation RSD = Relative standard deviation
Candesartan Cilexetil Assay (%) Average (%) ± SD 98.34 98.33 ± 1.30 100.76 100.4
% RSD 1.30
Table X: Assay of Candesartan Cilexetil and Chlorthalidone in Tablet dosage form Assay (Tablet dosage form) S. No.
1 2 3
Labeled Claim(mg) 12.5 12.5 12.5
Chlorthalidone Tablets Obtained % Average Claim(mg) Claim Assay (%) 12.55 100.4 12.6 100.8 99.01 ± 2.7 11.98 95.84
% RSD
2.78
Labeled Claim(mg) 8 8 8
Candesartan Cilexetil Tablets Obtained % Average Claim(mg) Claim Assay (%) 8.1 101.25 100.29 ± 7.92 99 1.16 8.05 100.62
% RSD
1.15
LIST OF FIGURES
Fig. 1: Chromatogram of Candesartan Cilexetil (Rt = 4.38 minutes) and Chlorthalidone (Rt = 4.71 minutes)
Fig. 2: Chromatogram obtained of acid stressed sample solution
Fig. 3: Chromatogram obtained of base stressed sample solution
Fig. 4: Chromatogram obtained of oxidative stressed sample solution
Fig. 5: Chromatogram obtained of thermal stressed sample solution
Fig. 6: Chromatogram obtained of photolytic stressed sample solution
(a)
(b)
Fig. 7: Normal probability plot of Candesartan Cilexetil (a) Normal probability plot of asymmetry of Candesartan Cilexetil (b) Normal probability plot of retention time of Candesartan Cilexetil
(a)
(b)
Fig. 8: Normal probabability plots of Chlorthalidone (a) Normal probability plot of asymmetry of Chlorthalidone (b) Normal probability plot of retention time of Chlorthalidone
Fig. 9: Normal probability plot of resolution of Candesartan Cilexetil and Chlorthalidone
Fig. 10: Desirability plot of proposed analytical method