Hindawi Publishing Corporation International Journal of Spectroscopy Volume 2014, Article ID 873819, 6 pages http://dx.doi.org/10.1155/2014/873819
Research Article Development and Validation of Spectrophotometric Methods for Simultaneous Estimation of Valsartan and Hydrochlorothiazide in Tablet Dosage Form Monika L. Jadhav,1 Manoj V. Girase,1 Shripad K. Tidme,2 and Manish S. Junagade2 1 2
R. C. Patel Institute of Pharmaceutical Education and Research, Shirpur, Dhule District 425405, India MGV’s College of Pharmacy, Panchavati, Nashik 422003, India
Correspondence should be addressed to Monika L. Jadhav;
[email protected] Received 28 June 2013; Revised 28 September 2013; Accepted 30 September 2013; Published 9 January 2014 Academic Editor: Adam P. Wax Copyright © 2014 Monika L. Jadhav et al. This is an open access article distributed under the Creative Commons Attribution License, which permits unrestricted use, distribution, and reproduction in any medium, provided the original work is properly cited. Two UV-spectrophotometric methods have been developed and validated for simultaneous estimation of valsartan and hydrochlorothiazide in a tablet dosage form. The first method employed solving of simultaneous equations based on the measurement of absorbance at two wavelengths, 249.4 nm and 272.6 nm, 𝜆 max for valsartan and hydrochlorothiazide, respectively. The second method was absorbance ratio method, which involves formation of Q-absorbance equation at 258.4 nm (isoabsorptive point) and also at 272.6 nm (𝜆 max of hydrochlorothiazide). The methods were found to be linear between the range of 5–30 𝜇g/mL for valsartan and 4–24 𝜇g/mL for hydrochlorothiazide using 0.1 N NaOH as solvent. The mean percentage recovery was found to be 100.20% and 100.19% for the simultaneous equation method and 98.56% and 97.96% for the absorbance ratio method, for valsartan and hydrochlorothiazide, respectively, at three different levels of standard additions. The precision (intraday, interday) of methods was found within limits (RSD < 2%). It could be concluded from the results obtained in the present investigation that the two methods for simultaneous estimation of valsartan and hydrochlorothiazide in tablet dosage form are simple, rapid, accurate, precise and economical and can be used, successfully, in the quality control of pharmaceutical formulations and other routine laboratory analysis.
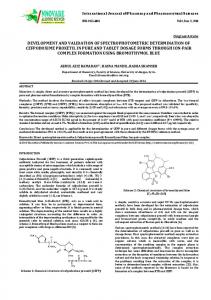
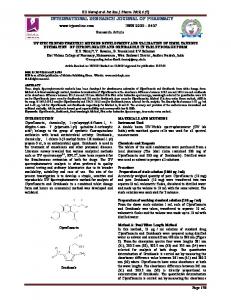
1. Introduction Valsartan (VAL) (Figure 1), a nonpeptide, is N-(1-oxopentyl)N-[[2 -(1H-tetrazol-5-yl) [1,1 -biphenyl]-4-yl] methyl]-L-valine [1]. It is a potent, highly selective, orally active, specific angiotensin II receptor antagonist used as a hypotensive drug. Hydrochlorothiazide (HCT) (Figure 2) is 6-chloro-3,4dihydro-2H-1,2,4-benzothiadiazine-7-sulphon-amide,1,1-dioxide, which is a diuretic drug [2]. In patients with moderate hypertension, first-line therapy with the fixed-dose of valsartan/hydrochlorothiazide combination leads to BP normalization with high response rates. The rationale behind this drug combination is that in treatment of hypertension in patients whose blood pressure is not adequately controlled by monotherapy, oral administration of valsartan with
hydrochlorothiazide has been found more effective than the use of either drug alone [3, 4]. Very few methods for determination of valsartan and hydrochlorothiazide in tablet dosage form have appeared in the literature. A liquid chromatography/tandem mass spectrometry method includes protein precipitation using acetonitrile and the analytes were separated on a Zorbax SB-Aq C18 column using acetonitrile −10 mM ammonium acetate (60 : 40, v/v, pH 4.5) as mobile phase [5]. Another literature stated tablet formulation and development of validated stability indicating HPLC method [6] and HPLC method for simultaneous determination of amlodipine, valsartan, and hydrochlorothiazide in dosage form and spiked human plasma [7]. There are some methods for simultaneous estimation of both drugs using HPTLC [8, 9] and ion pair
2
International Journal of Spectroscopy O
4.261 4.000
OH HN N
N Absorbance
N
H
N
O
249.4 nm (𝜆 max of VAL)
3.000
272.6 nm (𝜆 max of HCT)
2.000
258.4 nm (isoabsorptive point)
1.000 0.000 −0.388 200.00
Figure 1: Structure of VAL.
H2 N O
Cl
H N
S
S O
O
250.00
300.00
350.00
400.00
(nm)
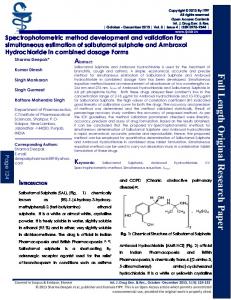
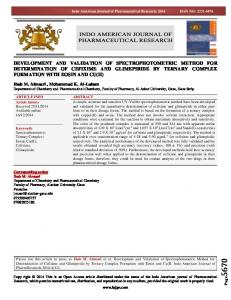
Figure 3: Overlay spectra of VAL and HCT. NH
O
Figure 2: Structure of HCT.
chromatography [10]. Some UV spectroscopic techniques are also reported in which simultaneous method, AUC method, and first derivative method were developed [11–16]. Simultaneous estimation of drug combination is generally done by separation using chromatographic methods like HPLC, GC and HPTLC, and so forth. These methods are accurate and precise with good reproducibility, but the cost of analysis is quite high owing to expensive instrumentation, reagent, and expertise. Hence it is worthwhile to develop simpler and cost effective method for simultaneous estimation of drugs for routine analysis of formulation. Spectrophotometric analysis fulfils such requirement where the simultaneous estimation of the drug combination can be done with similar effectiveness as that of chromatographic methods [17]. Another advantage of proposed methods is that 0.1 N sodium hydroxide was used as a solvent which is very economical as compared to methanol. The purpose of this research was to establish such a method and, after validation in accordance with International Conference on Harmonization (ICH) guidelines [18] and the directives for good laboratory practice, to use the method for analysis of the drug content of tablets. The present work describes two spectrophotometric methods for estimation of valsartan with hydrochlorothiazide in combination which are simultaneous equation method (method 1) and absorbance ratio method (method 2).
2. Materials and Methods 2.1. Instrument. A double-beam Shimadzu UV-Visible spectrophotometer, with spectral bandwidth of 1 nm, wavelength accuracy ±0.5 nm, Model-UV 2450 PC (Japan), SoftwareUV-Probe, and a pair of 1 cm matched quartz cells, was used to measure absorbance of the resulting solution.
2.2. Materials. Standard gift sample of Valsartan was provided by Lupin Pharmaceuticals Ltd, Pune, and Hydrochlorothiazide by Jubilant Organosys Ltd., (Mysore), India. The marketed preparation VALENT-H containing Valsartan 80 mg, Hydrochlorothiazide 12.5 mg manufactured by Lupin Pharmaceuticals Pvt Ltd. (J & K), India, was used for analysis. Sodium hydroxide was procured from S.D Fine chem. Ltd, India, which was used as a solvent for both methods. 2.3. Selection of an Appropriate Solvent System. Various solvent systems like distilled water, 0.1 N HCl, 0.1 N NaOH, and methanol were tried to select an appropriate solvent with good suitability and stability. A solvent system, 0.1 N NaOH, was selected for the determination of valsartan and hydrochlorothiazide, since both drugs were soluble in 0.1 N NaOH. 2.4. Preparation of Stock Standard Solutions. Stock standard solution of valsartan (1000 𝜇g/mL) was prepared by dissolving 10 mg valsartan in 10 mL of 0.1 N NaOH in 10 mL volumetric flask with vigorous shaking. From this stock standard solution, 1 mL was withdrawn and diluted to 10 mL using solvent to get working solution of 100 𝜇g/mL. Similarly, stock standard solution of hydrochlorothiazide (1000 𝜇g/mL) was prepared by dissolving 10 mg hydrochlorothiazide in 10 mL of 0.1 N NaOH in 10 mL volumetric flask with vigorous shaking. This solution was further diluted to get working solution of 100 𝜇g/mL. 2.5. Selection of Analytical Wavelengths. For selection of analytical wavelengths, working solutions of both the drugs were scanned separately between 400 nm and 200 nm. The overlay spectra of both drugs were recorded (Figure 3). From overlay spectra, wavelengths 249.4 nm (𝜆 max of VAL) and 272.6 nm (𝜆 max of HCT) were selected for analysis of both drugs using simultaneous equation method. Also, wavelengths 258.4 nm (isoabsorptivity point) and 272.6 nm (𝜆 max of HCT) were selected for analysis of both drugs using absorbance ratio method.
International Journal of Spectroscopy
3
Table 1: Application of proposed method for standard mixture. Name of drug
% Amount found (𝑛 = 6) Method 1 Method 2 100.84 99.68 101.42 100.88
Amount taken (mg)
VAL HCT
80 12.5
2.6. Linearity Study. The linear absorbances were obtained in the concentration range 5–30 𝜇g/mL for VAL and 4– 24 𝜇g/mL for HCT. Absorbances of these solutions were measured at 249.4 nm and 272.6 nm, for method 1, and at 258.4 nm and 272.6 nm, for method 2. Calibration curve was constructed by plotting absorbance versus concentration. But the tablet ratio was 80 : 12.5, that is, 6.4 : 1 for VAL and HCT. Thus, for method development the concentration range selected for VAL was 12.8–76.8 𝜇g/mL and for HCT was 2– 12 𝜇g/mL according to tablet ratio for both methods.
% RSD Method 1 0.29 0.30
Method 2 0.96 0.42
at 258.4 nm and 272.6 nm, respectively. 𝐶VAL and 𝐶HCT are concentrations of VAL and HCT in mixture. Concentration 𝐶VAL and 𝐶HCT can be obtained as follows:
𝐶VAL = 𝐶HCT
𝑄𝑀 − 𝑄𝑌 𝐴 1 ⋅ , 𝑄𝑋 − 𝑄𝑌 𝑎𝑥1 𝐴 = 1 − 𝐶VAL . 𝑎𝑥1
(5)
2.7. Method 1: Simultaneous Equation Method 2.7.1. Determination of 𝐴 (1%, 1 cm) Values of Drugs at Selected Wavelengths. 𝐴 (1%, 1 cm) values of drugs were calculated using the following formula: 𝐴 (1%, 1 cm) =
Absorbance . Concentration (g/100 mL)
(1)
A set of two simultaneous equations were framed using these 𝐴 (1%, 1 cm) values which are given below: 𝐶VAL = 𝐴 2 𝑎𝑦1 − 𝐶HCT
𝐴 1 𝑎𝑦2 − 𝑎𝑥1 𝑎𝑦2 , 𝑎𝑥2 𝑎𝑦1
𝐴 𝑎𝑥 = 𝐴 1 𝑎𝑥2 − 2 1 − 𝑎𝑥1 𝑎𝑦2 , 𝑎𝑥2 𝑎𝑦1
(2)
where 𝐴 1 and 𝐴 2 are absorbance of mixture at 249.4 nm and 272.6 nm; 𝑎𝑥1 and 𝑎𝑥2 , 𝐴 (1%, 1 cm) of VAL at 249.4 nm and 272.6 nm, respectively; and 𝑎𝑦1 and 𝑎𝑦2 , 𝐴 (1%, 1 cm) of HCT at 249.4 nm and 272.6 nm, respectively. 𝐶VAL and 𝐶HCT are concentrations of VAL and HCT in mixture. By rearranging (2),concentration 𝐶VAL and 𝐶HCT can be obtained as follows: 𝐶VAL = 𝐶HCT
𝐴 2 × 297.3 − 𝐴 1 × 588.7 , −150753.36
(3)
𝐴 × 144 − 𝐴 2 × 328.8 = 1 . −150753.36
2.8. Method 2: Absorbance Ratio Method. A set of equations for absorbance ratio method were framed using these 𝐴 (1%, 1 cm) values which are given below: 𝑄𝑥 =
𝑎𝑥2 , 𝑎𝑥1
𝑄𝑌 =
𝑎𝑦2 , 𝑎𝑦1
𝑄𝑀 =
𝐴2 , 𝐴1
(4)
where 𝐴 1 and 𝐴 2 are absorbance of mixture at 258.4 nm and 272.6 nm; 𝑎𝑥1 and 𝑎𝑥2 , 𝐴 (1%, 1 cm) of VAL at 258.4 nm and 272.6 nm, respectively; and 𝑎𝑦1 and 𝑎𝑦2 , 𝐴 (1%, 1 cm) of HCT
2.9. Application of Proposed Methods for Standard Mixture. Standard mixture of VAL and HCT was prepared by weighing 80 mg of VAL and 12.5 mg of HCT in 10 mL of volumetric flask. 5 mL of 0.1 N NaOH was added to the volumetric flask and both drugs were dissolved completely. Finally, volume was adjusted up to the mark with 0.1 N NaOH to get the concentration of 8000 𝜇g/mL of VAL and 1250 𝜇g/mL of HCT. Appropriate volume 0.1 mL was transferred to 10 mL of volumetric flask and diluted up to mark with the same solvent to obtain strength 80 and 12.5 𝜇g/mL of VAL and HCT, respectively; the solutions were scanned in the range 400–200 nm, and absorbances of the sample solutions were recorded at 249.4 nm and 272.6 nm, that is, 𝐴 1 and 𝐴 2 , respectively, for method 1. The concentrations of the two drugs in sample solution (𝐶VAL and 𝐶HCT ) were determined, by using (3). For method 2, absorbances of the sample solutions were recorded at 258.4 nm and 272.6 nm, that is, 𝐴 1 and 𝐴 2 , respectively. The concentrations of the two drugs in sample solution (𝐶VAL and 𝐶HCT ) were determined, by using (5). Results are shown in Table 1.
2.10. Application of Proposed Method for Analysis of Tablets. Twenty tablets were weighed, average weight determined, and finely powdered. A quantity of powder sample equivalent to 80 mg of VAL and 12.5 mg of HCT was transferred into 10 mL volumetric flask containing 0.1 N NaOH, sonicated for 20 min; volume was adjusted to mark with same solvent and filtered through Whatmann filter paper no. 41. The resulting solution was further diluted to get concentration 80 𝜇g/mL of VAL and 12.5 𝜇g/mL of HCT. Prepared solution was scanned within 400 to 200 nm, and absorbance of sample solution at selected wavelengths was recorded against blank. For method 1, the concentrations of the two drugs in sample solutions (𝐶VAL and 𝐶HCT ) were determined, using (3). For method 2, the concentrations of the two drugs in sample solutions (𝐶VAL and 𝐶HCT ) were determined, using (5). The results of the same are reported in Table 2.
4
International Journal of Spectroscopy Table 2: Application of proposed method for analysis of tablets.
Tablet sample
% Label claim (𝑛 = 6) Method 1 Method 2 98.75 98.29 101.50 99.12
Label claim (mg/tab)
VAL HCT
80 12.5
% RSD Method 1 1.20 0.29
Method 2 0.54 0.68
Table 3: Results of recovery studies. Recovery level
Initial amount (𝜇g/mL) VAL
80% 100% 120%
20 20 20
HCT 2.5 2.5 2.5 Mean
Method 2
HCT
VAL
HCT
VAL
HCT
16 20 24
1.6 2.0 2.4
98.89 100.98 100.73 100.20
100.55 99.83 100.19 100.19
99.51 100.8 101.0 100.40
99.63 99.76 100.3 100.20
The method was validated in terms of linearity, accuracy, precision, specificity LOD, LOQ, ruggedness, and robustness. 3.1. Accuracy. Accuracy of the method was assessed by percentage recovery experiments performed at three different levels, that is, 80, 100, and 120%. Known amounts of standard VAL and HCT solutions were added to the preanalyzed sample solutions; absorbances were recorded and reanalyzed by proposed method. The % recovery was calculated by using 𝐴−𝐵 × 100, 𝐶
Method 1
VAL
3. Validation of Proposed Methods
% Recovery =
% Recovery (𝑛 = 3)
Concentration of std drug added (𝜇g/mL)
(6)
where 𝐴 = total amount of drug estimated, 𝐵 = amount of drug found on preanalyzed basis, and 𝐶 = amount of bulk drug added. Results of recovery studies are shown in Table 3. 3.2. Precision. Precision is the measure of how close the data values are to each other for a number of measurements under the same analytical conditions. 3.2.1. Intraday and Interday Precision. Intraday and interday variations were determined by analyzing three different solutions of VAL and HCT within the same day and three different days over a period of week. Intraday precision was determined by analyzing 38.4 𝜇g/mL, 51.2 𝜇g/mL, and 64 𝜇g/mL for VAL and 6 𝜇g/mL, 8 𝜇g/mL, and 10 𝜇g/mL HCT for three times within the same day. Interday precision was determined by analyzing the above mentioned concentrations of both the drugs for three different days over a period of week. The results are shown in Table 4. 3.3. Specificity. The interference of other excipients was evaluated. 10 𝜇g/mL of microcrystalline cellulose and starch were added separately to standard solutions 64 𝜇g/mL of
VAL and 10 𝜇g/mL of HCT using the same experimental and environmental conditions. 3.4. Ruggedness. Ruggedness of the method was proved by analyzing the standard solutions 64 𝜇g/mL of VAL and 10 𝜇g/mL of HCT by two different analysts using the same experimental and environmental conditions. 3.5. Robustness. Robustness of the method was proved by analyzing the standard solutions 64 𝜇g/mL of VAL and 10 𝜇g/mL of HCT by two different solvents using the same experimental and environmental conditions.
4. Results and Discussions 4.1. Method 1. Analytical method has been developed for simultaneous estimation of VAL and HCT in combined pharmaceutical dosage form using simultaneous equation. In 0.1 N NaOH, VAL showed maximum absorbance at 249.4 nm and HCT at 272.6 nm. Linearity was observed in the range 5– 30 𝜇g/mL (𝑅2 = 0.998) of VAL and 2–16 𝜇g/mL (𝑅2 = 0.998) of HCT. The proposed method was applied for pharmaceutical formulation, and % label claim of VAL and HCT was found to be 98.75 and 101.50, respectively. The amount of drug estimated by proposed method was in good agreement with the label claim. Accuracy of the method was checked by the recovery studies at three different levels, that is, 80%, 100%, and 120%. The mean % recovery for VAL and HCT was found to be 100.20 and 100.19, respectively. The method was found to be precise as indicated by the interday and intraday analysis, showing that % R.S.D. is less than 2. The results did not show any statistical difference between operators suggesting that method developed was rugged. Also, there was no any statistical difference between various strengths of solvents suggesting that method was robust. The sensitivity of method was assessed by determining LOD and LOQ. For VAL, LOD and LOQ were found to be 1.60 and 4.87 𝜇g/mL, respectively. For HCT, the LOD and LOQ were found to be 0.37 and 1.12 𝜇g/mL, respectively.
International Journal of Spectroscopy
5 Table 4: Results of intraday and interday precision.
Drug
VAL
HCT
Intra-day (𝑛 = 3) % RSD
Amount taken (𝜇g/mL)
Inter-day (𝑛 = 3) % RSD
Method 1
Method 2
Method 1
Method 2
38.4 51.2 64 Mean
0.368 0.358 0.276 0.334
1.589 0.760 1.076 1.143
1.122 0.879 0.793 1.143
1.055 0.908 0.799 0.920
6 8 10 Mean
1.439 1.674 0.970 1.361
1.085 1.059 0.987 1.044
1.722 1.227 1.256 1.044
1.376 1.360 0.895 1.210
Table 5: Summary of validation parameters. Methods 𝜆 max Linearity range (𝜇g/mL) Regression equation Slope (m) 𝑌 – intercept (𝑐) Correlation coefficient (𝑟2 ) % recovery (𝑛 = 3) LOD (𝜇g/mL) LOQ (𝜇g/mL) Molar absorptivity (lit/mole/cm) Sandell’s sensitivity (𝜇g/sqcm/0.001) Standard error Precision (% RSD) Intra- day (𝑛 = 3) Inter-day (𝑛 = 3) Specificity (% RSD) Addition of MCC Addition of starch Ruggedness (% RSD) Analyst I (𝑛 = 3) Analyst II (𝑛 = 3) Robustness (% RSD) 0.2 N NaOH (𝑛 = 3) 0.5 N NaOH (𝑛 = 3)
Method 1
Method 2
VAL 249.4 nm 12.8–76.8
HCT 272.6 nm 2–12
VAL 258.4 nm 12.8–76.8
HCT 272.6 nm 2–12
𝑌 = 0.150𝑥 + 0.081 0.150 0.081 0.998 100.20 1.60 4.87 14894.78 0.02924 1.196 × 10⁻³
𝑌 = 0.181𝑥 + 0.079 0.181 0.079 0.998 100.19 0.37 1.12 16613.89 0.01793 2.468 × 10⁻³
𝑌 = 0.0269𝑋 + 0.064 0.0269 0.064 0.999 100.40 1.60 4.86 12242.19 0.03558 0.8381 × 10⁻³
𝑌 = 0.0542𝑋 + 0.013 0.0542 0.013 0.999 100.20 0.32 0.97 16643.66 0.01789 2.8324 × 10⁻³
0.334 0.931
1.361 1.402
1.143 0.920
1.044 1.210
1.6 0.5
1.8 0.8
0.9 0.3
1.2 0.7
0.5 1.2
0.6 1.1
0.2 1.1
0.5 0.9
0.8 0.5
1.2 1.3
1.6 0.8
1.5 1.2
4.2. Method 2. Analytical method has been developed for simultaneous estimation of VAL and HCT in combined pharmaceutical dosage form using absorbance ratio method. In 0.1 N NaOH, wavelengths 258.4 nm (isoabsorptivity point) and 272.6 nm (𝜆 max of HCT) were selected for analysis of both drugs using absorbance ratio method. Linearity was observed in the range 5–30 𝜇g/mL (𝑅2 = 0.999) of VAL and 2–16 𝜇g/mL (𝑅2 = 0.999) of HCT. The proposed method was applied for pharmaceutical formulation, and % label claim of
VAL and HCT was found to be 98.29 and 99.12, respectively. The amount of drug estimated by proposed method was in good agreement with the label claim. Accuracy of the method was checked by the recovery studies at three different levels, that is, 80%, 100%, and 120%. The mean % recovery for VAL and HCT was found to be 100.40 and 100.20, respectively. The method was found to be precise as indicated by the interday and intraday analysis, showing that % R.S.D. is less than 2. The results did not show any statistical difference between
6 operators suggesting that method developed was rugged. Also, there was not any statistical difference between various strengths of solvents suggesting that method was robust. The sensitivity of method was assessed by determining LOD, and LOQ. For VAL, LOD and LOQ was found to be 1.60 and 4.86 𝜇g/mL, respectively. For HCT, the LOD and LOQ was found to be 0.32 and 0.97 𝜇g/mL, respectively. The summary of validation parameters is presented in Table 5.
International Journal of Spectroscopy
[8]
[9]
5. Conclusion The proposed spectrophotometric methods were found to be simple, sensitive, accurate, precise, reproducible, specific, robust, and economical and can be used for the routine simultaneous estimation of VAL and HCT in pharmaceutical formulations.
[10]
[11]
Conflict of Interests There are no competing interests amongst the authors. The authors declare that there is no conflict of interests.
[12]
Acknowledgment The authors are thankful to Lupin Pharmaceuticals Pvt. Ltd. (Pune) and Jubilant Organosys Ltd. (Mysore) for providing the gift samples of VAL and HCT and MGV’s College of Pharmacy, Panchavati, Nashik, for providing all the facilities to carry out the research work.
[13]
[14]
References [1] Indian Pharmacopoeia, Government of India, Ministry of Health and Family Welfare, vol. 3, The Indian Pharmacopoeia Commission, Ghaziabad, India, 6th edition, 2010. [2] Indian Pharmacopoeia, Government of India, Ministry of Health and Family Welfare, vol. 2, The Indian Pharmacopoeia Commission, Ghaziabad, India, 6th edition, 2010. [3] K. Wellington and D. M. Faulds, “Valsartan/hydrochlorothiazide: a review of its pharmacology, therapeutic efficacy and place in the management of hypertension,” Drugs, vol. 62, no. 13, pp. 1983–2005, 2002. [4] R. Kondrack and S. Mohiuddin, “Valsartan/hydrochlorothiazide: pharmacology and clinical efficacy,” Expert Opinion on Drug Metabolism and Toxicology, vol. 5, no. 9, pp. 1125–1134, 2009. [5] H. Li, Y. Wang, Y. Jiang et al., “A liquid chromatography/tandem mass spectrometry method for the simultaneous quantification of valsartan and hydrochlorothiazide in human plasma,” Journal of Chromatography B, vol. 852, no. 1-2, pp. 436–442, 2007. [6] M. Kharoaf, N. Malkieh, M. Abualhasan, R. Shubitah, N. Jaradat, and A. N. Zaid, “Tablet formulation and development of a validated stability indicating HPLC method for quantification of valsartan and hydrochlorthiazide combination,” International Journal of Pharmacy & Pharmaceutical Sciences, vol. 4, no. 3, pp. 284–290, 2012. [7] S. M. El-Gizawy, O. H. Abdelmageed, M. A. Omar, S. M. Deryea, and A. M. Abdel-Megied, “Development and validation of
[15]
[16]
[17]
[18]
HPLC method for simultaneous determination of amlodipine, valsartan, hydrochlorothiazide in dosage form and ppiked human plasma,” American Journal Analytical Chemistry, vol. 3, pp. 422–430, 2012. B. R. Kadam and S. B. Bari, “Quantitative analysis of valsartan and hydrochlorothiazide in tablets by high performance thinlayer chromatography with ultraviolet absorption densitometry,” Acta Chromatographica, no. 18, pp. 260–269, 2007. N. J. Shah, B. N. Suhagia, R. R. Shah, and N. M. Patel, “HPTLC method for the simultaneous estimation of valsartan and hydrochlorothiazide in tablet dosage form,” Indian Journal of Pharmaceutical Sciences, vol. 71, no. 1, pp. 72–74, 2009. N. M. Bhatia, M. S. Bhatia, P. B. Choudhari, and K. B. Ingale, “Development and validation of spectrophotometric and ion pair chromatographic technique for estimation of valsartan and hydrochlorothiazide,” Journal of Pharmaceutical Research and Health Care, vol. 2, no. 1, pp. 2–14, 2010. M. M. Deshpande, M. P. Ahajan, and S. D. Sawant, “Simultaneous estimation of valsartan and hydrochlorothiazide in fixed dose combination in UV spectrophotometry,” International Journal of Pharmaceutical Sciences, vol. 3, no. 1, pp. 235–240, 2012. A. B. Chaudhary, R. K. Patel, S. A. Chaudhary, and K. V. Gadhvi, “Estimation of valsartan and hydrochlorothiazide in Pharmaceutical dosage forms by absorption ratio method,” International Journal of Applied Biology and Pharmaceutical Technology, vol. 1, no. 2, pp. 455–464, 2010. E. atana, A. Altınay, N. Gunden, S. A. Ozkan, and Z. Enturk, “Simultaneous determination of valsartan and hydrochlorothiazide in tablets by first-derivative UV spectrophotometry and LC,” Journal of Pharmaceutical and Biomedical Analysis, vol. 25, no. 5-6, pp. 1009–1013, 2001. N. Erk, “Spectrophotometric analysis of valsartan and hydrochlorothiazide,” Analytical Letters, vol. 35, no. 2, pp. 283–302, 2002. R. G. Varsha, K. G. Baheti, S. Indraksha, and M. H. Dehghan, “Estimation of amlodipine besylate, valsartan and hydrochlorothiazide in bulk mixture and tablet by UV spectrophotometry,” Indian Journal of Pharmaceutical Sciences, vol. 74, no. 1, pp. 18–23, 2012. V. K. Redasani, P. V. Patel, and S. J. Surana, “Spectrophotometric method for simultaneous estimation of valsartan and hydrochlorothiazide in combined tablet dosage form,” Der Pharmacia Sinica, vol. 2, no. 3, pp. 123–130, 2011. R. B. Patel and M. R. Patel, “An introduction to analytical method development for pharmaceutical formulations,” Pharmaceutical Information, vol. 6, no. 4, 2008. “ICH: Harmonized Tripartite Guideline, Validation of Analytical Procedures: Text and Methodology Q2 (R1),” 2005.
International Journal of
Medicinal Chemistry Hindawi Publishing Corporation http://www.hindawi.com
Volume 2014
Photoenergy International Journal of
Organic Chemistry International Hindawi Publishing Corporation http://www.hindawi.com
Volume 2014
Hindawi Publishing Corporation http://www.hindawi.com
Volume 2014
International Journal of
Analytical Chemistry Hindawi Publishing Corporation http://www.hindawi.com
Volume 2014
Advances in
Physical Chemistry Hindawi Publishing Corporation http://www.hindawi.com
Volume 2014
International Journal of
Carbohydrate Chemistry Hindawi Publishing Corporation http://www.hindawi.com
Journal of
Quantum Chemistry Hindawi Publishing Corporation http://www.hindawi.com
Volume 2014
Volume 2014
Submit your manuscripts at http://www.hindawi.com Journal of
The Scientific World Journal Hindawi Publishing Corporation http://www.hindawi.com
Journal of
International Journal of
Inorganic Chemistry Volume 2014
Journal of
Theoretical Chemistry
Hindawi Publishing Corporation http://www.hindawi.com
Hindawi Publishing Corporation http://www.hindawi.com
Volume 2014
Spectroscopy Hindawi Publishing Corporation http://www.hindawi.com
Analytical Methods in Chemistry
Volume 2014
Hindawi Publishing Corporation http://www.hindawi.com
Volume 2014
Chromatography Research International Hindawi Publishing Corporation http://www.hindawi.com
Volume 2014
International Journal of
Electrochemistry Hindawi Publishing Corporation http://www.hindawi.com
Volume 2014
Journal of
Hindawi Publishing Corporation http://www.hindawi.com
Volume 2014
Journal of
Catalysts Hindawi Publishing Corporation http://www.hindawi.com
Journal of
Applied Chemistry
Hindawi Publishing Corporation http://www.hindawi.com
Bioinorganic Chemistry and Applications Hindawi Publishing Corporation http://www.hindawi.com
Volume 2014
International Journal of
Chemistry Volume 2014
Volume 2014
Spectroscopy Volume 2014
Hindawi Publishing Corporation http://www.hindawi.com
Volume 2014