Malaysian Journal of Library & Information Science, Vol. 17, no. 1, April 2012: 21-39
Development and validation of the Information Seeking Anxiety scale Mohammadamin Erfanmanesh, A. Abrizah and Noor Harun Abdul Karim Department of Library and Information Science, Faculty of Computer Science & Information Technology, University of Malaya, Kuala Lumpur, MALAYSIA e-mail:
[email protected],
[email protected];
[email protected]
ABSTRACT The purpose of the study was to develop and validate the Information Seeking Anxiety Scale. The research took place in several empirical phases. First, a list of ninety-four (94) potential key components was developed by the researchers and was sent to a panel of experts for validation. Then a pilot instrument comprising ninety-three (93) statements was generated according to the list of key components and was validated again for content by the experts. The face validity of the instrument was then evaluated by a group of fifteen (15) postgraduate students. Finally, the psychometric properties of the instrument were tested with a group of four hundred (400) postgraduate students using exploratory factor analysis and Cronbach’s alpha internal reliability coefficient. Consequently a valid and reliable 47-item Information Seeking Anxiety Scale was produced which could be employed in efforts to measure information seeking anxiety among library users. Keywords: Information seeking anxiety; Information Seeking Anxiety Scale; Face validity; Content validity; Construct validity; Internal consistency.
INTRODUCTION Anxiety has always been known as a psychological barrier in educational setting which has caused different cognitive, emotional, and behavioral effects in students. Several forms of academic-related anxiety have been studied, including library anxiety (Mellon 1986; Bostick 1992; Jiao and Onwuegbuzie 1997, 1998, 1999, 2001, 2002, 2004; Jiao, Onwuegbuzie and Bostick 2006; Jiao, Onwuegbuzie and Waytowich 2008), research anxiety (Onwuegbuzie 1997; Higgins 2001; Kracker 2002), computer anxiety (Turkzadeh and Angulo 1992; Maurer 1994; Jerabek, Meyer and Cordinak 2001; Kohrman 2003; Jiao and Onwuegbuzie 2004, Abusin and Zainab 2010), Internet anxiety (Ben Omran 2001), mathematics and statistics anxiety (Bander and Betz 1981; Onwuegbuzie and Wilson 2000), writing anxiety (Hadfield, Martin and Wooden 1992; Onwuegbuzie 1997), and test anxiety (Hill and Wigfield, 1984). However, of all the forms of academic-related anxiety, frustration associated with the search for information in library or electronic resources appear to be among the most prevalent, presumably because virtually most, if not all, students are compelled to find information at some point in their programs of study (Jiao and Onwuegbuzie 2002; Onwuegbuzie and Jiao 2004). Fear and apprehension concerning the information search process has been documented by many researchers (Mellon 1986; Kuhlthau 1988). According to Mellon (1986), “when confronted with the need to gather information in the library … many students become so anxious that they are unable to approach the problem logically or effectively” (p. 163).
Page | 21
Erfanmanesh, M. , Abrizah, A. & Noor Harun Abdul Karim
Kuhlthau (1988, 1993) stated that anxiety is a natural occurrence during the information seeking process which may begin during any one of the six (6) stages of the research process. She found that feelings of anxiety were the highest at the beginning of the search process when students suffer from confusion and lack of certainty. Jiao and Onwuegbuzie have collaborated on a series of studies on library anxiety among academic library users (Jiao and Onwuegbuzie 1997, 1998, 1999; Onwuegbuzie and Jiao 1998, 2000). Van Kampen (2003) conducted a research to determine which aspects of the information search process contributed to the library anxiety phenomenon. According to Young and Von Seggern (2001) frustration and anxiety have been reported to be the most prevalent negative feelings during the information seeking process among undergraduate and postgraduate students. Branch (2001) found that uncertainty, frustration, and anxiety to be the common emotions while seeking information using the CD-ROM encyclopedias among students. Chowdhury and Gibb (2009) identified some sources of uncertainty and anxiety during information seeking process. They found that information seeking anxiety may be triggered and heightened because of some problems associated with information seeking. Hyldegard (2006, 2009) explored Kuhlthau’s Information Search Process (ISP) model in a group-based educational setting and reported existence of anxiety and frustration in the beginning, middle, and the end of the process. Cheng (2004) indicated that negative feelings such as anxiety were indeed important factors involved in students’ information seeking. Loerke (1992) found that high school students engaged in the research process experienced different levels of information seeking anxiety. Kohrman (2003) reported that the phenomenon of information seeking anxiety is more common among postgraduate students, because the intricacy of graduate-level research necessitates extensive use of information resources. However, to date no valid and reliable instrument has been developed to measure levels of information seeking anxiety among students. Those studies which have investigated the information seeking anxiety did not develop a scale to measure this construct. Rather, many of them have included information seeking as a part of general library research and used library anxiety scales. As such, the present study was conducted in order to measure and validate a scale that could be employed to assess anxiety during the information seeking process.
LITERATURE REVIEW An extensive review of the literature on feelings and emotions during the information seeking process was conducted for this study. However, hitherto no scale was ever developed, let alone validated, to assess the anxiety that was experienced by individuals during the information seeking process. Subsequently, this study was conducted to address a gap in the literature by developing and validating the Information Seeking Anxiety Scale. A review of the related research was carried out in an effort to conceptualize and operationalize the information seeking anxiety constructs. Bostick (1992) developed and validated the Library Anxiety Scale. This 43-item 5-point Likert-format instrument has five dimensions, namely, barriers with staff (α=0.90), affective barriers (α=0.80), comfort with the library (α=0.66), knowledge of the library (α=0.62), and mechanical barriers (α=0.60). These factors collectively explained 51.8% of the variation in library anxiety. Further, the internal reliability assessment using Cronbach’s
Page | 22
Development and Validation of the Information Seeking Anxiety Scale
alpha was reported to be at 0.80 for the overall scale. A test-retest further confirmed the overall scale to be internally reliable (α=0.74). This instrument has been utilized extensively in library anxiety studies. Shoham and Mizrachi (2001) developed and validated a modified version of the Library Anxiety Scale (LAS) which was culturally appropriate for Israeli population. The researchers dropped eight (8) out of forty-three (43) statements from Bostick’s LAS to adapt it to the cultural situation of this country. Six hundred and sixty-four (664) undergraduate students from different universities were asked to respond to the 35-item Likert-type questionnaire. Using exploratory factor analysis, Shoham and Mizrachi identified the following seven (7) factors: barriers with staff (α=0.75), Knowledge barriers (α=0.76), language barriers (α=0.76), library physical comfort barriers (α=0.60), library computer comfort barriers (α=0.51), library policies/hours barriers (α=0.45), and library resources barriers (α=0.52). The Kuwaiti-Library Anxiety Scale (K-LAS) was developed and validated by Anwar, AlKandari and Al-Qallaf (2004). The study participants included one hundred and forty-five (145) students of Biological Sciences at the Kuwait University who completed a modified version of the Library Anxiety Scale consisted of thirty-four (34) statements. Exploratory factor analysis was carried out to establish the scale’s construct validity. The factor analysis yielded four (4) factors, which explained 47% of the total variance. The internal reliability coefficients using Cronbach’s alpha for the sub-scales were as follows: staff approachability, 0.90; feelings of approachability, 0.90 and library confidence, 0.78; library constrains, 0.70. The researchers concluded that the Kuwaiti-Library Anxiety Scale (K-LAS) has adequate internal consistency as well as construct validity for assessing Kuwaiti undergraduate student’s levels of library anxiety. Van Kampen (2003) developed and validated a 54-item instrument using the Bostick’s Library Anxiety Scale, called the Multidimensional Library Anxiety Scale (MLAS). Two hundred and ninety-nine (299) doctoral students at an urban south-eastern university completed pilot questionnaires in two (2) phases. An exploratory factor analysis using a varimax procedure was performed to analyze possible patterns between variables. Also, to establish reliability of the scale, a test-retest study was carried out. The factor analysis yielded six (6) components which accounted for 43.39% of the total variance. Six (6) subdimensions were identified as follow: comfort and confidence using the library (α=0.86), information seeking process and general library anxiety (α=0.87), barriers with staff (α=0.73), perceived importance of the library (α=0.79), comfort level with library technologies (α=0.73), and comfort level with library building (α=0.74). The Multidimensional Library Anxiety Scale was reported to have satisfactory internal consistency (α=0.88) for the overall scale. Noor and Ansari (2010) investigated the Bostick’s Library Anxiety Scale (LAS) psychometric properties in a Malaysian university library environment. For this purpose, three hundred and sixty-seven (367) students were given a 49-item modified version of the Library Anxiety Scale. A principal component exploratory factor analysis and an item to total score correlation analysis were performed to demonstrate the validity of the scale. Using these methods, fourteen (14) statements with factor loading less than 0.40 were extracted. Additionally, five (5) factors were identified which explained 39.56% of the total variance. The researchers stated that “with the exception of comfort with library technology subdimension (α=0.67), other four sub-dimensions (barriers with staff, 0.91; comfort with library services, 0.73; affective barriers, 0.70; cognitive barriers, 0.80) as well as the overall scale (α=0.78) were found to have adequate internal consistency” (p.115). Also, in order to
Page | 23
Erfanmanesh, M. , Abrizah, A. & Noor Harun Abdul Karim
increase coefficient alpha value of different sub-scales, five (5) other statements were dropped. Swigon (2011) developed and validated the Polish-Library Anxiety Scale (P-LAS). For this purpose, one hundred (100) participants who included bachelor’s level students, master’s level students, doctoral level students, and faculty members at three (3) Polish universities were studied. Using factor analysis, forty-six (46) statements were grouped into six (6) factors: barriers with staff (5 statements), affective barriers (9 statements), technological barriers (8 statements), library knowledge barriers (10 statements), library comfort barriers (8 statements), and resource barriers (6 statements). The reliability of the sub-scales as reported using Cronbach’s internal reliability coefficient alpha was 0.75, 0.80, 0.73, 0.78, 0.47, and 0.75 respectively. In addition, overall scale was reported to have sufficient internal reliability coefficient with a Cronbach’s alpha value at 0.91. Erfanmanesh (2011) validated the Multidimensional Library Anxiety Scale (MLAS) which was developed by Van Kampen (2003) in an Iranian university. One hundred and twentythree (123) postgraduate students at the Shiraz University completed a translated copy of the questionnaire. The exploratory factor analysis was conducted in order to assess the construct validity of the scale. Also, a test-retest method was used to enhance internal validity of the overall scale. The results of the factor analysis yielded eight (8) sub-scales, namely, barriers with library resources (α=0.81), barriers with library services (α=0.75), barriers with information seeking process (α=0.68), mechanical barriers (α=0.78), barriers with knowledge of the library (α=0.72), barriers with use of library (α=0.75), barriers with library staff (α=0.83), and barriers with library building (α=0.62). Additionally, the resultant alpha coefficient of 0.84 for overall scale supported internal reliability of the scale. In view of these findings, the modified version of Multidimensional Library Anxiety Scale was valid as well as internally reliable for assessing library anxiety among Iranian academic library users.
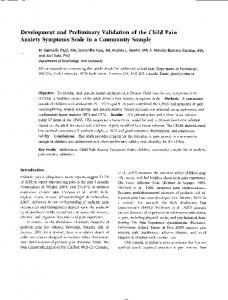
INSTRUMENTATION AND DATA COLLECTION a) Development of the Information Seeking Anxiety Scale The research to develop the Information Seeking Anxiety Scale took place in several empirical phases (Figure 1). The first step involved the development of a list of key components concerning the construct of information seeking anxiety. For this purpose, potential components were gleaned from several sources: a) extensive review of the literature in the areas of library anxiety, computer anxiety, internet anxiety, information anxiety, information seeking process, and other related areas; b) existing instruments in aforementioned constructs; c) interviews with ten (10) postgraduate students to identify what made them anxious when they were seeking information related to their research. Students from a research-intensive university in Kuala Lumpur Malaysia were sampled at this stage. The interviews were recorded using a voice recorder and transcribed to identify possible key components. Comments from the Library and Information Science (LIS) faculty at the university were also solicited in the development of the key components. As a result, a pool of ninety-four (94) key components was formulated by the researchers.
Page | 24
Development and Validation of the Information Seeking Anxiety Scale
Fiqure 1: Procedures of the Development and Validation of the Information Seeking Anxiety Scale
The initial list of key components was sent to a panel of experts for validation. Seventeen (17) panelists in the area of LIS were selected to participate in different stages of the study. The criterion for selection of the expert judges included their publications and dissertation supervision in the area of research. Of the seventeen (17) experts, fourteen (14) are doctoral degree holders who are either faculty members or librarians and three are Masters degree holders. All experts were contacted personally by e-mail and were asked to participate in the study, of which fourteen (14) of them accepted. The list of key components was then sent to them to elicit their expert opinions and comments on those key components. The experts were given two (2) weeks to respond. Responses were received from ten (10) experts out of fourteen (14). Any component that was eliminated by more than one (1) expert was removed from the list. Also, any new component that was suggested by at least one (1) expert was added to the list. Based upon the expert’s comments, sixty-five (65) out of ninety-four (94) components were approved, while
Page | 25
Erfanmanesh, M. , Abrizah, A. & Noor Harun Abdul Karim
twenty-nine (29) components were omitted, five (5) new components were added, and eight (8) components were reworded. As a result, the revised list of key components was developed, which came to a total of seventy (70) items. In the next stage of the study, a list of one hundred and fifty-four (154) statements was created based on the list of seventy (70) key components. All key components were addressed in a minimum of one (1) statement. Care was taken to ensure that each statement was short, simple, clear, and addressed a single issue. The list of statements was submitted again to the same panel of experts for validation. They were given three (3) weeks to respond to the new list of items and return their comments, modifications and suggestions. Responses were received from eight (8) experts out of fourteen (14) which incorporated several changes and modifications. Statements were then edited based on feedback from expert judges. Accordingly, ninety-one (91) statements were retained in the list, sixty-three (63) were removed, and two (2) new statements were added, resulting in a total of ninety-three (93) items. Additionally, twenty-five (25) items were slightly reworded for clarity. Following revisions to the list of statements, a pilot instrument was developed in order to determine its potential validity. The pilot instrument consisted of ninety-three (93) statements, scored on a 5-point Likert-type scale ranging from 1 (strongly disagree) to 5 (strongly agree). The statements were both in positive and negative forms and had at least one (1) statement addressing each key component that identified before. Also, a demographic information form was developed to collect the essential information for this study. The following items of demographic information were collected using this form: age, gender, major, level of study (master or doctorate), year of study, nationality (Malaysian or international), frequency of library use, frequency of internet use, and number of information literacy skill sessions attended. Two (2) steps were performed before the instrument was pilot tested (Procedure 7 in Figure 1). These steps included determination of instrument’s content and face validity. Content validity may be defined as the degree to which elements of an assessment instrument are relevant to and representative of the targeted construct for a particular assessment purpose which is an essential part of generating new instruments (Haynes, Richard and Kabany 1995). The panel of experts was asked again for review of the pilot instrument to determine whether or not the instrument will actually measure what the researchers think it will measure. Seven (7) out of fourteen (14) experts evaluated the content validity of the instrument and confirmed that the statements of the instrument appeared to measure the concept of information seeking anxiety. Additionally, fifteen (15) postgraduate students from different departments at the university were selected to evaluate the face validity of the pilot instrument. Face validity pertains to whether the instrument appears valid to the examinees who take it (Anastasi 1988). The refinement of items based on the perspective of study participants may improve response rates and enhance the validity of the data. Accordingly, after receiving advice concerning the clarity, phrasing, terminology, and readability of the statements from the students, the statements were revised and the pilot instrument was finalized. Overall, student respondents reported that the instrument was easy to understand and that the format was pleasant. Subsequently, the first pilot study was conducted in February 2011 at the university. Participants were one hundred (100) postgraduate students who were selected for the study using convenience sampling method. The instrument was distributed personally by
Page | 26
Development and Validation of the Information Seeking Anxiety Scale
the researchers. The students were informed that their participation was voluntary and that their responses would be used only for the research. They were asked to respond to the pilot instrument which consisted of ninety-three (93) statements and return it to the researcher. This instrument was seven (7) pages long and took about twenty (20) minutes to complete. A cover letter was attached to the questionnaire, which explained the purpose of the study, asked for cooperation, and provided some instruction for completing the questionnaire. Of the one hundred (100) participants, fifty-seven percent (57%) were master students and forty-three percent (43%) were PhD students. Fifty-eight percent (58%) were female and forty-two percent (42%) were male. International students formed the majority of the sample (78%), while Malaysian students comprised twenty-two percent (22%) of the participants. Finally, the participants were from different areas of study included arts, humanities and social sciences (28%), pure sciences (22%), engineering (39%), and medical sciences (11%). Upon completion of the pilot study, the returned questionnaires were reviewed for completeness and usability and were coded for data analyses. Responses from three (3) participants were excluded because they did not complete the entire questionnaire. After that, data were input into Predictive Analysis Software (PASW) for statistical analysis. In an attempt to assess construct validity of the pilot instrument, an exploratory factor analysis was performed. Construct validity is “the extent to which a set of measured variables actually represent the theoretical latent construct they are designed to measure” (Hair et al. 2006). Exploratory factor analysis is most frequently used as a part of the instrument development process. The purpose of the first factor analysis was to identify statements that were not contributing to the explanation of variance in information seeking anxiety construct. Results of running an exploratory factor analysis using principal component and varimax rotation method yielded seven (7) factors which collectively explained 50.82% of the total variance. The first factor accounted for 20.21% of the variance (eigenvalue=18.79), the second factor explained 8.20% of the variance (eigenvalue=7.63), the third factor represented 5.72% of the variance (eigenvalue=5.32), and the fourth factor accounted for 4.98% of the variance (eigenvalue=4.63). Factors five, six, and seven accounted for 4.44%, 4.03%, and 3.22% of the total variance respectively (eigenvalues=4.13, 3.74, and 3.00 respectively). Items with factor loading less than 0.4 were reviewed and re-paraphrased again. The researchers decided to keep all ninety-three (93) statements for the second pilot study. The second pilot study was conducted during March and April 2011 at the same university. Again, the pilot instrument consisted of ninety-three (93) statements was completed by three hundred (300) postgraduate students who were selected using the convenience sampling method. Females made up fifty-nine percent (59%) of the sample with the remaining forty-one percent (41%) respondents being male. Of the participants, sixty-eight percent (68%) were master’s students and thirty-two percent (32%) were doctoral students. The majority of subjects (70%) were international students, while only thirty percent (30%) were Malaysian. Also regarding the students’ area of specialization, twentynine percent (29%) were engineering students and forty-two percent (42%) were from arts, humanities, and social science disciplines. Twenty-four percent (24%) and five percent (5%) of respondents were from the pure sciences and medical sciences, respectively. b) Validation of the Information Seeking Anxiety Scale The returned questionnaires from the second pilot study were reviewed for incomplete or missing information before being entered into PASW for statistical analysis. Thirteen (13) questionnaires were eliminated due to insufficient data, leaving a final sample of two
Page | 27
Erfanmanesh, M. , Abrizah, A. & Noor Harun Abdul Karim
hundred-eighty seven (287). Negatively worded statements were reversed during data input so that all statements were scored in the same direction. The Kaise-Meyer-Olkin (KMO) is a measure of sampling adequacy and varies between zero and one, with values greater than or equal to 0.60 used to indicate a good fit. In this study the value was 0.797, suggesting that there was sampling adequacy. Additionally, significance of the Bartlett’s Test of Sphericity (chi-square=12020.739, df=3828, p