Although numerous new measurements for female sexual dysfunction (FSD) have ... developed, the Female Sexual Function Index (FSFI) remains the gold ...
386
ORIGINAL RESEARCH—OUTCOMES ASSESSMENT Development and Validation of the Polish Version of the Female Sexual Function Index in the Polish Population of Females jsm_12012
386..395
Krzysztof Nowosielski, MD, PhD,*† Beata Wróbel, MD, PhD,‡ Urszula Sioma-Markowska, MSc, PhD,§ and Ryszard Pore˛ba, MD*§ *Department of Gynecology and Obstetrics, Specialist Teaching Hospital in Tychy, Tychy, Poland; †Department of Health Science, Medical Collage in Sosnowiec, Sosnowiec, Poland; ‡Center for Sexual Medicine, Da˛browa Górnicza, Poland; § Department of Gynecology and Obstetrics, The School of Health Care, Medical University of Silesia, Katowice, Tychy, Poland DOI: 10.1111/jsm.12012
ABSTRACT
Introduction. Unlike male sexual function, which is relatively easy to assess, female sexual function is still a diagnostic challenge. Although numerous new measurements for female sexual dysfunction (FSD) have recently been developed, the Female Sexual Function Index (FSFI) remains the gold standard for screening. It has been validated in more than 30 countries. The FSFI has been used in several studies conducted in Poland, but it has never been standardized for Polish women. Aim. The aim of this study was to develop a Polish version of the FSFI (PL-FSFI). Materials and Methods. In total, 189 women aged 18–55 years were included in the study. Eighty-five were diagnosed with FSD as per the Diagnostic and Statistical Manual of Mental Disorders, Fourth Edition, Text Revision (DSM IV-TR) criteria; 104 women did not have FSD. All subjects completed the PL-FSFI at baseline (day 0), day 7, and day 28. Main Outcome Measures. Test–retest reliability was determined by Pearson’s product–moment correlations. Reliability was tested using Cronbach’s a coefficient. Construct validity was evaluated by principal component analysis using varimax rotation and factor analysis. Discriminant validity was assessed with between-groups analysis of variance. Results. All domains of the PL-FSFI demonstrated satisfactory internal consistencies, with Cronbach’s a value of >0.70 for the entire sample. The test–retest reliability demonstrated good-to-excellent agreement between the assessment points. Based on principal component analysis, a 5-factor model was established that explained 83.62% of the total variance. Domain intercorrelations of the PL-FSFI ranged from 0.37–0.77. The optimal PL-FSFI cutoff score was 27.50, with 87.1% sensitivity and 83.1% specificity. Conclusion. The PL-FSFI is a reliable questionnaire with good psychometric and discriminative validity. Therefore, it can be used as a tool for preliminary screening for FSD among Polish women. Nowosielski K, Wróbel B, Sioma-Markowska U, and Pore˛ba R. Development and validation of the Polish version of the Female Sexual Function Index in the Polish Population of Females. J Sex Med 2013;10:386–395. Key Words. Female Sexual Function Index; Polish Version; Validation; Development
Introduction
F
emale sexuality is a complex and multidimensional phenomenon. Many factors, including culture, social context, age, mental health, and interpersonal relations, may influence the sexual
J Sex Med 2013;10:386–395
function of women. Thus, the prevalence of female sexual dysfunction (FSD) varies worldwide between 8–75% [1–6]. The few studies on FSD in Poland have shown that FSD may affect up to 17% of healthy women and up to 42% of the women with diabetes mellitus [7–9]. © 2012 International Society for Sexual Medicine
387
Development of the Polish Version of the FSFI Unlike male sexual function, which is relatively easy to assess, female sexual function is still a diagnostic challenge [10,11]. The current concept of women’s sexual function emphasizes the responsive component of women’s sexuality. Based on the circular model of the sexual response research confirmed that women provide a variety of reasons and incentives for engaging in sexual activity [11]. Thus, many components associated with sexuality, which are integral to a sexual response, must be assessed when counseling women with sexual problems [11]. As observed in other countries, a number of sexual problems are highly prevalent in Poland. However, sexual health here is still unmentionable, and few women seek medical help for FSD. Although numerous new measurements for FSD have recently been developed, the Female Sexual Function Index (FSFI) remains the gold standard for screening [10]. It has been translated and validated in more than 30 countries and is used to assess FSD in women with different medical conditions, including vulvodynia, vulvar intraepithelial neoplasia, hemodialysis, diabetes, breast cancer, obesity, urinary incontinence, depression, and human immunodeficiency virus infection [11–19]. The most recent studies from Japan, Korea, Iran, Taiwan, Malaysia, China, United Kingdom, or the Netherlands have proved its reliability and psychometric validity in the assessment of dimensions of female sexual functioning in clinical and nonclinical samples [12,15–20]. Moreover, the applicability of the FSFI has been confirmed for women in various stages of life, such as pregnancy, postpartum, postmenopausal periods [21,22]. The FSFI has been used in a few studies conducted in Poland [7–9,23– 25], but it has never been validated or standardized for Polish women. Such a validation would help medical professionals screen women for FSD and refer selected individuals for further counseling. Aim
The aim of this study was to develop a Polish version of the FSFI (PL-FSFI) and to examine its psychometric reliability and validity. Main Outcome Measures
Internal consistencies in the PL-FSFI were evaluated by Cronbach’s a coefficient. Intraclass correlation coefficient was used to assess the test–retest reliability. Principal component analysis using varimax rotation was used to evaluate the factor
structure and construct validity. Discriminant validity was assessed with a between-groups analysis of variances (anova). The degree of association between the PL-FSFI scores and marital satisfaction (assessed on a 5-point Likert scale) was calculated by the Pearson product–moment correlation. A receiver operating characteristic analysis was performed to determine the optimal cutoff values of the PL-FSFI.
Methods
Study Population A total of 300 women between the ages of 18–55 years were eligible for this cross-sectional study conducted between June 2011 and February 2012; 150 women had sexual problems and 150 did not. The healthy women were recruited from three gynecological offices in Da˛browa Górnicza, Sosnowiec, and Tychy in Poland when they visited the offices for a yearly routine gynecological check-up. The women with sexual problems were recruited from the Center for Sexual Medicine in Da˛browa Górnicza, Poland. Thirty-five women with sexual problems and 20 healthy women declined to participate in the study, with refusal rates of 23% and 13%, respectively. During the screening phase of the study, the authors conducted the medical interviews. The following exclusion criteria were used: history of depression or other mental disorders, severe somatic diseases, thyroid dysfunction, diabetes mellitus, liver dysfunctions, unstable coronary heart disease, extreme kidney failure, addiction to psychoactive substances, consumption of >150 mL of alcohol daily, body mass index >30 kg/m2, history of major gynecological operations (hysterectomy, oophorectomy, or mastectomy), use of medications affecting sexual function (antipsychotics, antihypertensives, antidepressants, antihistamines, benzodiazepines, or oral contraceptives), pregnancy or within 3 months postpartum, and no sexual initiation. The Beck Depression Inventory (BDI) was used as a screening tool for the presence of depressive symptoms. All patients who scored ⱖ12 in the BDI were excluded from the study, as depressive symptoms may influence sexual function in female patients [26]. Finally, 189 women were included in the study—85 women diagnosed with FSD on the basis of the Diagnostic and Statistical Manual of Mental Disorders, Fourth Edition, Text Revision (DSM IV-TR) [8] criteria and 104 healthy women. The clinical study was approved by the Bioethical Committee of the Medical University of Silesia. J Sex Med 2013;10:386–395
388
Study Design Recruitment During the screening phase of the study, all women who agreed to participate were explained the project in brief, then they read and signed an informed consent form. A standard medical evaluation form was used to assess participants for the project, and the DSM IV-TR criteria [27] were used for diagnosing FSD. Of the 115 women seen at the Center for Sexual Medicine, 85 met the inclusion criteria for the study and the DSM IV-TR criteria for FSD; these women were included in the FSD group. Of the 130 healthy women, 24 did not pass the inclusion or exclusion criteria, and 2 were diagnosed with FSD based on DSM-IV-TR criteria. The control group comprised 104 healthy women. Linguistic Validation The Polish translation of the original FSFI was obtained from the Mapi Research Trust and is available at: http://www.proqolid.org/instruments/ female_sexual_function_index_fsfi. To test for clarity, intelligibility, and appropriateness of the PL-FSFI, the questionnaire was administered to a group of 25 female students. A face-to-face interview was conducted with these women to check for any difficulties in understanding and interpreting the individual questions; no major difficulties were noted. Subsequently, the PL-FSFI was administered to all 189 individuals participating in the study. Validation of the PL-FSFI On the first day (day 0) all participants were asked to fill out a 139-item self-prepared questionnaire assessing socioepidemiological parameters and sexual behavior including: age at first sexual intercourse, total number of sexual partners, whether having a regular partner, whether sexually active during the previous 4 weeks, sexual orientation, frequency of sexual intercourse, frequency of masturbation, marital satisfaction, and overall satisfaction with sex life assessed on 5-point Likert scale (where a higher score represented a better satisfaction), incidents of sexual harassment in the past (answer yes or no). The PL-FSFI was completed with a 30-day recall at the baseline (day 0), and then again on day 7 and day 28, but with a 7-day recall on these occasions. Measurements FSFI The FSFI is a self-administered questionnaire consisting of 19 items grouped in 6 subscales: J Sex Med 2013;10:386–395
Nowosielski et al. sexual desire (2 items), arousal (4 items), lubrication (4 items), orgasm (3 items), satisfaction (3 items), and pain (3 items). The questionnaire was developed by Rosen et al. to assess sexual function in women over the prior 4 weeks [11]. The subscale scores ranged from 0–6, with higher scores indicating better sexual function. The questionnaire showed a high degree of internal consistency (Cronbach’s a values ⱖ0.82) and high test–retest reliability for each domain (r = 0.79–0.86). It has been successfully cross-validated, and a diagnostic cutoff score of 26.55 has been determined for classification of total FSD [5,28]. However, according to DSM-IV-TR and the American Urology Association Foundation (AUAF; formerly the American Foundation of Urologic Disease) both an FSFI score ⱕ26.55 points and the presence of personal distress are required for FSD diagnosis [10].
Demographic and Sexual Activity Measurements Body mass index (kg/m2) was calculated as body mass/height2. Waist-to-hip ratio (WHR) was calculated as the ratio of the circumference of the waist to the circumference of the hips. Sexual activity was defined as any of the following: caressing, foreplay, masturbation, vaginal or anal intercourse, or oral sex. The marital satisfaction and overall satisfaction with sex life was evaluated on a 5-point Likert scale. Statistical Analysis The Statistica 9.0 Pl computer software (StatSoft, Kraków, Poland) was used for statistical analysis. The distribution of data was assessed with the Shapiro-Wilk W-test. Because of the non-normal distribution of the sample population and the lack of variance homogeneity, the nonparametric Mann-Whitney U-test was used for analysis of quantitative variables. The chi-square test, chisquare test with Yates’ correction, and Fisher’s exact test (for sample sizes less ⱕ20) were used for analyzing qualitative variables. Although a number of possible sample-based criteria could be used to establish a PL-FSFI cutoff score, we used the score that minimized the sum of false-positive and false-negative error rates. This is an independent and more objective criterion for determining the optimal cutoff values based on a receiver operating characteristic (ROC) analysis. The area under the curve (AUC) was also calculated. P values less than 0.05 were considered statistically significant.
Development of the Polish Version of the FSFI
Reliability Reliability was assessed by internal consistencies and the test–retest reliability. Internal consistencies were evaluated by Cronbach’s a coefficient. An a coefficient of ⱖ0.70 was considered to indicate adequate to excellent reliability [12]. The intraclass correlation coefficient (ICC) was used to assess the test–retest reliability, with ICC values of ⱕ0.40 representing poor to fair agreement, 0.41– 0.60 representing moderate agreement, 0.61–0.80 representing good agreement, and >0.80 representing excellent agreement between the two assessments [12]. Validity To evaluate the factor structure and construct validity of the PL-FSFI, principal component analysis using varimax rotation was conducted for all 19 questionnaire items. The data from the entire sample group (N = 189) at day 0 were analyzed. Intercorrelations between the total and individual domain scores were calculated using Pearson’s r coefficient. Discriminant validity was assessed by comparing the mean scores of the FSD group and control group in a between-groups anova. To measure concurrent validity, correlations between PL-FSFI total score and overall sexual satisfaction assessed on 5-point Likert scale were calculated using Pearson’s r. Divergent Validity The degree of association between the PL-FSFI scores (domains and full scale) and marital satisfaction assessed on 5-point Likert scale were calculated by the Pearson product-moment correlation. Results
The mean age of the studied population was 39.20 ⫾ 6.78 years. The FSD and control groups did not differ significantly in regard with any socioeconomic parameters except: (i) the marital satisfaction, which was better among the control group than that among the FSD group (4.33 vs. 3.57, respectively); (ii) the overall sexual satisfaction with a current partner, which was better among the control group than that among the FSD group (3.69 vs. 2.63, respectively); and (iii) residency—FSD group women were more likely than control group women to live in urban areas (62.7% vs. 44.9%) (Table 1). The evaluation of sexual function by the PLFSFI revealed that the mean total score in the FSD
389 group was 21.59, while it was 27.95 in the control group. The largest differences between the groups were observed in the satisfaction domain and the smallest, in the desire domain (Table 2). In the FSD group, based on DSM-IV-TR criteria, the prevalence of desire, arousal, orgasm, and pain disorders were 76.5% (65/85), 56.5% (48/85), 56.5% (48/85), and 24.7% (21/85), respectively. Forty-two women were found to have only one dysfunction (49.4%). The rest reported at least two; combined arousal and desire disorder was the most prevalent at 60.5% (26/43).
Reliability All domains of the PL-FSFI demonstrated satisfactory internal consistencies (Table 3), with a value of >0.70 for all subjects (FSD patients and the controls). The test–retest reliability was examined in all 189 women, in FSD group and controls after 7 and 28 days (Table 4). All domains demonstrated good-to-excellent agreement between the questions. However, the test–retest reliability of the total score between days 0 and 7 had higher ICC than between days 7 and 28 or days 0 and 28 for all groups. Validity All authors of this study agreed that the PL-FSFI had adequate content to evaluate female sexual function and that it could be used for assessing Polish women. To evaluate the factor structure of the PL-FSFI, principal component analysis using varimax rotation was performed. Based on this analysis, a 5-factor model was established with desire/ arousal, lubrication, orgasm, satisfaction, and pain domains (Table 5). This model explained 83.62% of the total variance of the PL-FSFI items. All items clustered in a predicted fashion and had relatively high factor loadings, supporting the factoral validity of the PL-FSFI. Domain intercorrelations of the PL-FSFI were significantly high, ranging from 0.37–0.77 (Table 6). The highest positive correlation was observed between the desire and arousal domains (r = 0.77), which is consistent with the factor analysis results described in the previous section. The discriminant validity of the PL-FSFI was calculated using the between-groups anova analysis. It revealed significant differences in mean scores for all domains as well as in the total scores (Table 7). Thus, the PL-FSFI demonstrated good discriminant validity. The concurrent validity of the PL-FSFI as measured by the Pearson’s J Sex Med 2013;10:386–395
390 Table 1
Nowosielski et al. The general characteristic of the study population P * (FSD vs. no FSD)
Variable
FSD (N = 85)
No FSD (N = 104)
Total (N = 189)
Age—years (mean, SD, range)
38.14 ⫾ 7.39 (22.31–51.91) 23.60 ⫾ 4.48 0.79 ⫾ 0.06 20.15 ⫾ 2.89 2.0 (1.0–3.0) 3.41 ⫾ 0.73 2.63 ⫾ 0.96
50.06 ⫾ 6.17 (26.62–51.34) 24.85 ⫾ 3.83 0.80 ⫾ 0.08 19.51 ⫾ 2.23 1.0 (1.0–3.0) 4.713 ⫾ 0.41 3.69 ⫾ 0.95
39.20 ⫾ 6.78 (22.32–51.91) 24.29 ⫾ 4.17 0.80 ⫾ 0.07 19.80 ⫾ 2.56 2.0 (1.0–3.0) 3.73 ⫾ 0.82 3.21 ⫾ 1.09
0.06 0.71 0.24 0.28 0.00001 0.00001
14.28 ⫾ 8.00
17.27 ⫾ 7.40
15.96 ⫾ 7.79
0.07
BMI (kg/m2) WHR Age of the first intercourse—years (mean, SD) Nr of lifetime sexual partners (median, upper/lower quartile) Marital satisfaction (5-point Likert scale) (mean, SD) Overall sexual satisfaction with a current partner (5-point Likert scale) (mean, SD) Duration of marriage/relationship—years (mean, SD) Education (N, %) Primary Secondary Tertiary Regular participation in religious practices Yes No Marital state—N (%) Married/Partnership Single Residency (N, %) Rural City (urban area) Monthly incomes per one family member (N, %) Unemployed Up to 400€ Up to 1,200€ Over 1,200€ Having a regular sexual partner (N, %) Yes No Having children Yes No Sexually active during last 4 weeks† (N, %) Yes No Menstrual status (N, %) Regular Irregular Postmenopausal
0.10
2 (2.38) 57 (67.86) 25 (29.75)
2 (1.92) 80 (76.92) 22 (21.15)
4 (2.13) 137 (72.87) 47 (25.00)
0.30
50 (47.62) 44 (52.38)
54 (51.92) 50 (48.08)
104 (55.32) 84 (44.68)
0.66
74 (87.06) 11 (12.94)
95 (92.23) 8 (7.77)
168 (89.37) 20 (10.63)
0.36
28 (37.33) 47 (62.67)
54 (55.10) 44 (44.90)
82 (47.40) 91 (52.60)
0.02
3 50 30 1
3 71 25 3
(3.57) (59.52) (35.71) (1.19)
(2.94) (69.61) (24.51) (2.94)
6 121 55 4
(3.23) (65.05) (29.57) (2.15)
0.33
80 (94.12) 5 (5.88)
102 (98.08) 2 (1.92)
182 (96.30) 7 (3.70)
0.14
66 (98.51) 1 (1.49)
89 (94.68) 5 (5.32)
155 (96.27) 6 (3.73)
0.32
73 (86.90) 11 (13.10)
97 (93.27) 7 (6.73)
170 (90.43) 18 (9.57)
0.11
72 (84.71) 9 (10.59) 4 (4.71)
95 (91.35) 6 (5.77) 3 (2.88)
167 (88.36) 15 (7.94) 7 (3.70)
0.36
*ch2 test/Fisher’s exact test for the qualitative variables; Mann-Whitney U-test for the quantitative variables † Sexual activity defined as any of the following: caressing, foreplay, masturbation and vaginal intercourse FSD = female sexual dysfunction; BMI = Body Mass Index; WHR = waist-to-hip ratio; SD = standard deviation
correlation coefficient between the overall sexual satisfaction assessed on 5-point Likert scale and the PL-FSFI was significant for all domains, ranging from r = 0.27 to 0.72 (Table 7). Table 2
The degree of association between the PL-FSFI scores and marital satisfaction assessed on 5-point Likert scale was calculated by Pearson product– moment correlation (Table 8). These correlations
The general characteristic of the studied population—sexual health
Domain
Full sample (N = 189) Mean, SD
FSD (N = 85) Mean, SD
No FSD (N = 104) Mean, SD
Mean difference between FSD and No FSD
Desire Arousal Lubrication Orgasm Satisfaction Pain Full score
3.39 ⫾ 1.16 4.04 ⫾ 1.36 4.87 ⫾ 1.39 4.34 ⫾ 1.52 4.67 ⫾ 1.34 5.10 ⫾ 1.52 26.62 ⫾ 6.73
2.76 ⫾ 0.97 3.17 ⫾ 1.28 4.20 ⫾ 1.59 3.39 ⫾ 1.49 3.61 ⫾ 1.24 4.26 ⫾ 1.83 21.59 ⫾ 6.58
3.92 ⫾ 1.04 4.75 ⫾ 0.95 5.47 ⫾ 0.88 5.12 ⫾ 1.02 5.53 ⫾ 0.61 5.79 ⫾ 0.66 27.95 ⫾ 2.12
1.16 1.52 1.27 1.73 1.92 1.53 6.36
J Sex Med 2013;10:386–395
391
Development of the Polish Version of the FSFI Table 3 Internal consistency (Cronbach’s alpha) of the Polish version of the Female Sexual Function Index (PL-FSFI) Internal consistency (Cronbach’s alpha) Domain
Full sample (N = 189)
FSD (N = 85)
No FSD (N = 104)
Desire (Items 1–2) Arousal (Items 3–6) Lubrication (Items 7–10) Orgasm (Items 11–13) Satisfaction (Items 15–16) Pain (Items 17–19) Total (Items 1–19)
0.88 0.92 0.92 0.88 0.91 0.96 0.96
0.87 0.90 0.92 0.84 0.85 0.95 0.95
0.82 0.87 0.86 0.82 0.71 0.90 0.87
Table 4 Test–retest reliability (intraclass correlation coefficient [ICC]) of the Polish version of the Female Sexual Function Index (PL-FSFI) Domain
Day 0–7
Day 0–28
Day 7–28
Intraclass Correlation Coefficients for full sample Desire (Items 1–2) 0.83 0.80 Arousal (Items 3–6) 0.89 0.86 Lubrication (Items 7–10) 0.85 0.80 Orgasm (Items 11–13) 0.88 0.81 Satisfaction (Items 15–16) 0.87 0.78 Pain (Items 17–19) 0.80 0.73 Total (Items 1–19) 0.83 0.75
0.85 0.86 0.80 0.85 0.81 0.81 0.82
Intraclass Correlation Coefficients for FSD Desire (Items 1–2) 0.71 0.72 Arousal (Items 3–6) 0.74 0.65 Lubrication (Items 7–10) 0.78 0.74 Orgasm (Items 11–13) 0.72 0.70 Satisfaction (Items 15–16) 0.81 0.63 Pain (Items 17–19) 0.72 0.70 Total (Items 1–19) 0.69 0.67
0.73 0.74 0.80 0.70 0.77 0.75 0.67
Intraclass Correlation Coefficients for no FSD Desire (Items 1–2) 0.85 0.86 Arousal (Items 3–6) 0.93 0.87 Lubrication (Items 7–10) 0.95 0.88 Orgasm (Items 11–13) 0.94 0.85 Satisfaction (Items 15–16) 0.94 0.90 Pain (Items 17–19) 0.96 0.89 Total (Items 1–19) 0.93 0.77
0.76 0.72 0.74 0.66 0.75 0.71 0.73
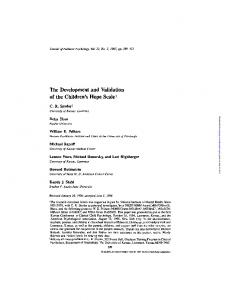
were performed on the sample of 168 individuals who were in stable relationships, 74 of whom were in the FSD group and 95 of whom were controls. The analysis demonstrated that the correlations were statistically significant, though generally modest in magnitude (low-moderate to very-lowmoderate). In both groups, the strongest overlap with marital satisfaction was observed for the satisfaction domain of the PL-FSFI. ROC analysis of the PL-FSFI total score showed that the AUC was 0.93 (CI: 0.89–0.97) on day 0 (Figure 1). The optimal PL-FSFI cutoff score was found to be 27.50, yielding a 87.1% sensitivity, a 83.1% specificity, and a positive predictive value (PPV) of 86.3%. The suggested
cutoff scores for individual domains are presented in Table 9. Discussion
This study illustrated that the PL-FSFI has sufficient reliability and validity for use in screening for sexual problems in Polish women. To the authors’ knowledge, this study is the first to evaluate the psychometric validity of PL-FSFI in a population of Polish women. It should be emphasized that owing to the personal nature of the questionnaire, the present study was difficult to perform. In Poland, similar to other conservative countries like Iran, Taiwan, Malaysia, and Japan, sexuality is rarely a subject of scientific debate [12,15–17]. Most people consider sexual topics to be extremely private and are not willing to discuss them, neither with general practitioners nor with sexual health care professionals. Because studies on sexual function in Polish individuals are lacking, the authors’ research is of great importance, Table 5 Principal component analysis with varimax rotation of the Polish version of the Female Sexual Function Index Factors Items Desire: frequency Desire: level Arousal: frequency Arousal: level Arousal: confidence Arousal: satisfaction Lubrication: frequency Lubrication: difficulty Lubrication: frequency of maintaining Lubrication: difficulty in maintaining Orgasm: frequency Orgasm: difficulty Orgasm: satisfaction Satisfaction: with amount of closeness with partner Satisfaction: with sexual relationship Satisfaction: with overall sex life Pain: frequency during vaginal penetration Pain: frequency following vaginal penetration Pain: level during or following vaginal penetration Eigenvalue % of explained variance
F1
F2
F3
F4
F5
0.84* 0.85* 0.67* 0.71* 0.64* 0.64* 0.39 0.26 0.41
0.12 0.10 0.14 0.23 0.34 0.22 0.30 0.30 0.29
0.24 0.22 0.23 0.24 0.20 0.31 0.15 0.12 0.16
0.03 0.04 0.36 0.26 0.26 0.37 0.35 0.20 0.33
0.09 0.20 0.23 0.36 0.38 0.32 0.62* 0.82* 0.59*
0.24
0.36
0.25
0.12
0.78*
0.23 0.16 0.34 0.34
0.22 0.37 0.18 0.35
0.22 0.37 0.50 0.61*
0.83* 0.51* 0.51* 0.21
0.26 0.45 0.38 0.36
0.29
0.28
0.81*
0.15
0.10
0.37
0.14
0.81*
0.19
0.15
0.20
0.83*
0.22
0.15
0.29
0.19
0.89*
0.15
0.13
0.24
0.14
0.85*
0.24
0.19
0.27
11.69 61.57
1.72 9.07
1.05 5.53
0.90 4.75
0.51 2.71
The highest factor loading in each principal component is shown with asterisk and shadings. F1 = desire/arousal; F2 = pain; F3 = satisfaction; F4 = orgasm; F5 = lubrication
J Sex Med 2013;10:386–395
392 Table 6
Nowosielski et al. Domain intercorrelation (Pearson’s r)
Full sample
Desire
Arousal
Lubrication
Orgasm
Satisfaction
Pain
Desire Arousal Lubrication Orgasm Satisfaction Pain No FSD Desire Arousal Lubrication Orgasm Satisfaction Pain FSD Desire Arousal Lubrication Orgasm Satisfaction Pain
1.00 0.77* 0.51* 0.48* 0.59* 0.37*
1.00 0.75* 0.71* 0.75* 0.59*
1.00 0.74* 0.65* 0.70*
1.00 0.73* 0.62*
1.,00 0.61*
1.00
1.00 0.56* 0.29* 0.24* 0.35* 0.21
1.00 0.48* 0.42* 0.52* 0.10
1.00 0.52* 0.33* 0.29*
1.00 0.32* 0.23*
1.00 0.11
1.00
1.00 0.75* 0.47* 0.31* 0.46* 0.024*
1.00 0.71* 0.63* 0.62* 0.49*
1.00 0.71* 0.56* 0.67*
1.00 0.65* 0.52*
1.00 0.43*
1.00
*P < 0.05
shedding new light on the sexual issues of Polish women [29,30]. The PL-FSFI showed only modest correlations with a measure of marital satisfaction that was assessed by a single question. Divergence of the PL-FSFI from the marital satisfaction scores was greater for the FSD group than for the control group, for whom a moderately high correlation Table 7
was noted between marital satisfaction and the global sexual satisfaction domain. Thus, for women with FSD, PL-FSFI scores seem to be independent of the influence of marital satisfaction and adjustment. Similar results were presented in the original validation of the FSFI [11]. Similarly to papers by Takahashi et al. and Fakhri et al. [12,17], the results of the authors
PL-FSFI—Discriminant validity
Items and domains
FSD (N = 85) Mean, SD
No FSD(N = 104) Mean, SD
Desire 1. Desire: frequency 2. Desire: level Arousal 3. Arousal: frequency 4. Arousal: level 5. Arousal: confidence 6. Arousal: satisfaction Lubrication 7. Lubrication: frequency 8. Lubrication: difficulty 9. Lubrication: frequency of maintaining 10. Lubrication: difficulty in maintaining Orgasm 11. Orgasm: frequency 12. Orgasm: difficulty 13. Orgasm: satisfaction Satisfaction 14. Satisfaction: with amount of closeness with partner 15. Satisfaction: with sexual relationship 16. Satisfaction: with overall sex life Pain 17. Pain: frequency during vaginal penetration 18. Pain: frequency following vaginal penetration 19. Pain: level during or following vaginal penetration Full score
2.76 ⫾ 0.97 2.20 ⫾ 0.85 2.40 ⫾ 0.87 3.17 ⫾ 1.28 2.75 ⫾ 1.23 2.67 ⫾ 1.05 2.60 ⫾ 1.13 2.56 ⫾ 1.43 4.20 ⫾ 1.59 3.36 ⫾ 1.56 3.67 ⫾ 1.41 3.27 ⫾ 1.59 3.70 ⫾ 1.38 3.39 ⫾ 1.49 2.69 ⫾ 1.51 3.15 ⫾ 1.40 2.65 ⫾ 1.35 3.61 ⫾ 1.24 3.09 ⫾ 1.37 3.09 ⫾ 1.05 2.81 ⫾ 1.13 4.26 ⫾ 1.83 3.53 ⫾ 1.62 3.68 ⫾ 1.65 2.44 ⫾ 1.52 21.59 ⫾ 6.58
3.92 ⫾ 1.04 3.25 ⫾ 1.07 3.29 ⫾ 0.80 4.75 ⫾ 0.95 4.12 ⫾ 1.11 3.72 ⫾ 0.85 3.82 ⫾ 0.77 4.12 ⫾ 0.96 5.47 ⫾ 0.88 4.50 ⫾ 0.91 4.55 ⫾ 0.75 4.47 ⫾ 1.03 4.58 ⫾ 0.73 5.12 ⫾ 1.02 4.18 ⫾ 1.18 4.38 ⫾ 0.77 4.27 ⫾ 0.98 5.53 ⫾ 0.61 4.63 ⫾ 0.80 4.62 ⫾ 0.61 4.52 ⫾ 0.68 5.79 ⫾ 0.66 4.86 ⫾ 0.57 4.86 ⫾ 0.57 4.74 ⫾ 0.65 27.95 ⫾ 2.12
*P values for domain scores and full score were assessed by using between-group analysis of variances.
J Sex Med 2013;10:386–395
P*