Development Discussion Papers
Indonesia’s Macroeconomic and Trade Performance Yana van der Meulen Rodgers Development Discussion Paper No. 495 July 1994
© Copyright 1994 Yana van der Meulen Rodgers and President and Fellows of Harvard College
Harvard Institute for International Development HARVARD UNIVERSITY
HIID Development Discussion Paper no. 495
Indonesia's Macroeconomic and Trade Performance Yana van der Meulen Rodgers*
Abstract This paper investigates the links between Indonesia's growth, debt, and trade performances from 1970 to 1990, and it compares Indonesia's performance with countries that have similar characteristics. This descriptive analysis points to the strong influence of oil revenue fluctuations, open capital markets, and exchange rate management on Indonesia's economy. A decomposition analysis of Indonesia's uses of external debt indicates that the financing of current account deficits cannot explain large proportions of rapid debt accumulation after 1970. Finally, Indonesia's real manufactured export growth of at least 28 percent per year during the 1980s rivalled its regional neighbors. Indonesia's experience demonstrates that despite severe external shocks, sensible policy reforms can help developing countries to achieve impressive economic performances. Yana van der Meulen Rodgers is an Assistant Professor at the College of William and Mary. She worked as a Project Assistant for HIID in Jakarta from 1989 to 1990. *I gratefully acknowledge David Cole, Susan Collins, Jeffrey Lewis, William Rodgers, Michael Roemer, and Henry Rosovsky for their useful suggestions. Correspondence to Yana van der Meulen Rodgers, Department of Economics, College of William and Mary, Williamsburg, VA, 23187. Tel 804-221-2376; Fax 804-221-2390; EMail
[email protected].
HIID Development Discussion Paper no. 495
Indonesia's Macroeconomic and Trade Performance Yana van der Meulen Rodgers I. Introduction Indonesia's remarkable macroeconomic and trade performance in the 1970s and 1980s has motivated comparison with the high performance Asian tigers and has provided strong evidence for economic reform contributions to export led growth.1 In the 1970s, the Indonesian government took several largely unprecedented steps among developing countries, such as permitting free capital convertibility and implementing a major exchange rate devaluation to prevent Dutch Disease. During the 1980s, this OPEC member and major international debtor faced severe world oil price, exchange rate, and interest rate shocks. Sensible policy changes and the promotion of non-oil exports prevented Indonesia from defaulting on its foreign debt obligations and from slipping into macroeconomic instability. By closely examining Indonesia's distinctive export and economic growth performances, we will improve our understanding of how developing countries can successfully adjust to major shocks. This paper investigates the links between Indonesia's growth, debt, and trade performances from 1970 to 1990, and it compares Indonesia's performance with countries that have similar characteristics. This descriptive analysis points to the strong influence of oil revenue fluctuations, open capital markets, and exchange rate management on Indonesia's economy. Gradual policy reform in finance, industry, and trade toward greater market orientation worked to diversify Indonesia's structural 1
financing of economic growth through non-oil exports and private sector investment. More generally, Indonesia's macroeconomic and trade experience provides useful information for the numerous developing countries undergoing policy reform. The paper first analyzes Indonesian macroeconomic performance from 1970 to 1990 in three sub-periods with endpoints generated by trends in oil prices and policy reforms.2 Led by high foreign borrowing and the 1973 and 1979 oil booms, Indonesia experienced strong economic growth and export performances during the Primary Boom Period from 1970 to 1981. Although real annual GDP growth averaged 8 percent, Indonesia lagged behind its regional neighbors in the transition from primary commodity exporter to manufactured goods exporter. During the Economic Retrenchment Period from 1982 to 1985, Indonesia's real annual GDP growth dropped to 4 percent and current account deficits worsened as the oil price declined and debt service costs increased. In the Non-Oil Recovery Period from 1986 to 1990 as the oil price stagnated, Indonesia's non-oil export sector surpassed oil in foreign exchange earnings, and average real GDP growth rose to over 6 percent per year. Next, a decomposition analysis of Indonesia's uses of external debt indicates that the financing of current account deficits cannot explain large proportions of rapid debt accumulation after 1970. From 1970 to 1978 and again after 1986, only one half of new external debt financed Indonesia's current account deficits. Up to one third of debt flows in these sub-periods financed short-term capital outflows. The open capital market and ineffective monetary policy instruments led the Central Bank to have little control over the capital flight. While current account deficits lessened 2
during the 1970s as private and public savings both grew rapidly to catch up with strong investment growth, a slowdown in public savings during the Economic Retrenchment Period contributed to the resurgence of large current account deficits. A strong surge in private savings after 1986 helped Indonesia to finance rapid investment growth and to attain smaller current account deficits. The paper then describes Indonesia's trade composition and growth. Indonesia's real manufactured export growth of at least 28 percent per year during the 1980s rivalled its regional neighbors. Oil's contribution to total export earnings dropped from 82 to 39 percent between 1982 and 1989.
Star performers,
particularly plywood, textiles, and garments, responded favorably to the government's price and investment incentives. However, several natural resource export flows ended abruptly following restrictive trade policy to encourage domestic manufacturing production. Restrictive policies covering most finished consumer good imports led intermediate inputs and capital goods to maintain an approximate 70 percent share of total imports during the 1970s and 1980s. Particularly rapid import growth in the late 1980s constitutes a potential drawback for other developing countries to duplicating Indonesia's trade experience. remarks on policy lessons.
3
The final section provides concluding
II. Macroeconomic Indicators Primary Boom (1970-1981) Led by primary export recovery and high foreign aid from 1970 to 1972, the first oil boom from 1973 to 1978, and the second oil boom from 1979 to 1981, Indonesia experienced strong macroeconomic and export performances in the Primary Boom Period. Table 1 shows that in the early 1970s following the IMF-sponsored stabilization program and debt negotiations, Indonesia's inflation rate dropped from near hyperinflationary levels to an annual average of 8 percent.3
However,
Indonesia's high dollar oil earnings from the first OPEC price shock contributed to average inflation rates of 22 percent for the next five years. The 1978 preventive exchange rate devaluation helped Indonesia to restrain the erosion in relative export price incentives to less than 5 percent between 1970-72 and 1979-81, while Nigeria, a country with comparable export composition, allowed its real exchange rate to appreciate 60 percent during the 1970s.4 Indonesia's exchange rate management contributed to a slight increase in the Non-Oil Export/GDP ratio in 1979-81, while Nigeria experienced tradeables sector stagnation and later debt servicing difficulties. The second oil price shock led Indonesia's Total Export/GDP ratio to peak at almost 30 percent and contributed to current account surpluses at 2 percent of GDP. Fueled by the oil booms, real economic growth during the Primary Boom Period averaged 8 percent annually and outperformed the Asian average. Rapid industrial sector growth, particularly in manufacturing, led to the transformation of Indonesia's production structure.
Table 2 shows that by 1979-81, industry had replaced 4
agriculture as the largest economic sector.
The industrial transformation also
occurred on the demand side as investment growth outpaced private and public consumption. Indonesia experienced rapid external debt accumulation in the early 1970s relative to both problem and non-problem debtor countries with similar export composition or geographical characteristics. Table 3 shows that from 1970 to 1972, Indonesia had among the highest Debt/Export and Debt/GDP ratios. High borrowing at concessional terms from the Inter-Governmental Group on Indonesia and improved credit-worthiness after the first oil boom led to the rapid debt accumulation in the 1970s. Although Indonesia's relative debt indicators still exceeded most of the debtors from 1973 to 1978, they improved as real GDP and exports expanded. By 1979-81, Indonesia's Debt/Export ratio compared favorably with non-problem debtors and appeared considerably more manageable than Mexico and the Philippines. Economic Retrenchment (1982-1985) In the Economic Retrenchment Period from 1982 to 1985, the oil price fell on average 6 percent per year and the average current account deficit hit a trough of 4 percent of GDP. Restraint in import expenditures did not match the decline in export revenues, and foreign borrowing increased to fill the gap.
The second major
devaluation in 1983, supported by government efforts to control money growth with new monetary policy instruments, aimed to realign the real exchange rate. Indonesia's average annual real GDP growth fell by half and dropped considerably behind other Asian countries. While production growth slowed across 5
sectors, real manufacturing production growth still averaged 15 percent per year. Fiscal retrenchment is reflected in the slowdown of gross domestic investment and government consumption. In response to lower oil revenues, the government cut expenditures on large capital intensive projects, so that between 1982 and 1986 the ratio of actual to planned capital expenditures fell from 1.54 to 0.65.5 As total export earnings declined with the oil price crash and debt costs increased with higher world interest rates, the Debt Service/Export and Debt Service/GDP ratios both worsened. As with other problem and non-problem debtors, Indonesia's Total Debt/Export and Total Debt/GDP ratios increased relative to 197981.
However, the figures were both considerably lower than Mexico and the
Philippines. Finally, the three problem debtors had negative or stagnant economic growth while Indonesia's real GDP growth still averaged 4 percent annually. Non-Oil Recovery (1986-1990) Improvements in real income growth and the current account, fueled by non-oil export growth, mark the Non-Oil Recovery Period. The oil price fell 35 percent in 1986 alone and maintained low levels for the remaining 1980s. The third major devaluation in 1986, combined with lower inflation, caused the real exchange rate index to double; the Non-Oil Export/GDP ratio also doubled, from 6 to 12 percent.6 Even though the government allowed the rupiah to depreciate more rapidly and the money supply growth rate to increase, Indonesia still achieved lower inflations rates relative to the previous period. A small decline in the fiscal expenditure share of GDP,
6
and government price controls on several key commodities and services, help to explain the decline in inflation.7 Between 1979-81 and 1986-90 the average annual share of government expenditures financed by foreign borrowing rose from 14 to 26 percent, indicating the contribution of continued foreign aid in lessening the austerity of budget cuts. In effect, Indonesia's balanced budget requirement did not act as a binding constraint on government expenditures; the rule simply forced the government to rely on the foreign credit market to finance excess expenditures. Manufacturing production continued to record strong real growth and reached an 18 percent share of total production. By 1990 the share of the labor force in agriculture dropped to 49.9 percent from 56.3 percent in 1980, and in manufacturing it rose to 11.6 percent from 9.1 percent in 1980.8 Gross investment grew over 12 percent per year in the late 1980s, reaching one third of aggregate demand. Heavy foreign investment, especially by the Japanese, had a major role in this structural transformation. During the 1970s and early 1980s, Japan invested more in Indonesia than in Malaysia, the Philippines, or Thailand, but most of the investment targeted natural resource extraction.9
With Indonesia's policy reforms in the 1980s and
competitive wage bills, Japanese investment in Indonesia switched to more unskilled labor-intensive manufacturing industries, particularly textiles and plywood. By 1986 foreign companies in joint ventures with private Indonesian firms produced almost one third of textile output and over 40 percent of footwear output.10
7
Debtor countries, both problem and non-problem, had higher Debt/Export and Debt/GDP ratios in the late 1980s compared to the early 1970s, with the exception of Korea, which paid down its outstanding debt during the 1980s.11 Indonesia's accelerated debt accumulation after 1986 reflects increased foreign borrowing to offset the oil revenue shortfall, as well as the higher value of Indonesian debt following the appreciation of the Yen and other non-dollar currencies.12
Both
Indonesia's Debt/Export and Debt/GDP ratios almost doubled relative to the previous period, and debt service burdens also increased rapidly after 1986. The rise in debt indicators brought Indonesia closer to standards set by problem debtors and may signal future problems. However, among comparison countries, Indonesia's average annual real income growth of 6 percent was exceeded only by Korea, and Indonesia maintained punctual debt repayments throughout the international debt crisis period. These performance indicators suggest that Indonesia managed the external shocks more sensibly than other debtor countries.
III. External Debt, Current Account, and Domestic Savings How did Indonesia use its rapid debt accumulation in the 1970s and 1980s? Manipulation of the balance of payments accounts yields the following identity which decomposes the uses of foreign debt:13 Total Net Current Foreign Other Long Other Short Direct Debt = Account + Exchange + Term Capital + Term Capital - Foreign (1) Flow Deficit Accumulation Outflows Outflows Investment
8
The identity indicates that total net foreign debt flows (disbursements minus amortization of long-term and short-term debt) plus other long-term direct foreign investment finance current account deficits, official foreign exchange reserve accumulation, and other net long-term and short-term capital outflows.14 Other net short-term capital outflows include any short-term capital flows by the private sector, net of short-term debt flows, and errors and omissions in the balance of payments accounts. I use the net short-term capital outflows entry to approximate for shortterm capital flight, even though it may reflect some long-term capital outflows which were included under errors and omissions. This capital flight approximation is based on balance of payments figures and does not include estimates for private capital flight from smuggling, underinvoicing of exports, or overinvoicing of imports.15 Panel A, Table 4 shows that from 1970 to 1978, less than one half of new external debt financed Indonesian current account deficits. Between 1970 and 1972 over one half of debt financed other net long-term capital outflows, but short-term capital flowed into rather than out of Indonesia. From 1973 to 1978, short-term capital flight from Indonesia accounted for just under one third of new debt. The Central Bank's credit ceilings on commercial banks, plus relatively low domestic demand deposit rates, encouraged many Indonesian firms to hold their funds abroad.16 Commercial banks also found it profitable to hold balances abroad if they had funds which exceeded the imposed credit ceilings.17 The open capital market and ineffective monetary policy instruments led the Central Bank to have little control over the capital flight. 9
During the second oil boom, the pace of debt accumulation lessened. New debt and current account surpluses financed reserve accumulation, although a larger proportion financed short-term capital flight. How do net short-term capital outflows from Indonesia of 5.4 billion dollars from 1979 to 1981 compare with other debtor countries? Previous estimates indicate that Brazil, Chile, Korea, and Peru each had net short-term capital inflows from 1979 to 1981, and Uruguay had relatively small capital flight of 99 million dollars. Argentina, Mexico, and Venezuela each had higher capital flight than Indonesia, with 9.3, 17.8, and 6.0 billion dollars.18 In the Economic Retrenchment Period, Indonesian current account deficits accumulated faster than new foreign borrowing. Foreign exchange reserves were depleted, other long-term capital was repatriated from abroad, and short-term capital flight abated relative to the large increase after 1973.
The capital movements
resulted mostly from firms, banks, and individuals moving their funds back into Indonesia to invest in financial and real assets, particularly as domestic credit availability tightened. Finally, in the late 1980s Indonesia experienced an extremely large accumulation of foreign debt, one half of which financed current account deficits, and over one third financed short-term capital outflows.
Speculative
outflows in response to devaluation expectations in the late 1980s contributed to the high short-term capital figure. Over one half of the debt flow increase in 1990 alone is explained by short-term borrowing.
Rapid stock market growth following
deregulation in the late 1980s may have prompted the short-term debt accumulation.
10
Panels B and C, Table 4 further decompose the foreign borrowing that did finance current account deficits into the gap between domestic savings and investment. During the Primary Boom Period, current account deficits lessened as private and public savings both grew rapidly to catch up with strong investment growth. During the Economic Retrenchment Period, as the investment share of GDP continued to rise, a slowdown in public savings contributed to the resurgence of large current account deficits. The two percentage point decline in the public savings share of GDP reflects the government's loss of oil revenues. Finally, private sector savings surged after 1986 to finance rapid investment growth, helping to attain smaller current account deficits and an average national savings rate of 30 percent. Banking sector deregulation and more widespread access to financial services help to explain the private savings surge. A comparison of Indonesia's lending rate with the world interest rate provides insight into why short-term borrowing increased so rapidly in the late 1980s.19 Table 5 indicates that after 1987, the gap between Indonesia's lending rate, the foreign interest rate, and the rate of rupiah depreciation increased dramatically as the government stopped using large devaluations. The reversal increased the relative cost of borrowing domestically. Also, after 1987 the real cost of borrowing abroad at commercial rates dropped sharply as the rupiah's real value appreciated. Indonesia's experience conforms with the stylized fact that the current account deficit often worsens as public savings fall.20
However, Indonesia's experience
counters a second stylized fact that countries often reduce current account deficits 11
through curtailments in total investment and fiscal spending. The decomposition points to the responsibility of high investment financed by sharply increased private savings in generating current account deficits after 1986. If the private sector made productive investments with quick returns, Indonesia can maintain a sustainable level of debt despite the large increase in foreign borrowing after 1986.
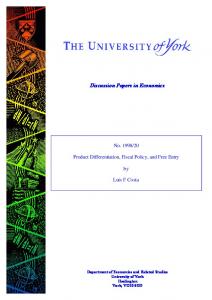
IV. Trade Performance During the 1970s Indonesia lagged behind its neighbors in the transition from primary commodity exporter to manufactured goods exporter. Table 6 shows that until 1979, Indonesia's manufactured exports constituted less than 2 percent of total exports, well below figures for Korea, Malaysia, the Philippines, and Thailand. Figure 1 clearly shows that oil and gas revenues constituted the largest share of total export earnings.
However, the sharp oil price decline between 1982 and 1986, from
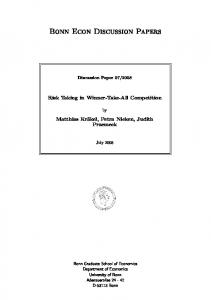
approximately 35 to 12 dollars per barrel, led the oil and gas export share to fall almost 30 percentage points from a peak 82 percent. Non-oil exports fueled the export recovery after 1986. Real non-oil export growth of 17 percent per year and real manufactured export growth of 31 percent per year from 1986 to 1990 outperformed most neighbors. By 1990, Indonesian manufactured exports' share of total export revenues had risen to over one third, and non-oil exports had surpassed oil exports as the main contributor to export earnings. Figure 2 illustrates manufactured exports' rapid growth and structural change. In 1975, several machinery, equipment, and chemical industries dominated the 12
relatively small manufactured export sector. Ten years later, plywood, textiles, and garments had emerged as the leading manufactured exports. As shown in Panel A, Table 7, real textiles and garments earnings grew by 43 percent per year from 1982 to 1985, from a sizable base of 166 million current 1985 dollars, and by 35 percent per year after 1986. Real plywood earnings rose at least 23 percent per year during the 1980s, leading Indonesia to rank as the world's largest plywood exporter by value. However, plywood's rising export share had stabilized by the late 1980s as textiles, garments, and footwear, grew more rapidly. Large exchange rate devaluations in 1978, 1983, and 1986 improved domestic price incentives and had a significant impact on manufactured exports.21 By 1990 Indonesia's real effective exchange rate index exceeded the next closest competitor by a factor of two.22 Increased domestic and multinational investment following improvements in the investment climate also made a significant contribution to Indonesia's manufactured export growth. To further stimulate manufactured exports, Indonesian firms broadened their export markets in Japan and the U.S. to include other Asian countries, particularly Korea, Hong Kong, and Taiwan. The Indonesian government's log export ban to increase domestic value added in wood processing industries largely explains the rapid plywood growth. Indonesia's tropical forest coverage ranks third in the world behind Brazil and Zaire. While the government controls the country's forest resources, it grants concessions to private companies for logging and processing. Between 1980 and 1985 the government progressively raised export taxes on logs and allocated export quotas only to those 13
logging concessions which also had infrastructure to process the wood. After 1985 no tropical logs were allowed to leave Indonesia at all. The export ban caused an excess supply of logs on the domestic market, and the resulting 20 percent decline in the domestic log price subsidized log input purchases for downstream industries. Even though plywood exports grew rapidly, the log export ban caused extremely large foreign exchange losses. Real export earnings from logs, sawnwood, and plywood grew at an annual rate of 20 percent from 1975 to 1980 but only 3 percent per year from 1980 to 1990, and earnings did not catch up to their peak 1979 levels until 1988. Estimates of foregone foreign exchange earnings up to 1987 range from 2 to 3 billion dollars; another study estimates that through the mid-1980s Indonesia lost 4 dollars in foregone log export earnings for every dollar earned from plywood exports.23
Despite the scale of
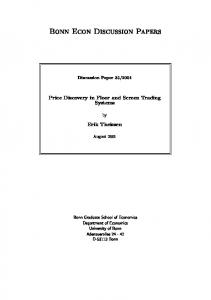
projected losses, late in 1989 the Indonesian government placed a prohibitive export tax on most types of sawnwood to promote industries further downstream. Figure 3's dramatic change in Indonesia's mining and wood export composition reflects these restrictive government policies. While log exports constituted almost two thirds of mining and wood export earnings in 1975, their share dropped to zero by 1985 following the progressive log export ban. Although real sawnwood export earnings rose after 1984 as producers developed the necessary infrastructure to process the wood, earnings fell sharply following the prohibitive 1989 export tax.24 Figure 4 illustrates that rubber and coffee earned the highest agricultural export revenues from 1975 to 1990, leading Indonesia to rank as the world's second largest 14
rubber exporter and the third largest coffee exporter by value.
Rubber exports
contributed almost 40 percent of agricultural export revenues in the mid-1970s, but by 1990 the share had fallen by almost one half. Synthetic rubber prices dropped after 1982 as the world price of the main input (petroleum) fell, encouraging world producers to substitute synthetics for natural rubber. External conditions strongly influenced coffee exports as well. To lessen wide coffee price fluctuations, most coffee exporting and importing countries signed the International Coffee Agreement in 1980. The agreement stabilized the world price until it collapsed in 1989, creating a glut in the world coffee supply and a sharp price fall.25 Finally, increased use of aqua marine breeding farms helps to explain the rapid growth of Indonesia's fish and shrimp exports in the late 1980s. The underlying theme of Indonesia's import experience between 1975 and 1990 is continuity.
Figures 5 and 6 indicate that the composition of import
expenditures remained much the same, with manufactured imports, particularly chemicals, basic metals, and machinery and equipment, constituting at least 64 percent of total imports. Rice imports explain high agricultural shares in total import expenditures in the 1970s. Indonesia constituted one of the world's largest rice importers until the early 1980s when it became self-sufficient in rice production. Domestic investment demand rather than consumer demand drove import growth. Already in the 1970s the government distorted price incentives to artificially encourage imported capital and intermediate imports while it restricted or eliminated many imported consumer goods.26 15
Import expenditures declined sharply in the early 1980s as oil export earnings collapsed. Panel B, Table 7 reports that real import expenditures, which had grown 10 percent annually during the second oil boom, fell by almost 7 percent per year from 1982 to 1985. However, with strong non-oil export growth after 1986 and heavy foreign borrowing, real imports grew over 14 percent annually after 1986. Import recovery after 1986 is consistent with the rapid growth of investment in manufactured export industries, especially in textiles, leather, and paper. After 1986, real textile and leather machinery imports increased by over 60 percent per year, and other industry specific machinery imports, including paper and pulp mill equipment, grew over 26 percent per year. The late 1980s surge in real imports added pressure to the current account deficit as debt service costs increased and easy foreign exchange earnings from oil dwindled. Between 1986 and 1990 Indonesia's import share of GDP jumped from 13 to 20 percent. The increase matched changes for problem debtors Mexico, Nigeria, and the Philippines, and exceeded changes in import shares for non-problem debtors Colombia, India, and Korea.27
IV. Concluding Remarks Non-oil export growth in the 1980s constitutes the highlight of Indonesia's recent trade experience. Diversification of both export products and markets allowed Indonesia to gain more stable foreign exchange earnings to finance external debt and import payments. However, the rapid growth in capital imports after 1986, combined with Indonesia's rising debt indicators, may form a less enviable aspect of Indonesia's 16
macroeconomic and trade experience.
Other developing countries may aim to
replicate the rapid growth of labor-intensive manufactured exports without such heavy reliance on imported capital and foreign borrowing. Indonesia's accelerated debt accumulation after 1986 reflects increased foreign borrowing to offset the oil revenue shortfall, higher dollar debt values following world exchange rate realignments, and a sharp increase in short-term borrowing as domestic investment opportunities proliferated following industrial and financial deregulation. A surge in private savings after 1986 contributed to strong investment growth and improvements in the current account. While rising debt indicators brought Indonesia closer to standards set by problem debtors, Indonesia recorded higher economic growth rates and better debt repayment records than other debtor countries. Indonesia's experience demonstrates that despite a demanding international environment, sensible policy reforms can help developing countries to achieve impressive economic performances.
17
References Akiyama, T. and P. Verangis (1990), "The Impact of the International Coffee Agreement on Producing Countries," The World Bank Economic Review 4(2): 157173. Balassa, B. (1988), "The Lessons of East Asian Development: An Overview," Economic Development and Cultural Change 36(4S): 273-290. Cole, D. and B. Slade (1991), "Reform of Financial Systems," in D. Perkins and M. Roemer (eds.), Reforming Economic Systems in Developing Countries, Cambridge, MA: Harvard University Press, pp. 313-340. Collins, S. and W. Park (1989), "External Debt and Macroeconomic Performance in South Korea," in J. Sachs and S. Collins (eds.) Developing Country Debt and Economic Performance Vol.3, Chicago: The University of Chicago Press, pp. 151-369. Cuddington, J. (1986), "Capital Flight: Estimates, Issues, and Explanations," Princeton Studies in International Finance No. 58. General Agreement on Tariffs and Trade (1991), Trade Policy Review: Indonesia, Geneva: GATT. Hill, H. (1990), "Indonesia's Industrial Transformation," Parts I and II, Bulletin of Indonesian Economic Studies 26(2&3): 79-120 & 75-109. Intal, P. (1992), "Real Exchange Rates, Price Competitiveness and Structural Adjustment in Asian and Pacific Economies," Asian Development Review 10(2): 86123. International Monetary Fund, International Financial Statistics, Washington, DC: IMF, various issues. Lazard Freres et Cie, Lehman Brothers, and S.G. Warburg & Co. Ltd. (1990), "The Republic of Indonesia," Mimeo. Lee, C. and S. Naya (1988), "Trade in East Asian Development with Comparative Reference to Southeast Asian Experiences," Economic Development and Cultural Change 36(3): 123-152. Lewis, J. and M. McPherson (1993), "Lessons for Africa from Asian Development: The Role of Macroeconomic Management," Cambridge, MA: Harvard Institute for International Development, Mimeo. 18
Lindsay, H. (1989), "The Indonesian Log Export Ban: An Estimation of Foregone Export Earnings," Bulletin of Indonesian Economic Studies 25(2): 111-123. Manning, C. (1992), "Survey of Recent Developments," Economic Studies 28(1): 3-38.
Bulletin of Indonesian
Rodgers, Y. (1993), "Empirical Investigation of One OPEC Country's Successful NonOil Export Performance," Harvard Institute for International Development, Development Discussion Paper No. 474. Salehi-Isfahani, D. (1989), "Oil Exports, Real Exchange Rate Appreciation, and Demand for Imports in Nigeria," Economic Development and Cultural Change 37(3): 495-512. Thorbecke, E. (1991), "The Indonesian Adjustment Experience in an International Perspective," Institute for Policy Reform Working Paper Series. Woo, W. and A. Nasution (1989), "Indonesian Economic Policies and Their Relation to External Debt Management," in J. Sachs and S. Collins (eds.) Developing Country Debt and Economic Performance Vol.3, Chicago: The University of Chicago Press, pp. 17-149. World Bank (1993), The East Asian Miracle: Economic Growth and Public Policy, New York: Oxford University Press. World Bank, World Debt Tables, Washington, DC: The World Bank, various issues. World Bank, World Tables, Baltimore, MD: The Johns Hopkins University Press, various issues.
19
TABLE 1:
INDONESIAN MACROECONOMIC INDICATORS, 1970-1990
Panel A: Average Levels in Sub-Periods 1970-72 1973-78 1979-81 Population (millions) GDP/Capita (US$) Exchange Rate (rp/$) Real Exchange Rate Index Money Market Interest Rate
1982-85
1986-90
122.5
134.4
147.3
159.8
174.9
80.4
254.8
486.3
555.8
504.1
389.9
419.5
627.3
926.8
1645.0
85.4
67.2
82.4
88.8
178.3
na
10.7
14.1
14.8
13.9
Panel B: Average Annual Rates of Change in Sub-Periods 1970-72 1973-78 1979-81 1982-85 Indonesian Real GDP Asian Real GDP Consumer Price Index Money + Quasi Money Oil Price
1986-90
8.0%
7.9%
8.0%
4.0%
6.3%
6.9%
6.1%
5.2%
6.9%
7.1%
7.8%
21.7%
15.5%
9.1%
7.4%
44.1%
33.2%
36.8%
24.5%
29.9%
22.2%
43.2%
39.2%
-5.6%
-2.4%
Panel C: Average Annual Ratios in Sub-Periods 1970-72 1973-78 1979-81
1982-85
1986-90
Debt Service /Exports Debt Service /GDP Total Exports /GDP Non-Oil Exports /GDP Total Imports /GDP Current Account /GDP Govt Expenditures /GDP Govt Revenues /GDP Govt Borrowing /GDP Govt Borrowing /Expenditures
17.4%
16.6%
15.9%
22.5%
40.7%
2.4%
3.8%
4.7%
5.3%
9.1%
13.8%
23.5%
29.3%
23.7%
22.3%
7.8%
7.5%
8.0%
5.9%
12.2%
12.3%
14.9%
14.5%
16.1%
16.6%
-3.5%
-1.6%
1.8%
-4.3%
-2.7%
15.1%
21.2%
25.0%
22.9%
22.1%
11.8%
17.4%
21.5%
19.0%
16.4%
3.3%
3.7%
3.5%
3.9%
5.8%
21.7%
17.4%
14.0%
17.1%
26.1%
Notes: Real Asian GDP is an average for 19 Asian LDCs; money market rate for 1970-74 not available; real exchange rate base year 1985; imports and exports are for merchandise trade only. Government budget figures cover fiscal years. Sources: Indonesian Bureau of Statistics; The World Bank, World Debt Tables and World Tables; International Monetary Fund, International Financial Statistics; Woo and Nasution (1989); Lazard Freres et Cie (1990).
20
TABLE 2:
INDONESIAN GDP COMPOSITION AND REAL GROWTH, 1970-1990
Panel A: Structure of Production (Average Shares of GDP) 1970-72 1973-78 1979-81 1982-85 Agriculture /GDP Industry /GDP Services /GDP
1986-90
42.0%
31.1%
24.9%
23.2%
23.4%
21.6%
33.0%
40.2%
38.2%
36.8%
36.4%
35.8%
34.9%
38.6%
39.8%
10.1%
10.4%
12.2%
13.8%
18.0%
Panel B: Average Annual Real Growth in Production 1970-72 1973-78 1979-81 1982-85
1986-90
(Manufacturing /GDP)
Agriculture
3.8%
4.0%
6.1%
3.0%
3.2%
Industry
12.9%
9.9%
5.6%
4.3%
7.0%
Services
7.0%
9.3%
9.9%
5.9%
7.3%
Total GDP
8.0%
7.9%
8.0%
4.0%
6.3%
(Manufacturing)
9.1%
14.0%
15.7%
14.6%
10.7%
Panel C: Structure of Demand (Average Shares of GDP) 1970-72 1973-78 1979-81 1982-85
1986-90
Private Consumption Gross Domestic Investment Government Consumption Net Exports Panel D:
67.0%
59.0%
60.1%
56.7%
16.1%
19.4%
23.9%
27.7%
32.6%
9.0%
10.2%
11.0%
10.8%
9.5%
-2.5%
3.4%
6.1%
1.4%
1.2%
1982-85
1986-90
Average Annual Real Growth in Demand 1970-72 1973-78 1979-81
Private Consumption Gross Domestic Investment Government Consumption Net Exports Total GDP
77.4%
2.8%
4.3%
4.8%
5.6%
4.5%
26.7%
9.8%
24.0%
2.6%
12.3%
16.4%
14.0%
6.4%
4.5%
1.6%
-16.0%
261.6%
-4.4%
185.7%
-88.8%
8.0%
7.9%
8.0%
4.0%
6.3%
Notes: Industry includes mining, manufacturing, construction, and utilities. Services include trade, transport, communication, financial services, and other community services. Sources: The World Bank, World Tables, International Monetary Fund, International Financial Statistics.
21
TABLE 3:
COUNTRY COMPARISONS OF DEBT INDICATORS, 1970-1990
Panel A:
Average Annual Total External Debt to Export Ratios 1970-72 1973-78 1979-81 1982-85
1986-90
Indonesia
288.2%
154.9%
101.4%
141.2%
248.8%
Problem Debtors: Mexico Nigeria Philippines
232.7% 45.0% 117.7%
303.0% 28.7% 135.2%
298.2% 54.4% 232.5%
325.8% 150.5% 337.9%
347.4% 348.5% 291.8%
No Problem Debtors: Colombia India Korea
169.7% 365.0% 159.9%
135.3% 235.8% 103.9%
156.1% 186.9% 132.4%
271.1% 270.7% 140.0%
244.6% 327.5% 65.8%
Average Annual Total External Debt to GDP Ratios 1970-72 1973-78 1979-81 1982-85
1986-90
Panel B: Indonesia
42.2%
35.2%
30.0%
34.2%
59.3%
Problem Debtors: Mexico Nigeria Philippines
15.1% 4.4% 24.2%
22.8% 5.1% 28.9%
30.3% 11.1% 53.5%
54.6% 21.6% 76.2%
59.9% 95.1% 79.5%
No Problem Debtors: Colombia India Korea
23.3% 14.3% 26.2%
21.7% 13.8% 31.2%
21.9% 12.4% 43.3%
32.1% 16.9% 49.2%
43.7% 22.7% 25.0%
Average Annual Real GDP Growth Rates 1970-72 1973-78 1979-81
1982-85
1986-90
Panel C: Indonesia
Problem Debtors: Mexico Nigeria Philippines No Problem Debtors: Colombia India Korea
8.0%
7.9%
8.0%
4.0%
6.3%
6.7% 10.6% 5.2%
5.9% 4.2% 6.2%
8.8% 0.4% 4.7%
0.4% -0.1% -2.3%
1.3% 3.8% 4.5%
6.9% 2.1% 8.2%
5.3% 4.8% 11.2%
3.9% 2.6% 3.7%
2.4% 5.1% 8.9%
4.6% 5.8% 10.2%
Note: Exports include goods and services. I chose the sample from lists of moderately and severely indebted countries, and countries with debt servicing problems in the 1980s, in the World Bank, World Debt Tables. Sources: International Monetary Fund, International Financial Statistics; The World Bank, World Tables and World Debt Tables.
22
TABLE 4:
EXTERNAL DEBT AND DOMESTIC SAVINGS, 1970-1990
Panel A: External Debt Decomposition (Millions US$)
Total Net Debt Flow Current Account Deficit Foreign Exchange Accumulation Other Net Long Term Capital Outflows Other Net Short Term Capital Outflows Discrepancies Direct Foreign Investment
1970-72
1973-78
1979-81
1982-85
1986-90
2,056
9,429
4,323
10,580
22,550
1,016
3,358
-3,425
15,441
11,502
324
2,247
3,676
-179
2,260
1,283
2,125
-763
-3,961
2,654
-173
3,000
5,373
270
8,643
35
-1
1
58
485
-429
-1,300
-539
-1,049
-2,994
Panel B: Domestic Savings (Billions Rupiah)
Private Savings Public Savings Gross Domestic Investment Current Account Deficit
1970-72
1973-78
1979-81
1982-85
1986-90
1,097
8,853
19,308
45,014
155,820
398
6,994
16,346
32,076
69,732
1,892
17,279
33,513
90,414
243,839
397
1,432
-2,141
13,324
18,287
Panel C: Domestic Savings (GDP Shares) 1970-72
1973-78
1979-81
1982-85
1986-90
Private Savings
9.3%
10.0%
13.8%
13.6%
20.5%
Public Savings
3.3%
7.8%
11.8%
9.7%
9.5%
16.1%
19.4%
23.9%
27.7%
32.6%
3.5%
1.6%
-1.8%
4.3%
2.7%
Gross Domestic Investment Current Account Deficit
Notes: Sub-period figures in Panels A and B are cumulative. Discrepancies include rounding errors, recent World Bank debt flow corrections for 1970 and 1983-1990, and recent IMF balance of payments corrections for 1989 and 1990. Total net debt flows include long- and short-term debt. Sources: International Monetary Fund, International Financial Statistics; The World Bank, World Debt Tables and World Tables.
23
TABLE 5:
COST OF FOREIGN CAPITAL, 1986-1990
(a) (b) (c) (d) (a-b-c) (b+c-d) Indonesian Foreign Exchange Interest Real Cost Lending Interest Rate Domestic Rate of Foreign Year Rate Rate Depreciation Inflation Difference Borrowing ----------------------------------------------------------------------1986 21.5 6.9 15.5 5.9 -0.9 16.4 1987 21.7 7.2 28.2 9.2 -13.7 26.2 1988 22.1 8.0 2.5 8.0 11.6 2.5 1989 21.7 9.3 5.0 6.5 7.4 7.8 1990 20.6 8.3 4.1 7.4 8.2 5.0 Note: The foreign interest rate is the three-month LIBOR on US$ deposits. Source: International Monetary Fund, International Financial Statistics.
24
TABLE 6:
REGIONAL COMPARISON OF EXPORT COMPOSITIONS AND GROWTH, 1970-1990
Panel A:
Average Annual Non-Oil Export Shares of Total Exports 1970-72 1973-78 1979-81 1982-85 1986-90
Indonesia Korea Malaysia Philippines Thailand Panel B:
27.0% 99.6% 76.8% 99.5% 100.0%
24.9% 97.7% 70.3% 98.8% 99.6%
54.4% 98.6% 82.0% 98.1% 99.2%
8.0% 91.3% 25.5% 53.0% 33.1%
28.1% 92.7% 41.7% 60.8% 54.1%
Average Annual Real Non-Oil Export Growth 1970-72 1973-78 1979-81 1982-85
1986-90
Indonesia Korea Malaysia Philippines Thailand Panel D:
33.0% 98.5% 88.7% 99.1% 99.5%
Average Annual Manufactured Export Shares of Total Exports 1970-72 1973-78 1979-81 1982-85 1986-90
Indonesia Korea Malaysia Philippines Thailand Panel C:
57.0% 98.9% 91.8% 98.4% 99.2%
1.7% 80.6% 9.1% 8.0% 11.6%
2.8% 89.8% 19.0% 38.8% 26.9%
5.5% 7.3% 4.2% -6.5% -0.8%
17.2% 14.2% 15.5% 10.6% 23.8%
Average Annual Real Manufactured Export Growth 1970-72 1973-78 1979-81 1982-85
1986-90
Indonesia Korea Malaysia Philippines Thailand
6.2% 34.1% -2.6% -4.9% 17.9%
1.6% 85.3% 15.6% 21.6% 19.0%
51.0% 40.3% 18.9% 4.5% 65.6%
15.8% 28.5% 14.5% 10.8% 14.2%
-4.2% 6.0% -1.1% 6.8% 6.9%
23.0% 29.5% 27.0% 37.2% 22.2%
32.4% 7.0% 6.1% 17.8% 11.8%
28.1% 8.2% 14.5% -0.8% 8.7%
31.4% 14.2% 21.8% 12.8% 36.7%
Notes: Average annual growth rates are calculated from real export revenues in 1985 U.S. dollars. The annual U.S. producer price index is the non-oil export earnings deflator. Sources: Indonesian Bureau of Statistics; The World Bank, World International Monetary Fund, International Financial Statistics.
25
Tables,
TABLE 7:
AVERAGE ANNUAL REAL TRADE GROWTH, 1975-1990
Panel A: Export Revenues 1975-78 1979-81 1982-85 1986-90 -------------------------------------------------------------------------Oil and Gas 11.9% 0.1% -6.9% 2.3% Non-Oil Exports Agriculture Rubber Fish & Shrimp Coffee Vegetable Oils Tea, Spices, Cocoa Other Agriculture Mining & Wood Sand, Clay, Coal Tin Aluminum Metal Ores Logs Sawnwood
19.4%
-4.2%
5.5%
17.2%
21.3% 18.4% 21.8% 60.2% 3.8% 24.2% 6.5%
-10.0% -6.0% -7.0% -20.4% -24.5% -8.4% 2.2%
5.6% -4.9% 2.2% 11.3% 32.1% 10.9% 5.5%
4.8% 1.1% 29.9% -9.8% -2.1% 3.5% 9.3%
15.7% -5.7% 47.5% 4.3% -17.4% 17.3% 31.1%
-4.8% 52.4% 3.9% 36.5% 28.7% -19.7% 21.5%
-11.9% 38.0% -15.2% 350.7% -7.5% -68.5% -0.1%
5.3% 26.8% -8.6% -5.3% 17.3% -100.0% 0.9%
Manufactures 28.9% 32.4% 28.1% 31.4% Plywood 165.0% 81.0% 45.7% 23.3% Textiles & Garments 58.5% 64.8% 43.0% 34.7% Footwear 60.8% 25.3% 25.8% 129.7% Chemicals 23.8% -6.1% 32.8% 21.3% Machinery & Equipment 22.5% 15.8% -11.8% 27.1% Other 19.9% 33.8% 4.8% 45.2% ========================================================================== Total Exports 13.6% -0.9% -3.7% 7.9% Panel B: Import Expenditures 1975-78 1979-81 1982-85 1986-90 -------------------------------------------------------------------------Oil and Gas 28.6% 4.8% -2.4% 13.8% Non-Oil Imports Agriculture Minerals, Mining, Wood
4.1%
10.5%
-7.3%
14.5%
15.9%
-1.9%
-13.8%
9.6%
8.7%
32.6%
9.7%
24.3%
Manufactures 1.6% 13.3% -6.6% 14.8% Chemicals & Plastics -7.9% 18.1% 0.8% 9.4% Metals -0.9% 15.7% -9.5% 8.3% Industry Specific Mach. -5.4% 17.7% -10.7% 38.3% Motor Vehicles 7.4% -9.1% -33.4% 2.4% Other Machinery & Equip. 5.8% 16.1% -3.2% 14.4% Other Manufactures 8.6% 13.8% -12.5% 20.0% ========================================================================== Total Imports 6.2% 9.8% -6.7% 14.4% Notes: The table calculates average annual growth rates from real export revenues (import expenditures) in 1985 U.S. dollars. The annual U.S. producer price index deflates non-oil exports (imports), and the official Indonesian oil price deflates oil exports (imports). Metal ores include other metals. Sources: Trade data from Indonesian Bureau of Statistics; price deflators from International Monetary Fund, International Financial Statistics.
26
30
25
20
15
10
5
0
1975 1976 1977 1978 1979 1980 1981 1982 1983 1984 1985 1986 1987 1988 1989 1990
Agriculture Manufactures
Mining & Wood Oil & Gas
Figure 1: Level and Composition of Total Export Earnings (constant 1985 US$) 9 8 7 6 5 4 3 2 1 0
1975 1976 1977 1978 1979 1980 1981 1982 1983 1984 1985 1986 1987 1988 1989 1990 Plywood
Textiles & Garments
Footwear
Chemicals
Machinery & Equipment
Other Manufactures
Figure 2: Level and Composition of Manufactured Export Earnings (constant 1985 US$)
Sources: Indonesian Bureau of Statistics; International Monetary Fund. 27
3.5
3
2.5
2
1.5
1
0.5
0
1975 1976 1977 1978 1979 1980 1981 1982 1983 1984 1985 1986 1987 1988 1989 1990
Sand,Clay,Coal Metal Ores
Tin Logs
Aluminum Sawnwood
Figure 3: Level and Composition of Mining & Wood Export Earnings (constant 1985 US$) 5
4
3
2
1
0
1975 1976 1977 1978 1979 1980 1981 1982 1983 1984 1985 1986 1987 1988 1989 1990
Rubber
Fish & Shrimp
Coffee
Vegetable Oils
Tea,Spices,Cocoa
Other Agriculture
Figure 4: Level and Composition of Agricultural Export Earnings (constant 1985 US$)
Sources: Indonesian Bureau of Statistics; International Monetary Fund. 28
20
15
10
5
0
1975 1976 1977 1978 1979 1980 1981 1982 1983 1984 1985 1986 1987 1988 1989 1990
Manufactures Mining & Wood
Agriculture Oil and Gas
Figure 5: Level and Composition of Total Import Expenditures (constant 1985 US$) 20
15
10
5
0
1975 1976 1977 1978 1979 1980 1981 1982 1983 1984 1985 1986 1987 1988 1989 1990 Chemicals, Plastics
Metals
Industrial Machines
Motor Vehicles
Other Machinery
Other Manufactures
Figure 6: Level and Composition of Manufactured Import Expenditures (constant 1985 US$)
Sources: Indonesian Bureau of Statistics; International Monetary Fund. 29
Notes 1. See, for example, Balassa (1988), Lee and Naya (1988), and the World Bank (1993). 2. The world oil price index, base year 1985, rose from 5.8 to 126.4 between 1970 and 1981, dropped from 126.7 to 100 between 1982 and 1985, and rose slightly from 64.7 to 77.8 between 1986 and 1990. 3.
See Woo and Nasution (1989) for earlier performance figures.
4. See Lewis and McPherson (1993) and Salehi-Isfahani (1989) for discussion on Nigeria. 5.
See Thorbecke (1991), p.21.
6. In real terms, dollar non-oil exports grew more rapidly than rupiah GDP between 1982 and 1985; however, the average non-oil export/GDP ratio declines relative to the 1979-81 period. The non-oil export/GDP, as well as the other trade and debt to GDP ratios, is calculated as the nominal dollar export value, relative to nominal rupiah GDP converted into dollars. If rupiah and dollar deflators are included in the ratio calculations, then the real non-oil export/GDP ratio increases from 5.2 percent in 1979-1981 to 5.4 percent in 1982-1985. 7. The government controlled prices of rice, cement, kerosine, tap water, gasoline, electricity, transport (city, air, and sea), and telephone service. These goods and services constitute approximately 23 percent of the consumer price index basket. 8.
See Manning (1992), p.29, for employment figures.
9.
See Intal (1992) on Japanese foreign direct investment in Asia.
10.
See Hill (1990), p. 79, for foreign ownership figures.
11. Using a different sample that includes African and more Asian countries, Lewis and McPherson (1993) also shows that most countries experienced higher debt/GDP ratios in the late 1980s relative to the early 1970s. 12.
See Lewis and McPherson (1993).
13.
See Collins and Park (1989), pp. 175-176.
14. Often change in stock figures do not match the flow figures (disbursement minus amortization) because the World Bank uses end of period conversion factors for stocks and period average conversion factors for flows. Discrepancies are 30
particularly large with sharp changes in the exchange rates. 15.
For discussion of capital flight estimation see Cuddington (1986).
16.
See Cole and Slade (1991) on Indonesian capital flight.
17. I assume commercial bank short-term flows are included in the other short-term capital flows category. 18.
See Cuddington (1986).
19.
See Collins and Park (1989), pp. 176-177.
20.
See Collins and Park (1989), p. 234, for discussion of the stylized facts.
21.
See Rodgers (1993) for Indonesian non-oil export determinants by sector.
22. Indonesia's annual real effective exchange rate index averages 251.7 for 198690 (1975=100), compared to 126.9 for Malaysia, 120.9 for the Philippines, 117.8 for Thailand, and 92.4 for Korea. Calculated from data in Intal (1992), pp. 93-94. 23.
See GATT (1991) and Lindsay (1989).
24. The main types of sawnwood exported by Indonesia are agathis, keruing, meranti, ramin, and teak, all greater than 5 mm in thickness. 25.
See Akiyama and Verangis (1990) on the International Coffee Agreement.
26.
See Woo and Nasution (1989).
27. See International Monetary Fund, International Financial Statistics Yearbook 1992, pp. 138-139.
31