found that the highway alignments retrieved from the stereo IKONOS images ... The remote sensing technique has been used in transportation engineering ...
CSCE 2009 Annual General Conference Congrès annuel générale annuelle SCGC 2009 St. John’s, Newfoundland and Labrador / St. John’s, Terre-Neuve et Labrador May 27-30, 2009 / 27-30 mai 2009
DEVELOPMENT OF 3D HIGHWAY VISUALIZATION MODEL USING STEREO IKONOS SATELLITE IMAGERY 1
2
2
Wai Yeung YAN , Ahmed SHAKER and Said M. EASA 1 Ph.D. Candidate, Department of Civil Engineering, Ryerson University, Toronto, Canada 2 Faculty Advisors, Department of Civil Engineering, Ryerson University, Toronto, Canada
Abstract: The study aims to investigate the use of stereo high resolution satellite imagery for constructing accurate three-dimensional (3D) highway visualization model. A stereo-pair from IKONOS satellite images (1 m resolution) are geo-referenced by using a polynomial-based generic pushbroom model using a number of tie points and Ground Control Points (GCP) acquired by Global Positioning System (GPS) measurements. Using digital imagery for the City of Hong Kong, highway alignments are extracted semiautomatically using stereoscopic measurements and a 3D digital model along the highway is constructed. To assess the accuracy of the information extracted from the stereo IKONOS, the same highway alignments are extracted from stereo aerial images (12.5 μm resolution) for comparative analysis. It is found that the highway alignments retrieved from the stereo IKONOS images result in less than 0.8m Root Mean Squared (RMS) error in the horizontal and vertical directions for loop and direct ramps of an interchange. With the competitive meter-level accuracy, stereo satellite images proved to be a viable alternative for constructing digital 3D highway models.
1. Introduction The remote sensing technique has been used in transportation engineering applications since 1970s (Bajcsy and Tavaloki 1976, Quam 1978). The technique has been gradually adopted because of its merit in a wide coverage of area and high spatial and temporal resolutions. Early research works focused on using low resolution satellite sensors like, Landsat MSS/TM images for road feature recognition. With the rapid development in sensor technology, satellite sensor data are acquired for a wide range of transportation applications, including maintenance and rehabilitation of highways (Beaumont, 1985), detection of land and pavement boundaries (Ma et al. 2000), road traffic analysis (Angel et al. 2003), and the study of vehicle position, speed, and direction (Xiong and Zhang 2008). Among different applications, the extraction of highway geometry gained high interest from computer vision and pattern recognition parties. Mena (2003) has carried out a comprehensive review of the automatic road extraction techniques with nearly 250 related bibliographies by classifying the work in terms of preset objectives and extraction techniques. Experimental research works have initially focused on the extraction of linear features like road network (Barzohar and Cooper 1996) where geometric techniques, segmentation, and vectorization are adopted in the process. The increase in the spatial resolution and the enhancement of the multi-sensor technologies offer fruitful information in terms of spectral and spatial contexts. Highway geometric parameters, such as horizontal alignments and spiral curves, can be extracted from satellite imagery (Easa et al. 2007, Dong et al. 2007). Whilst the above techniques could fulfill the necessities in numerous transportation applications, the GC-033-1
results derived have been in two-dimensional (2D) space without the elevation information. Easa et al. (2002) stated the importance of the third dimension information in transportation engineering applications. Nevertheless, stereoscopic analysis is still one of the less used techniques in extracting 3D highway information for transportation applications. Initial experimental works appeared in Baltsavias et al. (2001) and Zhang and Baltsavias (2002) who focused on man-made feature extraction for urban city construction. Fraser et al. (2002) adopted stereo IKONOS images to extract 3D point positioning and building reconstruction. This paper evaluates the possibilities of extracting accurate 3D highway alignment parameters using stereo IKONOS images. The accuracies of the horizontal and vertical alignments of loop and direct ramps at an interchange extracted from stereo IKONOS images are assessed with respect to the information extracted from the corresponding stereo aerial images. Finally, a digital 3D model of the highway and the surrounding buildings are constructed.
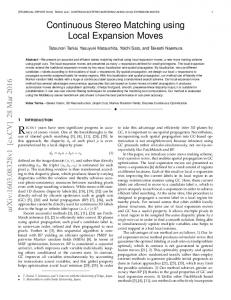
2. Methodology Figure 1 shows the proposed methodology of the study. The stereo IKONOS satellite images are georeferenced by using a polynomial-based generic pushbroom model (Leica Geosystems 2008) using a number of tie points and Ground Control Points (GCP) acquired by Global Positioning System (GPS) measurements. After the sensor orientation, a digital elevation model (DEM) and orthoimage are generated and the 3D highway alignments are extracted using the stereoscopic measurements. The extracted alignments and other geographic features are used to construct a digital 3D model for visualization. Due to the lack of existing GIS road database, there is no reference data to assess the accuracy of the 3D highway alignments extracted from the stereo IKONOS images. As such, stereo aerial images covering the same study area are used to extract the same highway alignments for comparative analysis. The interior orientation is first performed to construct an image coordinate system for the aerial photos by providing image information such as focal length and location of fiducial marks. For the exterior orientation, the relationship between the image space and the object space are constructed using the collinearity equation with the same GCP acquired for stereo IKONOS images. Using the geo-referenced aerial images, DEM and orthoimage are generated and a stereo anaglyphic view is constructed to extract the same 3D highway alignments. A comparative analysis is carried out to assess the difference between the alignments extracted from the stereo IKONOS images and those extracted from the stereo aerial images. The differences in horizontal and vertical directions are assessed in terms of the minimum, maximum, mean, standard deviation, and root mean squared (RMS) errors. To avoid abnormal observations in the extracted data, the outliers are computed to eliminate the mild outliers. The horizontal and vertical accuracies of the 3D highway alignments are presented in terms of the RMS errors.
3. Study Area and Dataset The study area is a 500m x 500m located at the intersection between the Prince Edward Road East and Kwun Tong Road in the Kowloon Peninsula of the Hong Kong Special Administrative Region (HKSAR). It is one of the busiest carriageways to connect the east and the central of the Kowloon Peninsula in Hong Kong. The study area has low elevation levels (range from 5-35 m above the mean sea level) since it is close to the old airport (Kai Tak airport). The interchange in the area of interest includes a number of highways that consist of different direct ramps, loop ramps and spiral curves. Figure 3 shows the location of the study area in the Hong Kong Special Administrative Region. Two datasets were used in this study. First, two clouds-free IKONOS Panchromatic satellite images covering the study area were used to extract the geometric parameters of the selected loop and direct
GC-033-2
ramps at the interchange. The spatial, spectral, and radiometric resolutions of the pair of images are 1 m, 0.45-0.90 μm, and 11 bit, respectively. The nominal collection azimuths of the two images are 346.7620º and 160.9128º, and the nominal collection elevations are 70.97340º and 62.66803º. The two IKONOS rd th satellite images are acquired from different orbits in different dates (23 and 29 November 2000) with base-to-height (B/H) ratio of 0.87 which is appropriate to produce a high quality stereo model with appropriate elevation accuracy. Both images are projected in UTM zone 50N with WGS84 datum. Second, two stereo images of aerial photographs taken at flying height of 4,000 ft and covering the same area of interest were used. The resolution of the stereo aerial images is 12.5μm. The stereo aerial images were ordered from the Survey and Mapping Office, Lands Department of the Government of the HKSAR. th Although the acquisition date is the 19 September 2006, no major development or enhancement has been made for the highway intersections since 2000 (when the IKONOS image were acquired). Therefore, the two aerial images are used to generate a stereo model to assess the accuracy of the stereo model generated by the IKONOS images. The positions of the Ground Control Points (GCP) were acquired using the static Global Positioning System (GPS) technique (Shaker et al. 2004). A total number of 15 well-distributed GCP were observed. Some of these points are corners of pedestrian lanes and others are road intersections or intersections between roads and canals. The GPS position data are corrected by post-processing using Leica Ski-Pro software. The coordinates from GPS measurements are projected to the HK1980 grid coordinate system. The accuracy of the processed GCP is less than 5 cm in the horizontal direction and less than 10 cm in the vertical direction. More details on the GPS measurements can be found in Shaker et al. (2004).
4. Experimental Work ERDAS Leica Photogrammetry Suite (LPS) version 9.2 is utilized to construct the relationship between the image space and the ground space for both of the datasets (the stereo IKONOS images and the stereo aerial images). Details on the information provided to the LPS are shown in Table 1. Table 1. Input information for the stereo IKONOS and aerial images
Projection System Focal Length Flying Height Principal Points Onboard pixel size Sensor Columns Polynomial Orders Radial Lens Distortion Fiducial Marks a Not applicable.
Stereo IKONOS Images Hong Kong 1980 Grid System 10 m 680 km (0,0) 0.012 mm 13500 2nd order for X,Y,Z and kappa a n.a. n.a.
Stereo Aerial Images Hong Kong 1980 Grid System 153.387 mm 4,000 ft (0,0) n.a. n.a. n.a. 1 mm 8
After providing the input information for both stereo images, it is required to provide a certain number of GCP and tie points on both of the stereo pair images so that the relationship between the image and the ground space can be established. There are a total of 15 GCP digitized and imported on both of the satellite images and only 3 of them can also be identified on the aerial images. Also, 15 and 6 tie points are digitized on both of the stereo satellite images and stereo aerial images, respectively, to improve the quality of the constructed 3D model. These tie points are visually defined at the sharp intersection of roads/pavements or the high contrast corner of building edges. With the sufficient number of GCP and tie points on the stereo IKONOS and aerial images, block triangulation is performed to establish the relationship between the image and the ground space. It is found that the RMS errors of the GCP on the ground and the image are within centimeters and less than GC-033-3
a pixel, respectively. Concerning the stereo aerial images, the RMS errors in X and Y directions are less than 20cm and the error reaches 44 cm in the Z direction. The relatively high values of the RMS errors of the exterior orientation of the aerial images can be explained due to the limited number of GCP (only three GCP are used for the aerial images, where one of them could not be easily identified and the GCP were originally observed for the IKONOS images in a lower resolution). Generally, the result of the stereo aerial images is still acceptable. Having acceptable accuracy of the exterior orientation process, the stereo models established from the IKONOS images and aerial images are used to extract the 3D highway parameters and generate the digital elevation model (DEM) and orthoimage. Stereo measurements and 3D highway parameter extraction were done by creating an anaglyph using Stereo Analyst in ERDAS IMAGINE. With the help of red-blue glasses, the geo-referenced stereo images can be viewed in 3D and measurements along the ramps of the interchange can be performed. Figure 3 shows a snap shot of the anaglyphic view from the stereo IKONOS images. The extraction of the highway alignments starts from the ground level where the x-parallax can be easily adjusted with the sidewalk or road marking. The process carries on by digitizing the edge of the highway and readjusting the x-parallax so as to reflect the correct elevation at each point. The vertices of the alignment are continuously digitized while: (1) there are any changes in the elevation where x-parallax is refined or (2) there are any changes in geometry of the highway, such as the beginning of the spiral or the circular curve. During the digitization of the highway alignments, it is sometimes difficult to adjust the x parallax by identifying outstanding features on the edge or the shoulder of the highway from both of the images. The road marking or signage on the lane can assist in adjusting the parallax where it represents the elevation level of the highway alignment. As the resolution of the stereo aerial images is significantly higher than that of the IKONOS images, the shoulder of the highway is clearer especially where shadow may affect the identification of the edge of the highway. Again, the x-parallax is adjusted using the road marking on the carriageway lane. Some of the nearby buildings are extracted to offer better visualization for the construction of the digital 3D model of the interchange. The extracted alignment information of the interchange and buildings are exported as ASCII file and 3D shapefile for further data analysis.
4. Results and Analysis Two carriageways, a loop ramp (carriageway of Prince Edward Road East) and a direct ramp (carriageway of Kwun Tong Bypass), are selected for data analysis to assess the accuracy of the highway alignments that can be extracted from the stereo IKONOS satellite images. The highway alignments extracted from the stereo aerial images are used as the reference to assess accuracy of the extracted information from the stereo IKONOS images. The highway alignments are represented by a horizontal profile and a vertical profile. The assessment of the accuracy of the alignments extracted from the stereo IKONOS is made by measuring the difference between the two alignments extracted from the stereo IKONOS and the stereo aerial images. Figure 4 shows the projected horizontal alignments of the circular curve of the loop ramp of the Prince Edward Road East and the direct ramp of the Kwun Tong Road. The offset distance from the alignments extracted from the stereo aerial images to each corresponding location extracted from the stereo IKONOS images are determined and regarded as the error of the horizontal alignment at that location. Table 2 shows a summary of the results in terms of the minimum, maximum, mean, standard deviation and RMS errors. The results show that the minimum horizontal errors are in centimeter-level for both the ramps and the maximum errors reach 1.8 m and 4 m for the direct and loop ramps, respectively. The overall horizontal accuracy extracted from the stereo IKONOS images is presented in terms of the RMS error which is found as 1.277 m for the loop ramp and 0.777 m for the direct ramp. A close look at the data observed shows that there are a few outliers that might lead to a bias in the accuracy assessment. The outliers are resulted from the misidentification of the corresponding points extracted from the stereo IKONOS and aerial images. The outliers are computed statistically by first defining the lower quartile (the break point of the data in 25%) and the upper quartile (the break point of the data in 75%) assuming a normal distributed of the dataset. By computing the
GC-033-4
interquartile range, which is the difference between the upper and lower quartiles, the lower inner fence and upper inner fence are defined by using the following formulas: [1]
Lower inner fence = ( Q 3
Q1 )
k (Q 1 )
[2]
Upper Inner fence = ( Q 3
Q1 )
k (Q 3 )
where ( Q 3
Q 1 ) is the inner quartile, Q 3 is the upper quartile, Q 1 is the lower quartile, and k is a
constant (usually 1.5). Any observation beyond the inner fence is considered as a mild outlier. Table 3 shows the results computed using Eqs. 1 and 2. It is found that only one point (4.287 m for the loop ramp and 1.769 m for the direct ramp) exceeds the upper inner fence and stands out as a mild outlier. This outlier measurement appeared at the end of the loop and the direct ramps. The outlier exists because it is difficult to locate the same feature point at the end of the ramps on both images of the stereo during stereoscopic extraction. As such, the statistics of the errors is re-computed by omitting the mild outlier for ramps. Table 4 shows the re-computed results. The RMS errors for both the ramps are both within 0.8 m and the maximum errors are only 1.342 m and 1.187 m, respectively. The results reveal that less than one-pixel horizontal accuracy can be achieved by using the stereo satellite images for highway extraction. Table 2. Comparison of the horizontal alignments extracted from the stereo IKONOS images and stereo aerial images
Min. Error Max. Error Mean Standard Deviation RMS Error
Loop Ramp (Prince Edward Road East) 0.017 m 4.287 m 0.858 m 0.974 m 1.277 m
Direct Ramp (Kwun Tong Bypass) 0.064 m 1.769 m 0.693 m 0.358 m 0.777 m
Table 3. Outlier computation for horizontal alignments
Lower Quartile Range Upper Quartile Range Inter Quartile Range Lower Inner Fence Upper Inner Fence
Loop Ramp (Prince Edward Road East) 0.268 m 0.884 m 0.616 m -0.657 m 1.809 m
Direct Ramp (Kwun Tong Bypass) 0.420 m 0.871 m 0.452 m -0.258 m 1.549 m
Table 4. Revised computation of horizontal alignments
Min. Error Max. Error Mean Standard Deviation RMS Error
Loop Ramp (Prince Edward Road East) 0.017 m 1.342 m 0.644 m 0.424 m 0.764 m
Direct Ramp (Kwun Tong Bypass) 0.064 m 1.187 m 0.658 m 0.302m 0.721 m
Similarly, the vertical accuracy of both ramps extracted from the stereo IKONOS images are assessed with the aid of the information extracted from the stereo aerial images. Figure 5 shows the vertical alignments of the loop and direct ramps and Table 5 shows the error statistics of the vertical alignment. GC-033-5
The loop ramp measurements show that the RMS error is within 0.8 m and the alignments extracted from both the stereo IKONOS images and stereo aerial images are matched in the view of the vertical profile. Concerning the vertical alignment of the direct ramp, it was difficult to identify the corresponding points at the start and the end of the ramp. Table 5 shows that the RMS error is 0.6 m with the maximum error reaching up to 1.380 m. With the re-computation of the outlier amongst the observations shown in Table 6, none of the points exceeds the lower or upper inner fence for the loop ramp. However, two observations (beginning and end of the ramp) with vertical error of 1.335 m and 1.380 m are found as mild outliers for the direct ramp. Therefore, the beginning and the end of the ramp are omitted from the accuracy assessment of the vertical profile of the ramp. Table 7 shows the revised calculation of the error statistics by omitting these two outliers where the RMS error drops from 0.6 m to 0.468 m. Table 5. Comparison of vertical alignments extracted from stereo IKONOS images and stereo aerial images
Min. Error Max. Error Average Error Standard Deviation RMS Error
Loop Ramp (Prince Edward Road East) 0.040 m 1.338 m 0.708 m 0.364 m 0.794 m
Direct Ramp (Kwun Tong Bypass) 0.038 m 1.380 m 0.452 m 0.404 m 0.600 m
Table 6. Outlier computation for vertical alignments
Lower Quartile Range Upper Quartile Range Inter Quartile Range Lower Inner Fence Upper Inner Fence
Loop Ramp (Prince Edward Road East) 0.438 m 0.968 m 0.533 m -0.363 m 1.767 m
Direct Ramp (Kwun Tong Bypass) 0.119 m 0.572 m 0.453 m -0.561 m 1.252 m
Table 7. Revised computation of vertical alignment
Min. Error Max. Error Average Error Standard Deviation RMS Error
Direct Ramp (Kwun Tong Bypass) 0.038 m 1.056 m 0.365 m 0.299 m 0.468 m
5. 3D Highway Visualization Model The highway alignments and building blocks extracted are used to construct a digital 3D model using Google SketchUp Pro and ESRI ArcGIS 9.2. The highway alignments in 3D shapefile format are imported in SketchUp through a SketchUp plug-in for ArcGIS. A cross section of the highway is first created with the drawing tool in SketchUp. The width of the cross section is determined from the alignments extracted for each highway. After orienting the cross section in a perpendicular direction to the 3D highway alignment, the 3D model of the highway is constructed by pulling the cross section along the 3D alignment using the “Follow-Me” tool in SketchUp. The columns of the highway are constructed by extruding the surface of the deck manually. The texture materials and color of the highway can be painted using the “Paint Bucket”. Building polygons can automatically be extruded in SketchUp through the plug-
GC-033-6
in for ArcGIS. To enhance the visualization quality of the digital 3D model, some of the existing GIS data are imported into the 3D models. Figure 6 shows the digital 3D model of the highway interchange.
6. Conclusions This study has evaluated the use of the stereo Very High Resolution (VHR) satellite images to extract 3D highway alignment information. The geometric accuracies of the extracted horizontal and vertical alignments are assessed and a digital 3D model is constructed from the extracted highway, buildings and the DEM. The experiments are carried out with a stereo pair panchromatic IKONOS satellite images in 1 m spatial resolution, and a study area with a number of highway intersection near the Kai Tak Airport in Hong Kong is selected. A generic pushbroom model is used for the satellite sensor modeling using a number of GCP acquired by static GPS measurements. Less than 10-cm RMS error in the x, y, and z directions are achieved from the exterior orientation for the stereo IKONOS images. Different types of highway alignments including loop and direct ramps are extracted by generating anaglyphic view and using red-blue glasses. To assess the accuracy, very high resolution stereo aerial images are used as reference data to extract the same highway alignments. A comprehensive analysis is performed to assess the horizontal and vertical accuracies of the highway alignments extracted from the stereo IKONOS images in comparison with those extracted from the stereo aerial images. The results reveal that the RMS errors are less than 0.8 m in the horizontal direction for a loop ramp of the Prince Edward Road East and the direct ramp of the Kwun Tong Bypass. For the vertical alignment, the RMS error is found to be less than 0.8 m in the loop ramp and near to 0.5 m for the direct ramp. These highway alignments are then used to construct the digital 3D model for the study area. This study presents a viable approach for the extraction of the 3D highway alignments and geometric parameters using stereo satellite images. The extracted 3D highway alignments can provide information regarding the geometric parameters such as the length of alignment, horizontal circular radius, and horizontal spiralled curve parameter. Future experimental work will be conducted to derive the horizontal circular radius for the Prince Edward Road East using regression analysis techniques. It is also anticipated to derive a mathematical representation for the 3D highway alignments. Further applications of the extracted DEM and the constructed digital 3D model can also be explored, such as car driving and visibility analysis.
Acknowledgements The author would like to express his sincere gratitude to Prof. Zhilin Li from the Hong Kong Polytechnic University who provided the IKONOS satellite images from the CERG project “Optimum Compression of One-Meter Satellite Images for mapping purposes”.
References Angel, A., Hickman, M., Mirchandani, P. and Chandnani, D. 2003. Methods of analyzing traffic imagery collected from aerial platforms. IEEE Transactions on Intelligent Transportation systems, 4(2): 99– 107. Barzohar, M. and Cooper, D., 1996. Automatic finding of main roads in aerial images by using geometric– stochastic models and estimation. IEEE Trans. Pattern Anal. Machine Intell. 18: 707–721. Bajcsy, R. and Tavaloki, M., 1976. Computer recognition of roads from satellite picture. IEEE Trans. Systems Man Cybernet. 6: 76–84. Baltsavias, E.P., Gruen, A., Gool, L.V., 2001. Automatic extraction of man-made objects from aerial and space images (III). A.A. Balkema Publishers. Beaumont, T. E. 1985. An application of satellite imagery for highway maintenance and rehabilitation in Niger. International Journal of Remote Sensing, 6(7): 1263–1267.
GC-033-7
Dong, H., Easa, S. and Li, J. 2007. Approximate extraction of spiralled horizontal curves from satellite imagery. Journal of Surveying Engineering, 133(1): 36–40. Easa, S.M., Strauss, T.R., Hassan, Y. and Souleyrette, R.R. 2002. Three-dimensional transportation analysis: planning and design. Journal of Transportation Engineering, 128(3): 250–258. Easa, S. M., Dong, H., and Li, J. 2007. Use of satellite imagery for establishing road horizontal alignments. Journal of Surveying Engineering, 133(1): 29–35. Fraser, C.S., Baltsavias, E. and Gruen, A. 2002. Processing of IKONOS imagery for submetre 3D positioning and building extraction. ISPRS Journal of Photogrammetry and Remote Sensing, 56(3), 177–194. Leica Geosystems 2008. Leica Photogrammetry Suite Project Manager. Leica Geosystems Geospatial Imaging, Norcross, GA, USA, 171–226. Ma, B., Lakshmanan, S. and Hero, A.O. 2000. Simultaneous detection of lane and pavement boundaries using model-based multisensor fusion. IEEE Transactions on Intelligent Transportation Systems, 1(3): 135–147. Mena, J.B. 2003. Sate of the art on automatic road extraction for GIS update: a novel classification. Pattern Recognition Letters, 24: 3037–3058. Quam, L.H., 1978. Road tracking and anomaly detection in aerial imagery. Image Understanding Workshop, Palo Alto, CA, USA, 51–55. Shaker, A., Shi, W.Z. and Barakat H. 2004. Assessment of the rectification accuracy of IKONOS imagery based on two-dimensional models. International Journal of Remote Sensing, 26(4): 719–731. Xiong, Z. and Zhang Y. 2008. An initial study on vehicle information extraction from single pass QuickBird satellite imagery. Photogrammetric Engineering and Remote Sensing, 74(11):1401–1411. Zhang, C. and Baltsavias, E. 2002. Improving cartographic road databases by image analysis. In: International Achieves of Photogrammetry and Remote Sensing, Vol. XXXIV, Part 3A, Commission III, 400–405. Zhu, C., Shi, W., Pesaresi, M., Liu, I., Chen, X. and King, B. 2005. The recognition of road network from high-resolution satellite remotely sensed data using image morphological characteristics. International Journal of Remote Sensing, 26(24): 5493–5508.
Stereo IKONOS images
Stereo Aerial images
Sensor Orientation
Interior Orientation
Generation of DEM and Orthoimage
Stereo extraction
Exterior Orientation
Digital 3D Model
Generation of DEM and Orthoimage
Stereo extraction
Comparative Analysis Horizontal Accuracy
Vertical Accuracy
Figure 1. Proposed methodology
GC-033-8
Figure 2. Study area in the Hong Kong Special Administrative Region
Figure 3. Anaglyphic view of the stereo IKONOS images
GC-033-9
Figure 4. Horizontal alignments extracted for the ramps of Prince Edward Road East and Kwun Tong Bypass
Vertical alignment of Kwun Tong Bypass (Ramp)
Vertical alignment of Prince Edward Road East (Loop) 25
24
20
Elevation (m)
Elevation (m)
20 16 12 8 4
15
10
5
Aeria Images
Aerial images
IKONOS Images 0
IKONOS Images 0
0
50
100
150
200
250
300
0
Longitude Distance (m)
50
100
150
200
250
Longitude Distance (m)
Figure 5. Vertical alignments extracted for the ramps of Prince Edward Road East and Kwun Tong Bypass
Figure 6. Digital 3D model of the study area GC-033-10