Nat. Hazards Earth Syst. Sci., 12, 3519–3531, 2012 www.nat-hazards-earth-syst-sci.net/12/3519/2012/ doi:10.5194/nhess-12-3519-2012 © Author(s) 2012. CC Attribution 3.0 License.
Natural Hazards and Earth System Sciences
Development of a Combined Drought Indicator to detect agricultural drought in Europe G. Sepulcre-Canto, S. Horion, A. Singleton, H. Carrao, and J. Vogt European Commission, DG Joint Research Centre, Institute for Environment and Sustainability, Ispra, Italy Correspondence to: G. Sepulcre-Canto (
[email protected]) Received: 10 February 2012 – Revised: 17 July 2012 – Accepted: 13 August 2012 – Published: 29 November 2012
Abstract. This study proposes a drought indicator that combines the Standardized Precipitation Index (SPI), the anomalies of soil moisture and the anomalies of the fraction of Absorbed Photosynthetically Active Radiation (fAPAR). Computed at the European level, the Combined Drought Indicator (CDI) gives a synthetic and synoptic overview of the drought situation using a classification scheme. Derived from the integration of the three individual indices, this classification scheme is composed of three warning levels: “watch” when a relevant precipitation shortage is observed, “warning” when this precipitation shortage translates into a soil moisture anomaly, and “alert” when these two conditions are accompanied by an anomaly in the vegetation condition. The design of the CDI includes the study of the relationship between the three individual indices. To achieve this, the SPI-3 (3-month SPI) was computed using the precipitation data obtained from a set of weather stations located in different agricultural areas of Europe, while the soil moisture and fAPAR data were extracted from the pixels of the respective grids surrounding these stations. The CDI is assessed for the main drought episodes of Europe between 2000 and 2011, using reported data from different sources, such as the EM-DAT Emergency Events Database and Eurostat annual yield estimates. The capability of the CDI to serve for drought early warning is evaluated as well as its robustness against false alarms. The indicator has been spatially implemented for the entire continent using different information layers of the European Drought Observatory. These layers correspond to SPI-3 grids derived from interpolated weather station precipitation data, anomalies of fAPAR from the MERIS Global Vegetation Index and anomalies of soil moisture obtained using the LISFLOOD distributed hydrological model. Maps of the CDI obtained for the European drought event in spring 2011 are
shown and discussed, evaluating its operational applicability. To conclude, the main limitations of the indicator are presented and possible avenues for improvement are discussed.
1
Introduction
Agricultural drought can have severe economic and social consequences, especially in regions with limited water resources or with imbalances between water demand and natural supply capacity. For example, the 2005 drought event in Spain led to a 40 % loss of cereal production, and the estimated non-irrigated crop and pasture losses reached 2500 million euros (European Commission, 2006). As a result of such sizeable losses incurred due to drought, there is a need to operationally provide indicators that correctly estimate the onset, severity and cessation of a drought event so that the most effective mitigation responses, such as water conservation measures and water resource allocation strategies, can be triggered. Unfortunately a universal definition of drought is difficult to formulate due to the diverse range of drivers and impacts that a drought event may have. Although the primary driver of drought is a shortage of precipitation, its definition may depend on, amongst others, location, time of the year, landuse type, and context of the impact. Agricultural drought can be thought of as the result of a shortage of precipitation over a particular timescale that leads to a soil moisture deficit that limits water availability for crops to such an extent that yields are reduced. As a result, a range of indicators is used to detect and monitor agricultural drought, which are typically based on the use of meteorological observations and estimates from remote sensing and/or modelling.
Published by Copernicus Publications on behalf of the European Geosciences Union.
3520
G. Sepulcre-Canto et al.: Development of a Combined Drought Indicator
The principal meteorological indicators used operationally are the Standardized Precipitation Index (SPI; McKee et al., 1993) and the Palmer Drought Severity Index (PSDI; Palmer, 1965). Both of these indicators have been demonstrated to be useful agricultural drought monitoring tools in multiple studies (see Mishra and Singh, 2010 for a review). The SPI is a statistical indicator that transforms the probability of the observed precipitation, derived from fitting a probability density function (PDF) to the precipitation record for a reference period, to the standard normal variable. It is designed to be spatially invariant, can be applied to any timescale of precipitation, and with units of standard deviations from the mean it is relatively straightforward to interpret. The accuracy of the SPI can be influenced by the choice of the PDF fitted to the precipitation record and the completeness and length of the record. Furthermore, in arid regions with many months with zero precipitation, the SPI needs to be interpreted with care (Wu et al., 2007). The PDSI is derived using a soil moisture algorithm that has time series of daily precipitation, temperature and available soil water content information as its inputs. It is considerably less straightforward to calculate than the SPI and has an inherent time scale of between six and twelve months depending on the location (Guttman, 1998). Similar to the SPI, the accuracy of the PDSI is influenced by the completeness of the data record. The SPI and PDSI usually are calculated at weather stations where the observations are made and as a result are location specific. The accuracy of interpolation from station locations to produce maps of these indicators necessarily depends on the spatial density of the stations. Remote sensing derived indicators on the other hand have the advantage of spatial continuity. One of the main strategies used to detect agricultural drought from remote sensing is the estimation of indices related to the biomass and vegetation condition such as the Vegetation Condition Index (VCI; Kogan, 1995), the anomalies of the fraction of Absorbed Photosynthetically Active Radiation (fAPAR) (Gobron et al., 2005), or the Normalized Difference Water Index (NDWI; Gao 1996; Gu et al., 2007). Despite having numerous limitations, the relatively simple Normalized Difference Vegetation Index (NDVI) is still the most widely used for practical and historical reasons (Leprieur et al., 1994). The main limitation in the use of these indices is that even if they have demonstrated their capability to detect vegetation stress, this stress is not necessarily related to drought. Change in land covers or pests and diseases, for example, can equally be responsible for variations in the signal. Therefore, these indicators should be used in combination with other indicators that provide information on the deficit of precipitation and/or soil moisture in order to determine if the remotely sensed vegetation response (signal) is related to a drought event or not. Remote sensing and meteorological data in conjunction with hydrological data are also the sources of information hydrological models use to obtain estimates of soil moisture. Nat. Hazards Earth Syst. Sci., 12, 3519–3531, 2012
To assess drought conditions, soil moisture is compared with the historical dataset for a determinate period and a determinate area to obtain indices such as the VIC drought index (Sheffield et al., 2004) or the Soil Moisture Deficit Index (SMDI) (Narasimhan and Srinivasan, 2005). The range of indices and indicators typically used to detect agricultural drought makes the decision-making process that triggers a drought response complicated. This complexity can lead to responses not being triggered in a timely and appropriate way, or responses being triggered when they are not required. Both of these situations can have considerable economic consequences as well as a loss of trust in the authorities responsible for triggering drought mitigation responses. Furthermore, it is likely that the main users of drought indices are policymakers and stakeholders who do not necessarily have knowledge of the strengths, weaknesses and correct interpretation of each index. The development of a single combined drought indicator that makes use of meteorological, soil moisture and remote sensing derived information will enable the onset of agricultural drought and its evolution in time and space to be monitored in a more efficient way. With the use of a single index to trigger a response, the process becomes more streamlined and the potential for incorrect decisions will be reduced. Such an approach has already been followed successfully by the US National Drought Mitigation Centre (NDMC) in the frame of the US Drought Monitor and the North American Drought Monitor (Svoboda et al., 2002). The NDMC is able to take advantage of information provided at local, state and federal levels. This information consists of key and ancillary indicators from different agencies. This set of indicators is used by an expert panel from across the United States to obtain a map representing the status of drought conditions. However, this is not done automatically, requires experts and time, and can be subjective. At the European level, drought information is mainly provided by institutions at national, regional and local scales. As a consequence, the information is highly variable in type and format as well as spatial and temporal coverage, which makes it very difficult to obtain a homogeneous and complete picture over the entire continent. For these reasons the European Commission’s Joint Research Centre is developing the European Drought Observatory (EDO) (http://edo.jrc.ec. europa.eu) with the aim of integrating drought information from the European Member States to provide a drought monitoring tool that encompasses continental, national, regional and local scales. Apart from specific indicators, reflecting local conditions provided by different institutions, a set of standardized indicators has been agreed for drought monitoring throughout Europe. These standardized indicators currently include the SPI, anomalies of soil moisture and anomalies of fAPAR. In the future, indicators on snow pack, river flow and groundwater levels will be added. As part of this multilayer system, the development of a combined indicator within the framework of EDO would www.nat-hazards-earth-syst-sci.net/12/3519/2012/
G. Sepulcre-Canto et al.: Development of a Combined Drought Indicator
3521
further developed in consultation with the user community to provide warnings that are relevant to and understandable by end users. As an example of how such a system could be used, the following strategy is proposed: i. Watch: Precipitation is less than normal. There is an increased likelihood that there will be a drought affecting agriculture. The situation should be monitored closely and responses should be put into preparation.
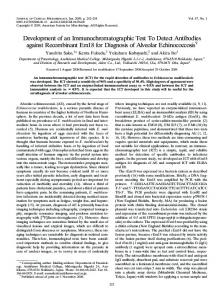
Fig. 1. Representation of the three stages of the idealized agricultural drought cause–effect relationship that inform the concept of the CDI and the associated warning levels that are outputs of the CDI.
provide an integrated approach that gives a description of the agricultural drought situation in Europe. It is envisaged that this will help policymakers develop more effective risk management and decision-making strategies for Europe. The main objective of this study is to develop this indicator in order to identify not only areas affected by agricultural drought but also areas with the potential to be affected. A method is proposed that combines the SPI, anomalies of soil moisture and anomalies of fAPAR in such a way that areas can be classified with three drought warning levels named “Watch”, “Warning” and “Alert”. The concepts behind the Combined Drought Indicator as well as its component indicators are described in Sect. 2. Section 3 describes the performance of the indicator for an initial test phase at selected weather stations and a final test phase in an operational environment. Finally, conclusions are provided in Sect. 4. 2 2.1
Combined Drought Indicator, CDI Conceptual framework
The concept behind the CDI is informed by an idealized cause–effect relationship for agricultural drought. This cause–effect relationship assumes that a shortage of precipitation (the cause) leads to a soil moisture deficit that results in a reduction of vegetation production (the effect). Such a relationship gives an opportunity to provide an early warning system for agricultural drought by identifying which stage of the cause–effect relationship is current. The CDI is presented as a first step towards such a system. In its simplest form the CDI is able to identify which stage of the cause–effect relationship has been reached by a drought event. Figure 1 shows the representation of the stages of the cause–effect relationship and associated warning levels that form the basis of the CDI. With these warning levels, it will be possible for authorities to better prepare for agricultural drought events. However, it is important that the system be www.nat-hazards-earth-syst-sci.net/12/3519/2012/
ii. Warning: Soil moisture is in deficit. Drought that affects agriculture is expected. Put response strategies into action in order to minimise exposure. iii. Alert: Vegetation shows signs of stress. Drought has begun to affect agriculture. Continue with or strengthen response strategies and monitor the situation closely. At this stage, the intention is for the system to be capable only of identifying drought and the potential for drought. Further refinement of the system will be required, taking local influences and characteristics into account, for the severity of a drought to be communicated by the indicator. In the CDI design, three indicators produced operationally in the EDO framework were selected as components of the CDI to characterize the different stages of the cause–effect relationship explained previously. These component indicators are the SPI, the anomalies of soil moisture and the anomalies of fAPAR. SPI is used to identify a precipitation shortage, the anomalies of soil moisture are used to characterize the effects of the precipitation shortage on soil moisture, and the anomalies of fAPAR are used to characterize the subsequent effects in vegetation condition. The final objective of this study is to build a robust warning system based on the combination of individual indicators. Each indicator, therefore, is computed from the most comprehensive dataset available in order to ensure the best possible statistical robustness for each indicator. 2.2 2.2.1
Component indicators SPI
The Standardized Precipitation Index (SPI-n) (McKee et al., 1993) is a statistical indicator that compares the total precipitation received at a particular location during a period of n months with the long-term precipitation distribution for the same period of time at that location. SPI is typically calculated on a monthly basis for a moving window of n months, where n indicates the precipitation accumulation period, which would usually be 1, 3, 6, 9, 12, 24 or 48 months depending on the application. For this study, the 3-month SPI is used. The reason for this is that different studies (e.g. Ji and Peter, 2003; Rossi et al., 2012) have shown that the SPI-3 has the strongest correlation with the vegetation response and is therefore the most suitable for identifying agricultural drought. This is interpreted Nat. Hazards Earth Syst. Sci., 12, 3519–3531, 2012
3522
G. Sepulcre-Canto et al.: Development of a Combined Drought Indicator
as an indication that the vegetation does not react instantaneously to precipitation and that water deficits have a cumulative impact on vegetation, resulting in a time lag in the response of plants to precipitation. The computation of SPI is a three stage process. Firstly, a parametric probability density function (PDF) is fitted to the frequency distribution of precipitation for the location, time of year and accumulation time scale of interest. Secondly, the cumulative probability of a precipitation observation is found from the cumulative distribution function (CDF) defined by the parameters of the PDF. Finally, the cumulative probability undergoes an inverse transform to the standard normal distribution with mean zero and variance one. This gives the SPI in units of number of standard deviations from the mean. In this way, the SPI is spatially and temporally invariant meaning that SPIs from different climate zones and times of year are directly comparable. Both the length of the precipitation record and the choice of parametric distribution are important for an accurate SPI estimation, the length of the precipitation record being the most critical. McKee et al. (1993) state that a minimum of 30 yr of precipitation data are needed to fit a parametric distribution sufficiently accurately for SPI. Guttman (1999) suggests that the Pearson-III distribution is the best “universal” distribution to select due to its three parameters giving it the most flexibility. However, Lloyd-Hughes and Saunders (2002) suggest that the two-parameter gamma distribution is sufficient for Europe. Consequently, the SPI used in this study for individual stations and in EDO is calculated using the two-parameter gamma distribution with a 30-yr reference period of 1981–2010. 2.2.2
Anomalies of soil moisture
The soil moisture is obtained using the LISFLOOD model (De Roo et al., 2000). LISFLOOD is a distributed hydrological precipitation–runoff model that is capable of simulating the hydrological processes that occur in a catchment. The meteorological input information is derived from observed meteorological point data provided by the Monitoring Agricultural Resources (MARS) unit of the European Commissions’ Joint Research Centre (JRC) (MeteoConsult, 1991). This meteorological information is spatially interpolated to the model gird before being ingested. For this study soil suction (pF) is used as a proxy for soil moisture because it is directly related to plant water stress, providing a quantitative assessment of the force needed by plants to extract water from the soil matrix. The pF represents the logarithm of the height of water column (cm) needed to give the necessary force, with values varying between 0 when the soil is saturated, and 7 when the soil is extremely dry. Daily soil moisture estimates were simulated by LISFLOOD at 5 × 5 km spatial resolution. Soil moisture estimates were transformed into pF values by means of the Van Genuchten pedotransfer function (Laguardia and Niemeyer, Nat. Hazards Earth Syst. Sci., 12, 3519–3531, 2012
2008). The anomalies are calculated as a z-score: z=
Xt − X , σ
(1)
where Xt is the mean pF for dekad t of the current year, X is the long-term mean, and σ the standard deviation for the same dekad over the available time series (1990– 2010). Dekads are defined, following the standard agrometeorological practices, as the periods ranging from days 1 to 10, days 11 to 20 and from day 21 to the last day of the month, having each month three dekads. By normalizing the soil moisture with the z-score, a classification scheme is obtained identical to that of McKee et al. (1993). 2.2.3
Anomalies of fAPAR
The fraction of Absorbed Photosynthetically Active Radiation (fAPAR) represents the fraction of the solar energy which is absorbed by the vegetation. fAPAR is a biophysical variable directly correlated with the primary productivity of the vegetation, since the intercepted PAR is the energy (carried by photons) underlying the biochemical productivity processes of plants. The fAPAR estimates used in this study are those operationally provided by the European Space Agency (ESA). They are derived from the multispectral images acquired by the Medium Resolution Imaging Spectrometer (MERIS) onboard ENVISAT by means of the MERIS Global Vegetation Index (MGVI) algorithm (Gobron et al., 2004). The product is delivered as a 10-day composite image at 1.2-km resolution. The algorithm used for compositing is the Time Composite fAPAR algorithm (Pinty et al., 2002), which selects the most representative value as the sample which is the closest to the temporal average value estimated over the compositing period. The result is an image with higher coverage, also least corrupted by short-term variations. Similar to the soil moisture anomaly, fAPAR anomaly estimation is done using the z-score approach (Eq. 1). In this case Xt is the mean fAPAR of the dekad t of the current year; X is the long-term mean fAPAR and σ is the standard deviation, both calculated for the same dekad t using the available time series of 1998–2008. The archive of MGVI covers the period from June 2002 until the current day. In Europe, the archive has been extended backward to mid-1997 using fAPAR estimations derived from the Sea-viewing Wide Field-of-view Sensor (SeaWiFS) (Gobron et al., 2002). In order to build a coherent and consistent multi-sensor time series, SeaWiFS data were resampled and corrected to fit the MGVI dataset characteristics. Long-term dekad average and standard deviations are calculated for every pixel with at least 6 yr of data available, meaning that for some specific pixels the statistics are obtained only with 6 yr of data.
www.nat-hazards-earth-syst-sci.net/12/3519/2012/
G. Sepulcre-Canto et al.: Development of a Combined Drought Indicator
3523
Table 1. Categories of the Combined Drought Indicator.
2.3
Category
Characteristics
Definition
Watch
Precipitation deficit
SPI-3 < −1
Warning
Soil moisture deficit
Anomaly pF > 1+ SPI-3 < −1
Alert 1
Vegetation stress following precipitation deficit
Anomaly fAPAR < −1+ SPI-3 < −1
Alert 2
Vegetation stress following precipitation/soil moisture deficit
Anomaly fAPAR < −1+ Anomaly pF > 1+ SPI-3 < −1
Categories
In the conceptual framework (Sect. 2.1), three CDI categories were defined: watch, warning and alert, as summarised in Table 1. In the table, two types of alert have been defined, taking into account cases in which meteorological drought conditions result in a quick reduction in vegetation productivity even without preceding anomalies of soil moisture. This could be related to extreme rainfall deficits during sensitive crop development stages. In such cases alert type 1 is identified with only two indicators (i.e. SPI-3 and anomalies of fAPAR), while alert type 2 is based on three indicators (SPI3, anomalies of pF, anomalies of fAPAR) providing stronger evidence of drought. However, these two types are not further separated as conceptually they are responding to the same stage of the agricultural drought cause–effect relationship, which is the basis of the system presented. In order to demonstrate the utility of the CDI, the aim is only to identify areas under agricultural drought conditions, or under threat from agricultural drought, while the intensity of the drought is not yet evaluated. Therefore, the threshold for each of the indicators is set to 1 standard deviation (−1 for SPI-3 and fAPAR, +1 for soil moisture pF). This equates to a return period of 6.3 yr, and under the SPI classification of McKee et al. (1993) to “moderate drought”. Anomalies of fAPAR are only considered from April to October, corresponding to the main growing period of Europe. It is only during this period that, for the bulk of the continent, crop growth is expected to be detected in the fAPAR estimates. Consequently, alerts can only be registered for this period. However, watches and warnings are estimated for the whole year in order to have information on the water availability to crops at the beginning of their development. 2.4
Design
A time lag is expected between the three stages of the cause– effect relationship represented in Fig. 1. Due to that, the design phase of the CDI involved the investigation of the temporal relationships between the component indicators used to characterize each of these three stages.
www.nat-hazards-earth-syst-sci.net/12/3519/2012/
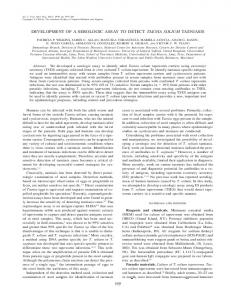
Fig. 2. Land cover map of Europe with the locations and the names of the weather stations selected for the analysis. The yellow areas of the land cover map correspond to non-irrigated arable land.
2.4.1
Data
The investigation of the relationships between the component indicators was done at selected rain gauge locations. Precipitation observing weather stations were chosen from the European Climate Assessment and Dataset project (http://eca.knmi.nl/) that met the following criteria: (i) located in non-irrigated arable land (Fig. 2), (ii) belong to areas that were reported as affected by some of the most important droughts over the last 11 yr in Europe, and (iii) representative of the different European climate areas. Non-irrigated land was a condition to minimise anthropogenic influence on the plant water condition and to ensure a homogeneous vegetation cover. These criteria resulted in the selection of the nine weather stations shown in Fig. 2. Time-series of SPI-3 were computed from daily precipitation observations at the selected weather stations. Soil moisture anomaly values were extracted from the pixel including the station position in the 5 × 5 km grid of the LISFLOOD model. Values of fAPAR anomalies were extracted from homogeneous agricultural areas of 3 × 3 pixels, surrounding the weather stations. In the analysis of the relationships between Nat. Hazards Earth Syst. Sci., 12, 3519–3531, 2012
3524
G. Sepulcre-Canto et al.: Development of a Combined Drought Indicator
Table 2. Pearson’s R correlation coefficients obtained between SPI3 and the anomalies of soil moisture and fAPAR with different time lags with respect to SPI-3. +/ − d represents a positive or negative shift of one dekad between the indicators. The best RPearson are represented in bold. Scores indicated with a * are those not significantly different from each other (p < 0.05). SPI-3 vs. (n = 631) anomaly pF −d anomaly pF anomaly pF +d anomaly pF +2d anomaly pF +3d anomaly fAPAR −d anomaly fAPAR anomaly fAPAR +d anomaly fAPAR +2d anomaly fAPAR +3d
Anomaly of pF vs. (n = 631)
RPearson −0.58* –0.62 −0.54 −0.45 −0.39 0.35* 0.34* 0.33* 0.37 0.29*
the component indicators, only data from April to October from 2000 to 2011 were taken into account to ensure meaningful fAPAR values. 2.4.2
Table 3. Pearson’s R correlation coefficients between soil moisture and fAPAR anomalies with different time lags with respect to the anomaly of soil moisture. +/ − d represents a positive or negative shift of one dekad between the indicators. The best RPearson are represented in bold. Scores indicated with a * are those not significantly different from each other (p < 0.05).
Time lags for class definitions
In order to identify the timings of the soil moisture and fAPAR responses with respect to a precipitation deficit, the SPI of a determinate month is compared with the anomalies of soil moisture and fAPAR of the 2nd and 3rd dekads of that month and of the 1st, 2nd and 3rd dekads of the following month. The correlation coefficients found for these relationships are shown in Table 2. The strongest correlation found between SPI-3 and soil moisture anomaly was for the 3rd dekad of the month of the SPI (i.e. anomaly pF; RPearson = −0.62). In the case of the relationship between SPI-3 and the fAPAR anomaly, the strongest correlation was found for the 2nd dekad of the following month (i.e. anomaly fAPAR +2d; RPearson = 0.37). However, the correlation coefficients between SPI-3 and the soil moisture anomalies for the 2nd and 3rd dekads of the month and the 1st dekad of the following month are found to not be significantly different to each other at the 95 % confidence level. Furthermore, the correlation coefficients between SPI-3 and fAPAR anomalies are not significantly different from each other at the 95 % confidence level for all dekads tested. The correlation coefficients are relatively low between SPI-3 and fAPAR. This has been previously observed in several studies (e.g. Ji and Peter, 2003; Rossi et al., 2012). There are several possible reasons for this. One factor could be the short time-series of the remote sensing archive and the lack of fAPAR data in the northern latitudes due to cloud. Other factors could be the earlier start and the longer duration of the growing period in southern Europe. To address Nat. Hazards Earth Syst. Sci., 12, 3519–3531, 2012
anomaly fAPAR −d anomaly fAPAR anomaly fAPAR +d anomaly fAPAR +2d anomaly fAPAR +3d
RPearson −0.28* −0.30* –0.35 –0.35 −0.27*
these problems, future developments will include the use of more than one indicator related to vegetation conditions, including spatially resolved phenological indicators. To further elucidate the time differences between the responses of the different indices comprising the CDI, the relationship between the anomalies of soil moisture and fAPAR was also investigated. Results are shown in Table 3. Although the differences between the correlation coefficients are not significant, the results suggest that the soil moisture conditions are mostly related to anomalies of fAPAR after one or two dekads. Based on the relationships between SPI-3, soil moisture anomalies, and fAPAR anomalies, the CDI is computed 3 times per month combining the SPI-3 from the previous month with the other indicators. Table 4 shows an example of the CDI implementation for the month of January. This implementation strategy enables three images per month. Note that although the third CDI of the month is based on a soil moisture anomaly with weaker correlation with the SPI-3, it is included to provide a regular uninterrupted CDI.
3 3.1
Qualitative assessment Assessment criteria
Following the design phase, an initial test phase of the prototype CDI was undertaken. The CDI was evaluated at the test weather station locations for the main drought events occurring in Europe from 2000 to 2011. The results obtained were qualitatively compared with information about the European drought events reported by different institutions and with the data provided by the Emergency Events Database EM-DAT (http://www.emdat.be/). For each station, the number of dekads per year when the CDI detected watch, warning or alert was analysed, comparing the results against cases when a drought episode was reported by the different institutions. Also, the frequency of events detected by the CDI was contrasted with the estimated annual cereal yields for the www.nat-hazards-earth-syst-sci.net/12/3519/2012/
G. Sepulcre-Canto et al.: Development of a Combined Drought Indicator
3525
Table 4. Implemented timing of the Combined Drought Indicator (CDI) components. CDI delivering date
SPI-3 used
Anomaly of soil moisture used
Anomaly of fAPAR used
5 January 15 January 25 January
December December December
11–20 December 21–31 December 1–10 January
21–31 December 1–10 January 11–20 January
regions where the weather stations are located. This was done for all the stations except Wattisham for the period of 2000–2006 due to a lack of yield data availability. The annual yield estimations used were those provided by Eurostat (http://epp.eurostat.ec.europa.eu/). Finally, the prototype CDI was implemented within EDO in order to evaluate its applicability as an operational drought indicator. Each of the component indicators in EDO is stored on a regular grid with 1/12 ◦ spatial resolution. The sources of the fAPAR and soil moisture are the same as those used in the design and initial test phases, but with a spatial resolution degraded to that of the EDO grid. The SPI is computed for a European weather station network supplied by the MARS unit of the JRC and interpolated to the EDO grid using an inverse distance weighted interpolation scheme. CDI maps were obtained for the drought period from April to July 2011 as a case study. 3.2 3.2.1
European drought events 2000
In 2000, eastern European countries were affected by drought events that persisted from spring to summer, severely affecting crop production, especially spring and summer crops. Romania was the most affected country, followed by countries of the former Yugoslavia, Hungary, and Bulgaria (Glinni et al., 2001). The drought that affected Romania in this period (especially in June) was the most severe in recent decades and, with an estimated economic cost of US $500 million, was considered as a natural disaster by the EM-DAT International Disaster Database. During summer 2000 other regions, such as the Mediterranean, also were affected by extreme hot and dry weather. 3.2.2
2003
In 2003 a major part of the European continent experienced drought conditions that in summer were accompanied by a heat wave. The heat wave that began in early June accelerated crop development by 10 to 20 days, thus advancing ripening and maturity. Winter–spring cereals formed grain with insufficient soil moisture, which resulted in a substantial drop in crop yields (UNEP, 2005). During the summer, vegetation growth across Europe was reduced by approximately 30 % www.nat-hazards-earth-syst-sci.net/12/3519/2012/
and the dry conditions significantly increased the risk of forest fires (European Commission, 2006). Of the affected countries, Bosnia-Herzegovina and Croatia were declared in natural disaster by the EM-DAT International Disaster Database with estimated economic costs of US $140 million and US $330 million, respectively. In Germany, the EU granted C90 million to agricultural holdings and to fish farms in order to compensate the farmers for losses incurred as a result of the extremely dry weather in different regions (RAPID, 2003). Italy, France (especially the south) and the UK (especially south-eastern and northwestern England) were also affected. For example, the 2003 economic cost of the drought for French farms was estimated to be C670 million (European Commission, 2006). 3.2.3
2005
In the hydrological year 2004/2005 (from 1 October to 30 September) the Iberian Peninsula was affected by an intense drought that caused a decrease of cereal production of about 40 % (Garcia-Herrera et al., 2007). For Spain, this was probably the most serious event in 60 yr and led to a 10 % reduction in total EU cereal production (Sheffield and Wood, 2011). The same year Portugal was declared in natural disaster by EM-DAT with an estimated economic cost of US $1338 million. 3.2.4
2007
In 2007, Romania was affected by an intense heat wave in spring and summer with deviations from the climatological average temperature greater than 2 ◦ C in some areas. In April, June and July, there were deficits of precipitation in most regions, the most pronounced being in the west and in the south of the country in April (ANPM, 2007). Also in spring 2007, media reported that the Po River volume was historically low, leaving central and northern Italy in a state of emergency and affecting agricultural areas. For the same period, official bulletins from the Italian meteorological service reported moderate drought in the area (MeteoAM, 2007). 3.2.5
2011
In 2011 southern England, western Germany, the Netherlands, Belgium and north-western areas of France received considerably less precipitation than is climatologically Nat. Hazards Earth Syst. Sci., 12, 3519–3531, 2012
3526
G. Sepulcre-Canto et al.: Development of a Combined Drought Indicator
(a)
(b)
(c)
(d)
(e)
(f)
(g)
(h)
(i)
Fig. 3. Stacked number of dekads of the year that the indicator gave watch (yellow), warning (orange) and alert (red) per station. The years when a major drought event was reported in the area of the station are marked with a black star.
expected for spring (European Drought Observatory, 2011). In the period January to May 2011, severe precipitation deficits were recorded in France, this period being the driest since 1976. Also in this case, the reduced precipitation accumulations were coupled with warmer than average temperatures and consequently higher than normal levels of evapotranspiration and plant water requirements. 3.3
Implementation of the CDI at weather station locations
For each of the selected stations, the number of events identified by the Combined Drought Indicator during the period of analysis (2000–2011) is presented in Fig. 3. Bars represent the stacked number of dekads per year for which the indicator identified “watch”, “warning” and “alert”. These dekads are not necessarily consecutive in time. The years when one of Nat. Hazards Earth Syst. Sci., 12, 3519–3531, 2012
the main European droughts was reported for the area where the station is located are marked with a black star. Figure 3 shows that a considerably higher number of dekads with watches, warnings and alerts were identified by the CDI during the main drought periods for each station. The indicator clearly responded to the drought of the year 2000 in Romania, as can be observed with 4 dekads with watch, 2 with warning and 7 dekads with alert at the Rosiori station. For the Iberian drought in 2005, there were 4 watch dekads, 9 warnings and 6 alerts in Albacete. Also, the CDI responded to the drought events in Europe in the years 2003 and 2011 with, for example, 4 dekads identified with watch, 5 with warning and 4 with alert at the Wattisham (UK) station in 2003, and 2 dekads identified with watch, 3 with warning and 4 with alert at the Madegburg (Germany) station in 2011. As well as the capability of the CDI in identifying the relevant drought periods for the different areas, the indicator was able to give a response in other periods characterized by dry
www.nat-hazards-earth-syst-sci.net/12/3519/2012/
G. Sepulcre-Canto et al.: Development of a Combined Drought Indicator
3527
(a)
(b)
(c)
(d)
(e)
(f)
(g)
(h)
Fig. 4. Time-series of the annual cereal yield (kg ha−1 ) for the region corresponding to the different stations (from 2000 to 2006). The periods with CDI watch, warning and alert are coloured in yellow, orange and red, respectively.
conditions such as 2000 in the Iberian Peninsula and 2009 in France, UK and Spain. The CDI also showed how, generally, the alert warning level is only identified for the drought reported years, suggesting a robustness of the method against false alarms. In a small number of cases, the CDI seemed not to respond as expected: in Deols (France) in 2003 and in Rosiori (Romania) in 2007. In the first case, an in-depth analysis
www.nat-hazards-earth-syst-sci.net/12/3519/2012/
should be done in order to verify whether the local characteristics of the station surroundings are different to the general characteristics of the country. Also, the quality of the station data needs verification. In the second case, the drought conditions occurred mainly during one month (April) with extreme drought and very high temperatures. Future research to improve the CDI will include the analysis of using not only SPI-3 for characterizing precipitation shortages but also
Nat. Hazards Earth Syst. Sci., 12, 3519–3531, 2012
3528
G. Sepulcre-Canto et al.: Development of a Combined Drought Indicator
other accumulation periods such as 1 month (SPI-1) in order to be able to take into account these special cases. The most important consequence of agricultural drought is a reduction in crop yield. While water stress is not the only factor that can affect crop yield, recorded drought events during the growing period are generally accompanied by important reductions in crop production, especially in the case of cereals. With the exception of Wattisham, where no data were available, Fig. 3 shows annual cereal yields (kg ha−1 ) estimated for the regions where the selected meteorological stations are located. Data used are limited to 2000 to 2006 due to data availability. In Fig. 4, the periods when a watch, warning or alert has been detected are coloured yellow, orange or red, respectively. The figure shows the general correspondence between the years when a period is identified with alert and the decrease of the cereal yield in the respective area, indicating the suitability of the method for authorities to better prepare for possible agricultural drought consequences. This figure also shows how in most cases an alert period is preceded by a period of watch, warning, or both, demonstrating the effectiveness of the CDI for early warning of agricultural drought. The capability of the CDI for early warning was assessed quantitatively by summing the number of cases when the alert period is preceded by a period of watch, by a period of warning, or by both, as well as cases when this does not happen. An alert period may contain one or more consecutive dekads. Results are presented in Table 5, showing that for all the stations together, only 4 alert periods from 21 where not preceded by a watch, a warning, or both. This nonidentification of the three stages separated in time is not necessarily erroneous but can indicate that for these cases the process was very quick and the system was not able to give an early-warning. The results also show that from the four options – (i) alert period preceded by watch and warning, (ii) alert preceded by watch, (iii) alert preceded by warning, and (iv) alert without precedent watch or warning – the one that registered most cases (8 from 21) was when the watch period preceded the warning, and the warning preceded the alert period. Therefore in these cases, the indicator was able to identify a period of one or more than one dekad with a precipitation deficit only, followed by a period of one or more than one dekad with a precipitation deficit and a soil moisture deficit, and followed by a period of one or more dekads with a reduction of vegetation production (consequence of the soil moisture deficit and the rain shortage). This behaviour demonstrates the ability of the CDI to identify the different stages of the agricultural drought cause–effect relationship. This indicates the potential of the CDI as an early warning indicator that could be used to trigger measures corresponding to the stages as explained in the Sect. 2.1. As an example of the CDI response to the different stages to the cause–effect relationship, Fig. 5 presents a full sequence (watch–warning–alarm) registered by the CDI for Nat. Hazards Earth Syst. Sci., 12, 3519–3531, 2012
(a)
(b)
(c)
(d) Fig. 5. Time-series of the SPI-3 (a), of the anomaly of pF (b), of the anomaly of fAPAR (c) and of the Combined Drought Indicator warning levels (d) for the station of Madegburg (Germany) during spring/summer 2011. For (d) the identified periods with watch, warning and alert are coloured in yellow, orange and red, respectively.
Magdeburg (Germany) in spring/summer 2011. The figure shows the response of each individual indicator and the response of the CDI to the drought period. 3.4
Implementation of the CDI within EDO
Following the initial test phase at station locations, the CDI was implemented spatially for the whole of Europe using the EDO layers of SPI-3, soil moisture anomalies and fAPAR anomalies. The evolution of the CDI for the 2011 drought event is presented in Fig. 6. The figure consists of maps of the CDI from the first dekad of April to the last dekad of July 2011. These maps show the capability of the indicator to give information on the spatial extension of a drought and the potential consequences to agriculture at the continental scale. They show not only the areas with precipitation shortage but also where the vegetation was affected by this precipitation shortage. The beginning of the European drought episode was identified with watch, corresponding to precipitation deficit, in Germany, Benelux, France and southern UK at the beginning www.nat-hazards-earth-syst-sci.net/12/3519/2012/
G. Sepulcre-Canto et al.: Development of a Combined Drought Indicator
3529
Table 5. Number of times that an alert period from the 11 yr of study was preceded by watch and warning periods, per station.
Number of alert periods preceded by watch and warning Number of alert periods preceded by watch Number alert periods preceded by warning Number of alert periods coming alone
Albacete
Beja
Ciampino
1
1
3 1
Deols
Larissa
Madegburg
Rosiori
Valladolid
Wattisham
Total
1
1 1
1
1 1
1
1 1 1
1
1
8 6 3 4
2 1
Fig. 6. Maps of the Combined Drought Indicator from the first dekad of April to the last dekad of July 2011.
of April, evolving in most of the areas into warning, corresponding to soil moisture deficit, by the end of the same month. This warning evolved into alert, indicating vegetation stress, in Benelux by middle May, in Germany and UK by the end of May, and in France by the beginning of June. The recovery to normal conditions of the soil and the vegetation was also shown in most of the areas by the beginning of July except in the centre of France, where the alert persisted until the end of the month. In the case of Belarus and the
www.nat-hazards-earth-syst-sci.net/12/3519/2012/
Ukraine, the precipitation deficit was identified with watch at the beginning of April evolving into warning and alert in some areas until beginning of July. These results demonstrate the capability of the CDI to identify the different stages of the agricultural drought cause–effect relationship in the areas that were affected more severely by the drought conditions, underlining its applicability in an operational system and its potential for early warning.
Nat. Hazards Earth Syst. Sci., 12, 3519–3531, 2012
3530 4
G. Sepulcre-Canto et al.: Development of a Combined Drought Indicator
Conclusions
This study has presented a methodology to identify agricultural drought over Europe, based on a combination of three indicators. Anomalies of precipitation (SPI-3), soil moisture and fAPAR are used as the basic indicators to design a prototype of the so-called Combined Drought Indicator (CDI), characterising the different stages of the agricultural drought cause–effect relationship. The CDI depicts the spatial extent of a drought situation and gives an overview of the possible consequences for agriculture, classifying the affected areas with a watch when there is a precipitation deficit, a warning when this precipitation deficit leads to a soil moisture deficit, and an alert when the two previous conditions result in a reduction of the vegetation production. In order to establish the expected time lag between the different stages of the agricultural drought cause–effect relationship, the relationships between SPI-3 and the anomalies of soil moisture and fAPAR were studied using data from the locations of a limited number of meteorological stations, located in agricultural areas and in different climatic zones of the European continent. The results of the analysis suggest that the best correlations between SPI-3 and soil moisture and fAPAR anomalies are obtained with a time lag of one or two dekads between the indices. The CDI behaviour has been assessed for the major drought events that occurred in Europe between 2000 and 2011, showing its capability to discriminate between areas affected by agricultural drought. The analysis further showed the coherency of the indicator variation with the variation in cereal crop yields during a drought period, and proved its potential to serve as an indicator for drought early warning. The operational EDO layers of SPI-3, soil moisture anomalies and fAPAR anomalies have been used to produce dekadal CDI maps for the entire continent. Presented maps cover the period of the 2011 European drought event as case study. Results demonstrate the applicability of the CDI as an operational indicator and its potential for early warning, underlining its suitability to be used by authorities to better prepare for agricultural drought events. At present, the CDI “alert” levels are considered only during the defined average European growing period (April–October). However, the southern parts of Europe have longer and earlier growing periods with respect to the average situation. Future developments will include the use of phenological information, such as phenological indicators derived from remote sensing data in order to better determine the growing period for different regions and vegetation types across Europe. Cases like the drought event in Romania in 2007 show that short but very extreme precipitation deficits, especially when they are accompanied by high temperatures, can have important agricultural consequences. To take that into account, future research will investigate the potential of including additional indicators such as SPI-1 and indicators based on satellite derived land surface temperature for a better characterization Nat. Hazards Earth Syst. Sci., 12, 3519–3531, 2012
of vegetation water stress. We will further investigate how to best select the thresholds for individual indices, using, for example, more adapted statistical distributions.
Acknowledgements. The authors would like to acknowledge Alfred de Jager and Diego Magni for their work in the operational implementation of the indicator. The authors would also like to acknowledge Paulo Barbosa, Fabio Micale and Elena Sokolova for their scientific support and their contributions to the European Drought Observatory. Edited by: R. Crockett Reviewed by: three anonymous referees
References ANPM: National Agency for the Protection of the EnvironmentANPM, 2007 Annual Report on the Environment in Romania, available at: http://www.anpm.ro/files2/1.%20CADRUL% 20NATURAL 20081219456335.doc, last access: 17 September 2012. De Roo, A., Wesseling, C., and Van Deursen, W.: Physically based river basin modelling within a GIS: the LISFLOOD model, Hydrol. Process, 14, 1981–1992, 2000. European Commission: Water Scarcity and Drought, First Interim Report, available at: http://ec.europa.eu/environment/water/pdf/ 1st report.pdf, last access: 17 September 2012. European Drought Observatory, Drought News in Europe: Situation in May 2011, available at: http://edo.jrc.ec.europa.eu/documents/ news/EDODroughtNews201105.pdf, last access: 17 September 2012. Gao, B. C.: NDWI – A normalized difference water index for remote sensing of vegetation liquid water from space, Remote Sens. Environ., 58, 257–266, 1996. Garcia-Herrera, R., Paredes, D., Trigo, R. M., Trigo, I. F., Hern´andez, H., Barriopedro, D., and Mendes, M. T.: The outstanding 2004-2005 drought in the Iberian Peninsula: associated atmospheric circulation, J. Hydrometeorol., 8, 483–498, 2007. Glinni, A. F., Sivakumar, M. V. K., and Wilhite, D. A.: Drought management and preparedness – WMO perspective, paper presented at MITCH (Mitigation of Climate Induced Natural Hazards) Workshop, Delft, 2001. Gobron, N., Pinty, B., M´elin, F., Taberner, M., and Verstraete, M. M.: Sea Wide Field-of-View Sensor (SeaWiFS) – Level 2 Land Surface Products – Algorithm Theoretical Basis Document, Institute for Environment and Sustainability, EUR Report No. 20144, 2002. Gobron, N., Aussedat, O., Pinty, B., Taberner, M., and Verstraete, M. M.: Medium Resolution Imaging Spectrometer (MERIS) – An optimized fAPAR Algorithm – Theoretical Basis Document, EUR Report No. 21386, 2004. Gobron, N., Pinty, B., M´elin, F., Taberner, M., Verstraete, M. M., Belward, A., Lavergne, T., and Widlowski J.-L.: The state of vegetation in Europe following the 2003 drought, Int. J. Remote Sens., 26, 2013–2020, 2005. Gu, Y., Brown, J. F., Verdin, J. P., and Wardlow, B.: A five-year analysis of MODIS NDVI and NDWI for grassland drought assess-
www.nat-hazards-earth-syst-sci.net/12/3519/2012/
G. Sepulcre-Canto et al.: Development of a Combined Drought Indicator ment over the central Great Plains of the United States, Geophys. Res. Lett., 34, L06407, doi:10.1029/2006GL029127, 2007. Guttman, N. B.: Comparing the Palmer Drought Index and the Standardized Precipitation Index, J. Am. Water Resour. Assoc., 34, 113–121, 1998. Ji, L. and Peters, A.: Assessing vegetation response to drought in the northern Great Plains using vegetation and drought indices, Remote Sens. Environ., 87, 85–98, 2003. Kogan, F. N.: Droughts of the late 1980s in the United States as derived from NOAA polar-orbiting satellite data, Bull. Am. Meteorol. Soc., 76, 655–668, 1995. Laguardia, G. and Niemeyer, S.: On the comparison between the LISFLOOD modelled and the ERS/SCAT derived soil moisture estimates, Hydrol. Earth Syst. Sci., 12, 1339–1351, doi:10.5194/hess-12-1339-2008, 2008. Leprieur, C., Verstraete, M. M., and Pinty, B.: Evaluation of the performance of various vegetation indices to retrieve vegetation cover from AVHRR data, Remote Sens. Rev., 10, 265–284, 1994. Lloyd-Hughes, B. and Saunders, M. A.: A drought climatology for Europe, Int. J. Climatol., 22, 1571–1592, 2002. McKee, T. B., Doesken, N. J., and Kleist, J: The relationship of drought frequency and duration to time scales. Proceedings of the 8th Conference of Applied Climatology, Anaheim, CA, Am. Meterol. Soc., 179–184, 1993. MeteoAM: Climatologia – temperatura e precipitazioni Aprile 2007, available at: http://clima.meteoam.it/bollettinoMensile. php, last access: 17 September 2012. MeteoConsult: AMDaC System Manual, MeteoConsult, Wageningen, The Netherlands, 1991. Mishra, A. K. and Singh, V. P.: A review on drought concepts, J. Hydrol., 391, 202–216, 2010. Narasimhan, B. and Srinivasan, R.: Development and evaluation of soil moisture deficit index (SMDI) and evapotranspiration deficit Index (ETDI), Agr. Forest Meteorol., 133, 69–88, 2005.
www.nat-hazards-earth-syst-sci.net/12/3519/2012/
3531
Palmer, W. C.: Meteorological drought, US Weather Bureau, Research Paper No. 45, 1965. UNEP: Impacts of summer 2003 heat wave in Europe, Environment Alert Bulletin ID 7F2D053, available at: http://www.grid.unep. ch/product/publication/download/ew heat wave.en.pdf, last access: 17 September 2012. Pinty, B., Gobron, N., Melin, F., and Verstraete, M. M.: A time composite algorithm for fAPAR products – Theoretical basis document, EUR Report No. 20150, 2002. RAPID: Press releases IP/03/1524, Brussels, 2003. Rossi, S. and Niemeyer, S.: Drought Monitoring with estimates of the Fraction of Absorbed Photosynthetically-active Radiation (fAPAR) derived from MERIS, in: Remote Sensing for Drought: Innovative Monitoring Approaches, edited by: Wardlow, B., Anderson, M., and Verdin, J., CRC Press-Taylor & Francis, Boca Raton, FL, USA, 95–116, 2012. Sheffield, J. and Wood, E. F.: Drought, Past Problems and Future Scenarios, Earthscan, UK, 2011. Sheffield, J., Goteti, G., Wen, F., and Wood, E. F.: A simulated soil moisture based drought analysis for the USA, J. Geophys. Res., 109, D24108, doi:10.1029/2004JD005182, 2004. Svoboda, M., LeComte, D., Hayes, M., Heim, R., Gleason, K., Angel, J, Rippey, B., Tinker, R., Palecki, M., Stooksbury, D., Miskus, D., and Stephens, S.: The Drought Monitor, Bull. Am. Meteorol. Soc., 83, 1181–1190, 2002. World Meteorological Organization – WMO: Drought monitoring and early warning: Concepts, progress and future challenges, WMO No. 1006, 2006. Wu, H., Svodoba, M. D., Hayes, M. J., Wilhite, D. A., and Wen, F.: Appropriate application of the Standardized Precipitation Index in arid locations and dry seasons, Int. J. Climatol., 27, 65–79, 2007.
Nat. Hazards Earth Syst. Sci., 12, 3519–3531, 2012