Van. C ase V eh icle B o d y. T y p e . Number of Case Vehicles. Figure 3-1. ...... 1. NHTSA NCAP 4445 2003. Chevrolet. Cavalier 2 door coupe. CIREN-027.
Development of a Comparison Technique Between Crash Tests and Real-World Crashes
By Kathryn Leigh Loftis A Thesis Submitted to the Graduate Faculty of VIRGINIA TECH – WAKE FOREST UNIVERSITY SCHOOL OF BIOMEDICAL ENGINEERING & SCIENCES In Partial Fulfillment of the Requirements for the Degree of MASTER OF SCIENCE Biomedical Engineering May 2009 Winston-Salem, North Carolina
Approved by: Joel D. Stitzel, PhD, Advisor, Chair
_____________________________
Examining Committee: Stefan M. Duma, PhD
_____________________________
R. Shayn Martin, MD
_____________________________
H. Clay Gabler, PhD
_____________________________
Acknowledgements Thank you to my advisor, Dr. Joel Stitzel, and the rest of my committee. I would like to thank my very supportive, loving family for all the encouragement throughout the years. I would also like to thank Kerry Danelson, Ashley Weaver, Scott Gayzik, Mao Yu, and the rest of the Center for Injury Biomechanics lab. Finally, I would like to acknowledge Katie Kennedy, Mike Burke, and the rest of our CIREN team for the great casework.
ii
Table of Contents Acknowledgements............................................................................................................. ii Table of Contents............................................................................................................... iii List of Tables ...................................................................................................................... v List of Figures ................................................................................................................... vii Abstract .............................................................................................................................. ix 1.
2.
3.
Introduction................................................................................................................. 1 1.1.
Previous Comparison Methods ........................................................................... 1
1.2.
Crash Injury Research and Engineering Network .............................................. 5
1.3.
National Highway Traffic Safety Administration............................................... 6
1.4.
Insurance Institute for Highway Safety ............................................................ 10
1.5.
Crash Test Dummy Injury Criteria ................................................................... 12
Methods..................................................................................................................... 14 2.1.
Real-World Crash ............................................................................................. 14
2.2.
Comparison Crash Test..................................................................................... 16
2.3.
Development of Similarity Score...................................................................... 18
Results....................................................................................................................... 22 3.1.
CIREN case selection ....................................................................................... 22
3.2.
Comparison Crash Tests ................................................................................... 28
3.3.
Similarity Scoring ............................................................................................. 32
3.4.
Cases with Good Rank...................................................................................... 44
3.4.1.
Frontal comparison cases.......................................................................... 46
3.4.2.
Side impact comparison cases .................................................................. 54
iii
4.
Discussion ................................................................................................................. 63 4.1.
CIREN Cases .................................................................................................... 63
4.2.
Comparison Crash Tests ................................................................................... 64
4.3.
Similarity Scoring ............................................................................................. 65
4.4.
Good Ranked Comparisons .............................................................................. 68
4.4.1.
Frontal impact good ranked cases............................................................. 69
4.4.2.
Side impact good ranked cases ................................................................. 71
5.
Conclusions............................................................................................................... 73
6.
References................................................................................................................. 75
7.
Appendix 1: Comparison results............................................................................... 77 7.1.
Vehicle Comparison Parameter Results............................................................ 77
7.2.
Crash Comparison Parameter Results............................................................... 84
7.3.
Occupant Comparison Parameter Results......................................................... 96
7.4.
Injury Comparison Parameter Results ............................................................ 104
8.
Appendix 2: “Good” Comparison Summaries........................................................ 114
9.
Scholastic Vita ........................................................................................................ 135
iv
List of Tables Table 1-1. NHTSA frontal impact star ratings................................................................... 7 Table 1-2. NHTSA side impact star ratings....................................................................... 7 Table 1-3. NHTSA rollover star ratings ............................................................................ 8 Table 1-4. Common NHTSA current crash test configurations ........................................ 9 Table 1-5. NHTSA future advancements.......................................................................... 10 Table 1-6. Common IIHS crash test configurations ......................................................... 11 Table 1-7. Frontal crash test dummy critical values ........................................................ 12 Table 1-8. Side crash test dummy critical values ............................................................ 13 Table 2-1. Important crash comparison parameters......................................................... 15 Table 2-2. Important occupant comparison parameters................................................... 15 Table 2-3. Common crash configuration CDC code ....................................................... 16 Table 2-4. Common crash characteristics and associated crash tests .............................. 17 Table 2-5. Crash and vehicle parameter requirements for similarity score ..................... 20 Table 2-6. Occupant parameter requirements for similarity score .................................. 20 Table 3-1. Crash test dummy heights and weights .......................................................... 32 Table 3-2. Crash and vehicle similarity comparisons...................................................... 36 Table 3-3. Impacted objects comparison results for frontal impacts ............................... 36 Table 3-4. Impacted objects comparison results for side impacts ................................... 37 Table 3-5. Occupant comparison characteristics ............................................................. 40 Table 3-6. Three-point lap and shoulder belt comparison results.................................... 41 Table 3-7. Child safety seat comparison results ............................................................... 41 Table 3-8. Height difference results................................................................................. 42
v
Table 3-9. Weight difference results................................................................................ 43 Table 3-10. “Good” case comparison vehicle and crash results...................................... 45 Table 3-11. “Good” case comparison occupant results ................................................... 45 Table 3-12. “Good” ranked frontal comparisons............................................................. 46 Table 3-13. “Good” frontal comparison crash parameters .............................................. 47 Table 3-14. “Good” frontal comparison occupant parameters ........................................ 47 Table 3-15. Frontal crash test HIC36 values ................................................................... 48 Table 3-16. Frontal crash test chest clip measurements .................................................. 49 Table 3-17. Frontal crash test femur forces ..................................................................... 51 Table 3-18. “Good” side impact vehicle comparisons..................................................... 54 Table 3-19. “Good” side impact crash comparisons........................................................ 54 Table 3-20. “Good” side impact comparison occupant results........................................ 55 Table 3-21. Side impact dummy TTI measurements....................................................... 55
vi
List of Figures Figure 3-1. Real-World crash vehicle types .................................................................... 23 Figure 3-2. Real-World crash vehicle model years ......................................................... 23 Figure 3-3. CIREN case crash vehicle manufacturers ...................................................... 24 Figure 3-4. CIREN case crash weekday distributions ...................................................... 25 Figure 3-5. CIREN case crash monthly distributions ...................................................... 26 Figure 3-6. CIREN case crash occupant gender distribution........................................... 26 Figure 3-7. CIREN case occupant seating position by gender ........................................ 27 Figure 3-8. CIREN case crash occupant age distributions .............................................. 28 Figure 3-9. Comparison crash test results........................................................................ 29 Figure 3-10. Dummies used in comparison frontal crash tests........................................ 30 Figure 3-11. Dummies used in comparison side impact crash tests ................................ 31 Figure 3-12. Similarity scoring results for all comparison cases..................................... 33 Figure 3-13. Similarity score for frontal impacts............................................................. 34 Figure 3-14. Similarity score for side impacts................................................................. 35 Figure 3-15. Delta V comparison results ......................................................................... 38 Figure 3-16. Maximum crush comparison results ........................................................... 39 Figure 3-17. Difference in delta V versus difference in maximum crush ....................... 40 Figure 3-18. Difference in occupant height versus difference in occupant weight ......... 44 Figure 3-19. HIC36 injury probability: frontal impact comparison crash tests............... 48 Figure 3-20. Comparison case F5 orbital floor fracture .................................................. 49 Figure 3-21. Thoracic injury risk associated with chest clip measurement..................... 50 Figure 3-22. F5 occupant rib fractures............................................................................. 51
vii
Figure 3-23. Frontal crash test dummy femur force results............................................. 52 Figure 3-24. Comparison case F4 pelvic and femur fractures ......................................... 53 Figure 3-25. SID results from side impact comparisons for thorax................................. 56 Figure 3-26. Case occupant S2 pulmonary contusion and pneumothorax....................... 57 Figure 3-27. Case occupant S3 lateral and posterior rib fractures................................... 58 Figure 3-28. Pelvic fractures, occupant S3 ...................................................................... 59 Figure 3-29. Comparison S5 head injury probability ...................................................... 60 Figure 3-30. Crash comparison S5 thoracic injury probability........................................ 61 Figure 3-31. Side comparison case S5 pelvic injury probability ..................................... 62
viii
Abstract The first objective of this research was to create a repeatable method for finding similar crash tests to compare to real world crashes using the Crash Injury Research and Engineering Network (CIREN) database and common crash test databases. Each of the Toyota-Wake Forest University CIREN cases with horizontal principle direction of force (PDOF) impacts was compared to a similar crash test by developing a standard protocol for comparison methods. Once a similar case was found, a comparison technique was developed for the vehicle, crash, occupant, and injury characteristics between the cases. A similarity scoring method was created to determine how closely each case compared and then all scored cases were ranked. There were 18 “poor” comparisons, 72 “fair” comparisons, and 10 “good” comparisons.
By investigating this scoring method,
common similarities and differences between crash tests and real-world crashes were discovered. For all 10 “good” comparison cases that ranked at least 11 points out of a total of 13 points, further analysis was performed to compare dummy injury measures to real-world occupant injuries. This included anthropomorphic test device (ATD) injury assessment reference values and current injury criteria with associated risk curves. Only one crash test dummy analyzed in this study exceeded the critical value for the test. This was a side impact crash test where the pelvis exceeded the critical acceleration value. The comparison real-world case occupant sustained pelvic fractures as a result of their crash. In the future, this comparison method could be incorporated into existing crash databases to perform more comparisons. These results may prove to be essential in
ix
developing new soft tissue injury criteria, as well as investigating vehicle crashworthiness in reference to crash test results as well as real-world crashes.
x
1. Introduction The first objective of this research was to create a repeatable method for finding similar crash tests to compare to real world crashes using the Crash Injury Research and Engineering Network (CIREN) database and common crash test databases. Each of the Toyota-Wake Forest University CIREN cases with horizontal principle direction of force (PDOF) impacts was compared to a similar crash test by developing a standard protocol for comparison methods.
Multiple previous studies were examined for comparison
method techniques. After reviewing these studies, a comparison method was developed for use with real-world crashes in comparison to crash tests. A similarity scoring method was created to determine how closely each case compared and then all scored cases were ranked.
By investigating this scoring method, common similarities and differences
between crash tests and real-world crashes were discovered. For comparison cases with the most similarities, further analysis was performed to compare dummy injury measures to real-world occupant injuries. This included anthropomorphic test device (ATD) injury assessment reference values and current injury criteria with associated risk curves. In order to fully describe this new comparison method, former comparison techniques will be reviewed. The Crash Injury Research and Engineering Network will be described to introduce real-world crash parameters. Common crash test databases and dummies will then be examined.
1.1. Previous Comparison Methods Comparison methods have been used for vehicle crash data in the past. In 1969, crash test data from Australia, England, and the rural United States were compared for 1
crash type, vehicles, occupants, and injury characteristics [1]. This study also identified important dependent and independent variables used for crash analysis. The independent variables determined were speed at impact, type of impact, vehicle damage, and occupant seating positions. Dependent variables identified were injury severity, injury distribution, and cause of injuries. One metric for analysis was the delta V, which is a measure of the change in velocity due to a crash. This study also split differences in speed of impact into 10 mph bins for analysis. It was found that urban crashes had distinct differences from rural crashes, including lower delta V’s, higher incidence of side impacts, and lower injury severity for occupants. Door structures were found to contribute to injuries in side impacts and the instrument panel, steering assembly, and windshield contributed to injuries in frontal impacts. Tencer et. al analyzed data from the United States New Car Assessment Program (US-NCAP), National Automotive Sampling System – Crashworthiness Data Set (NASSCDS), and Crash Injury Research and Engineering Network (CIREN) data to examine pelvic and thoracic forces in side impact crashes [2]. Side NCAP results were examined from 165 different crash tests to investigate crush, door accelerations, impact heights, and side impact airbags. Dummy thoracic trauma index (TTI) and peak pelvic accelerations were used to analyze interior vehicle components that may have affected injury risk outcomes during a side impact crash. CIREN cases were chosen that involved side impacts with injuries to the pelvis, thorax, and abdomen. NASS-CDS data was also used to investigate the relationship between door crush and near-side occupant injury severity. The results showed that side impact airbags reduced injury risk according to TTI values measured in the dummies during crash testing. Door crush was found to have a high
2
correlation with injury severity. CIREN door crush measurements and occupant injury severity showed that real-world occupants are being severely injured in crashes at door crush in the range of NCAP test door crush measurements. This study pointed out the importance of investigating side impact crash tests in association with real-world crash occupant injuries. The University of Michigan Program for Injury Research and Education (UMPIRE) used CDC codes to match regulatory tests with CIREN cases from their center [3]. This compared crash tests and CIREN crashes based on the extent and type of damage of the CIREN case, and did not include factors such as delta V or occupant variables. Flannagan and Rupp noted that CIREN was a resource for identifying motor vehicle occupants that were severely injured in real-world crashes [4]. They used NASSCDS to analyze the incidence of injury in CIREN in relation to a larger population to estimate relative risk of injury. By setting specific inclusion criteria for the NASS-CDS and CIREN cases, they were able to compare the two populations across similar criteria. CIREN cases were found to have statistically significant higher Maximum Abbreviated Injury Scale (MAIS) than CDS cases, different crash type distributions, and a lower rate of seatbelt usage.
The study concluded that inclusion criteria needed to be very
specifically selected to allow for comparisons between the two databases. Harless and Hoffer examined NHTSA star ratings and Insurance Institute for Highway Safey (IIHS) ratings in comparison to results from Fatality Analysis Reporting System (FARS) [5]. For passenger cars, star ratings were statistically significant for a reduction of fatal crashes, but this was not seen for trucks.
3
One previous study developed an initial comparison technique between crash tests and real-world crashes that incorporated dummy resultant values and real-world occupant injuries [6]. This study used NHTSA NCAP and IIHS test results to examine dummy resultant HIC, chest, and femur measures for model year vehicles 1988 and 1989 using a vehicle clones list. Real-world occupant injury data was used from the Highway Injury Loss Data Institute (HLDI).
Results were compared across vehicle sizes, with the
objective of creating a comparison method used to predict new vehicle’s crashworthiness based on older models of the same vehicle. This study concluded that a comparison method was feasible, but complicated, and more research work was needed. As shown in previous studies, many factors were found to be important when trying to compare crashes. For the real-world crash, delta V, CDC code, crush, vehicle model, model year, restraint status, occupant size, and occupant seating position were important. For the crash test, it was important to know each of the different types of tests run and how they were performed. It was also important to know which type of dummy was used in each test. The most common crash test databases in the United States are compiled by the Insurance Institute for Highway Safety (IIHS) and the National Highway Traffic Safety Administration (NHTSA).
Each testing agency has its own set of
standards and protocols for the crash testing they conduct. The most common crash tests that pertain to comparing cases will be discussed in more detail in the following sections. From a real-world crash scene and vehicle investigation, like those performed for CIREN; crash measurements, crash scenario reconstructions, and occupant information can be gathered.
Using the information from these investigations and finding a
comparison case within the crash test databases, it is possible to compare crashes and
4
evaluate occupant injuries in relation to dummy crash test injury risk measurements.
1.2. Crash Injury Research and Engineering Network The Crash Injury Research and Engineering Network (CIREN) investigate realworld crashes that occur across the United States. The Toyota-Wake Forest University (T/WFU) CIREN Center has been enrolling cases since January of 2006. For enrollment as a CIREN case, the vehicle model year must be within 6 years of the current year and the occupant should have an AIS 3 injury or two or more AIS 2 injuries in different body regions. No ejected occupants can be enrolled in CIREN. There are injury severity, crash configuration, and model year exceptions for pediatric and pregnant cases. Cases with greater than six quarter turns, significant rear impacts, or complicated crash scenarios are excluded from CIREN [7]. For the purposes of this study, T/WFU CIREN cases with a principle direction of force (PDOF) between 0 and 359 degrees were analyzed for a comparison case within the crash test databases of NHTSA or IIHS. Nonhorizontal PDOF’s were excluded because these type of impacts are not currently tested. After a patient arrives at the trauma center following a motor vehicle crash, they are approached for enrollment in the CIREN study. After enrollment, a crash investigator performs an in-depth vehicle investigation acquiring crush and intrusion measurements, verification of safety systems utilized (3 point lap and shoulder belt, airbags, etc.), and also a scene investigation. The scene investigation is aided by police tick marks and crash debris at the crash site. After all measurements have been taken, they are input into WinSmash software program (Version 2007.02.05) and a delta V for the vehicle is calculated. A CDC code is assigned to each CIREN crash, and the contacts on the inside
5
of the vehicle for each occupant are recorded. Photographs of the exterior damage and interior contacts are taken. Medical records and radiologic images are then obtained for the CIREN occupant. Injuries are analyzed and categorized according to severity and body region using the Abbreviated Injury Scale (AIS) [8]. After all of this information has been gathered, it is reviewed by a multidisciplinary team consisting of medical doctors, engineers, and crash specialists. During this review, the injuries, occupant contacts, and kinematics are examined in order to determine which impacts and interior components of the vehicle contributed to the occupant’s injuries. The case review results are then input into the CIREN database. These CIREN case review results provide a large database for use in researching real-world crashes and resultant occupant injuries. By finding a comparison crash test for each of these T/WFU CIREN cases, it is possible to study real-world crash outcomes in relation to the similar crash test results. Once this comparison method has been fully developed, it can be extended to the rest of the CIREN database.
1.3. National Highway Traffic Safety Administration The National Highway Traffic Safety Administration (NHTSA) is a branch of the United States Department of Transportation. This regulatory agency was formed in 1970 to improve the safety of automobiles driven in the country. To accomplish this goal, the agency performs crash testing on new cars to determine vehicle safety regulations. For example, NHTSA performed approximately 200 crash tests on 2007 model year vehicles [9]. NHTSA is in charge of setting United States vehicle safety regulations that all car companies must pass.
6
NHTSA publishes safety star ratings for every new vehicle that is sold in the United States. This star rating gives an overall percent risk of incurring certain injuries for occupants, depending on the crash type. Star ratings inform consumers about how well a vehicle has performed in crash tests and are prominently displayed on new car sales stickers. Current NHTSA frontal star ratings indicate the chance of injury for the driver and right front passenger in a frontal collision where seatbelts are used properly (Table 1-1). These frontal star ratings are based on dummy values for the head and thorax regions. Serious injury is defined as an injury that would require immediate hospitalization and one that may be life threatening. Table 1-1. NHTSA frontal impact star ratings NHTSA Frontal Star Rating 10% or less chance of serious head or chest injury 11% to 20% chance of serious head or chest injury 21% to 35% chance of serious head or chest injury 36% to 45% chance of serious head or chest injury 46% or greater chance of serious head or chest injury NHTSA side impact star ratings are used for the first and second row occupants on the struck side of the vehicle where seatbelts are used properly (Table 1-2). The side impact star ratings are based on dummy values for the thorax only. Serious injury is defined in the same way as for frontal star ratings. Table 1-2. NHTSA side impact star ratings NHTSA Side Star Rating 5% or less chance of serious chest injury 6% to 10% chance of serious chest injury 11% to 20% chance of serious chest injury 21% to 25% chance of serious chest injury 26% or greater chance of serious chest injury
7
The NHTSA rollover star rating indicates the likelihood of a vehicle rolling over when involved in a single-vehicle crash (Table 1-3). This rollover rating is based on the static stability factor (SSF) and dynamic test results for each vehicle. The static stability factor is a calculation of a vehicle’s center of gravity with respect to the vehicle’s wheelbase. A typical range for this metric is between 1.0 and 1.5. A higher SSF means a vehicle is less likely to roll over in a single vehicle crash. The dynamic tests, which began in 2004, involve performing a fishhook maneuver with a fully loaded vehicle at a high speed. If tires on the same side of the vehicle leave the ground by at least 2 inches, it is considered to have “tipped”. This is then combined with the SSF to determine the rollover star rating. Table 1-3. NHTSA rollover star ratings NHTSA Rollover Star Rating Risk of rollover less than 10% Risk of rollover between 10% and 20% Risk of rollover between 20% and 30% Risk of rollover between 30% and 40% Risk of rollover greater than 40% A new NHTSA star rating system has been approved which will combine frontal, side, and rollover scores to create an overall Vehicle Safety Score (VSS). This new scoring system will go into effect for vehicle model years 2010 and beyond [10]. For crash comparisons, the most important tests performed by NHTSA are Federal Motor Vehicle Safety Standards (FMVSS) tests [11]. FMVSS 201 tests for occupant protection in interior impacts, FMVSS 208 is a frontal impact crash test, FMVSS 214 is a side impact crash test, and NCAP tests are performed at higher speeds to determine front and
8
side safety ratings for new vehicles. It is possible to compare these crash tests to realworld crashes to determine how well a vehicle’s safety features performed. Each of the most common NHTSA crash tests is detailed in Table 1-4. Table 1-4. Common NHTSA current crash test configurations Testing Agency
NHTSA
FMVSS
NHTSA
FMVSS
FMVSS
Test Type
Barrier
Fixed Rigid Barrier (984 NCAP mm x 2108 Frontal mm, 66 mm off ground) Fixed Rigid Pole (254 201 Pole mm, 10 inches) Moving Deformable NCAP Barrier (28 Side cm off ground, 56 cm high) Fixed Rigid Barrier (984 208 mm x 2108 mm, 66 mm off ground) Moving Deformable Barrier (28 214 cm off ground, 56 cm high)
Approx. Closing Speed
Angle of Impact
56 kph
0 degrees
28 kph
90 degrees with centerline
62 kph
270 degrees
48 kph
0 degrees
54 kph
270 degrees
NHTSA has also recently released updates to its NCAP and side impact testing procedures (Table 1-5). The NCAP changes will go into effect for model year 2010 vehicles. Updates to dummy metrics, dummies used, and the NHTSA star rating system were covered in the new release [10]. Not only did NHTSA update existing protocol, it
9
also added an FMVSS 214 oblique pole test which is to go into effect starting with 2012 model year vehicles. The new FMVSS 214 pole test will incorporate more dummy values into the side impact scoring system; such as thorax, head, and pelvis. These updates will provide even more opportunities for comparing crash tests to real-world crashes. Table 1-5. NHTSA future advancements Testing Agency
NHTSA
NHTSA
NHTSA
FMVSS
Test Type
Barrier
Fixed Rigid Barrier (984 NCAP mm x 2108 Frontal mm, 66 mm off ground) Moving Deformable NCAP Barrier (28 Side cm off ground, 56 cm high) Fixed Rigid NCAP Pole (254 Side mm, 10 Pole inches) Fixed Rigid Pole (254 214 Pole mm, 10 inches)
Approx. Closing Speed
Angle of Impact
56 kph
0 degrees
62 kph
270 degrees
32 kph
75 degrees with centerline
≤ 32 kph
75 degrees with centerline
1.4. Insurance Institute for Highway Safety The Insurance Institute for Highway Safety (IIHS) is a consumer agency funded by multiple insurance companies.
They perform crash tests in order to provide
consumers with unbiased vehicle safety ratings and crash test results. IIHS performed
10
approximately 150 crash tests on 2007 model year vehicles [12].
Their tests are
performed with different characteristics than NHTSA crash tests. IIHS side impact crash tests use a barrier that is higher and larger than the NHTSA crash test barrier [13, 14]. This larger barrier better represents the front end of an SUV, which addresses the issue of vehicle-mismatch crashes [15]. Vehicle incompatibility has been shown to generate more injuries for the occupants in the smaller vehicle, especially in side impacts where the front bumper of the larger vehicle impacts above the level of side door sill [16]. IIHS also performs frontal crash tests differently than NHTSA, using a 40% offset frontal barrier crash test. IIHS performs the 40% offset frontal crash tests into stationary barriers, which represents the crash configuration of a vehicle veering out of its lane and hitting an oncoming car [17]. IIHS common crash test configurations are shown in Table 1-6. Table 1-6. Common IIHS crash test configurations Testing Agency
Test Type
IIHS
Frontal Offset
IIHS
Side Impact
Impacting Dummy Impact Object Used Speed Deformable 50th % male Barrier (20 cm HIII belted, 64.4 from ground, 65 airbag, driver kph cm high x 45 seat cm thick) MDB (3300 lbs, 38 cm off ground, 76 cm high)
2 SID-IIs dummies, Driver and left rear seat, belted
50 kph
Configuratio n Offset 10% of veh width to the left
Drivers side 90 degree angle
IIHS has its own safety scoring system. They rate vehicles poor, marginal, acceptable, or good depending upon the crash test results. Dummy values, intrusion, and vehicle performance are evaluated to issue their ratings [18].
11
1.5. Crash Test Dummy Injury Criteria For each type of crash test performed by NHTSA or IIHS, there are maximum dummy values that must not be exceeded [19]. These maximum values have been determined through extensive cadaver and surrogate impact and injury testing. The NHTSA frontal impact dummy values are shown in Table 1-7 [20, 21]. These are used for FMVSS 208, frontal NCAP tests, and IIHS offset frontal crash tests. NHTSA has begun to add pediatric dummies in its most recent crash tests. The pediatric dummies are seated in the backseat, belted, and often in child safety seats (CSS). Dummy information can be extracted from the crash test report and compared to the injuries sustained by the case occupant. Table 1-7. Frontal crash test dummy critical values Frontal Impact Dummy Critical Values 50th % Body Region Standard Male Head HIC 15 700 Head HIC 36 1000 Neck Nij 1 Chest (g) 60 Thorax Deflection (mm) 63 Lower Extremity Femur (N) 10000
5th % Female 700 NA 1 60 52
6 yr old 700 NA 1 60 40
3 yr old 570 NA 1 55 34
1 yr old 390 NA 1 50 30
6800
NA
NA
NA
Table 1-8 contains the side impact dummy critical values [10, 21, 22]. These are used by both NHTSA and IIHS to assess if a crash test passes the dummy criteria. Common tests that use these dummies include FMVSS 214, FMVSS 214 pole, Side NCAP, and side IIHS crash tests.
12
Table 1-8. Side crash test dummy critical values Side Impact Dummy Critical Values Body Region Standard ES-2re Head HIC 36 1000 Deflection (mm) 44 Thorax Accel (g) NA Abdomen Force (kN) 6 Force (kN) Pubic= 6 Pelvis Accel (g) NA
SID-IIs 1000 NA 82 NA Iliac + Acet = 5.525 NA
SID 1000 NA TTI = 90 NA NA 130
By incorporating these dummy injury criteria with the other parameters measured during a crash test, a vehicle’s crashworthiness can be assessed.
13
2. Methods This study incorporated three different databases for the comparison of real-world crashes to crash tests. There were important characteristics in three main areas for each database: crash, vehicle, and occupant. The first step was defining the real-world crash. Next, the crash test database was searched according to the real-world crash information. Finally, the real-world crash and the crash test were compared and a similarity score was created to determine the best and worst comparisons based upon the designated parameters. For comparisons that received a high similarity score, further analysis was completed to compare the dummy measures from the crash test to the real-world occupant’s injuries. Each step of these techniques will be discussed in detail so that these methods may be used by other researchers to investigate vehicle safety.
2.1. Real-World Crash The first step in comparing real-world crashes to crash tests was to gather information about the real-world crash. Crash information was extracted from the crash report prepared by the T/WFU CIREN crash investigator. Important crash characteristics that were recorded for each vehicle are shown in Table 2-1. Many of these crash characteristics were used in the past to investigate real-world crashes.
The crash
investigator also provided numerous photographs for each vehicle’s exterior and interior.
14
Table 2-1. Important crash comparison parameters Crash Comparison Parameters CDC Vehicle Year Vehicle Make Vehicle Model Crash Configuration Delta V PDOF Maximum Crush Object Impacted In addition to crash and vehicle parameters, occupant characteristics were pulled from patient interviews and medical records at Wake Forest University Baptist Medical Center. Each occupant was a patient in the trauma center due to their involvement in a motor vehicle accident. From medical records, patient anthropomorphic measurements, gender, age, and injuries resulting from the crash were extracted.
These important
occupant characteristics were recorded with the crash and vehicle characteristics. Table 2-2. Important occupant comparison parameters Occupant Comparison Parameters Weight/Height Gender/Age Seating Position Restraint Status Injuries Sustained Each of the occupants’ injuries was scored using the Abbreviated Injury Scale (AIS) and Injury Severity Score (ISS). The injuries were then ranked according the AIS scale and body region injured for each occupant. For each injury, radiology images were selected from the patient’s trauma scan history. Using TeraRecon (V1.8.1.6) medical imaging software, 2D images and 3D images from CT scans were saved. Select injuries
15
were also segmented using Mimics (Materialise Software) software and were saved as .stl files. These three-dimensional models of the injuries were then printed using a ZCorp 450 3D printer. By 3D printing fractures, it is possible to visualize the mechanism of injury by studying the fracture pattern. Once all the CIREN real-world crash, vehicle, and occupant information was prepared, the comparison crash test was found.
2.2. Comparison Crash Test The second step in comparing real-world crashes to crash tests was to find a comparison crash test case. Because each vehicle model is not tested every year, a range of vehicle year/make/models needed to be found to perform a search of the databases. This was achieved by using the Sisters & Clones List to identify vehicles that did not undergo a significant change in body style or safety system revision [23]. Once this vehicle range was found, the real-world characteristics were examined to determine the database to search. The first method used to narrow the search database was to look at the Collision Deformation Classification (CDC) code for the real-world crash [3, 24]. Common CDC codes for each crash test database type are listed in Table 2-3. The most varied part of this code for the real-world crash is the extent zone (entry 7). This entry categorizes the extent of damage to the vehicle and it is more dependent on the vehicle structure than the crash configuration. Table 2-3. Common crash configuration CDC code Common Test Configurations Full Frontal Collision Offset Frontal Collision Side Impact Collision Pole Side Impact Collision
Common CDC Code 12FDEW3 12FLEE3 09LPEW3 09LPEN3
Regulatory Test FMVSS 208, Frontal NCAP IIHS Offset Frontal IIHS Side, FMVSS 214, Side NCAP FMVSS 214 Pole
16
If there was more than one crash event for the real-world vehicle, the impact that resulted in the occupant’s most serious injuries was the event that was used to search the crash test database. Often, this was the event with the highest delta V. The specific database to search was chosen based on the crash, vehicle, and occupant characteristics of the real-world crash. Table 2-4 lists general characteristics and the database best suited for comparison. There were important database limitations that also determined which was chosen to search for comparisons. The IIHS side impact crash test included in the IIHS online database was introduced for 2002 model year vehicles, so earlier vehicle model years involved in side impacts had to be searched in the NHTSA database only. Table 2-4. Common crash characteristics and associated crash tests Real-World Common Crash Types High speed full frontal impact Moderate speed full frontal impact Offset frontal impact Frontal impact w/ rear seat occupant High speed side impact Moderate speed side impact Side impact with large impacting vehicle
Crash Test Database NHTSA NCAP NHTSA FMVSS 208 IIHS Frontal NHTSA NCAP NHTSA SNCAP NHTSA FMVSS 214 IIHS Side
After searching the specific database for a range of vehicle year/make/models, a list of possible crash tests was shown. Each possible comparison crash test available was analyzed according to the real-world characteristics, focusing on the occupant characteristics in the final step of searching for a comparison case. A different crash test speed could be acceptable if the test contained the proper crash test dummy size and position in reference to the real-world occupant.
17
There were important crash test
occupant characteristics to know when completing this final step of comparison. Previous NHTSA FMVSS 208 tests were run with unbelted dummies. IIHS offset frontal impacts only had a driver dummy. Many recent NHTSA tests were run with pediatric dummies in the backseat in multiple child safety seat configurations. It was important to choose the crash test that best represented the occupant characteristics, as well as the crash and vehicle characteristics. This allowed for a closer comparison between dummy resultant measurements and the real-world crash occupant’s injuries.
Once a final
comparison crash test had been chosen, all files for the crash test were downloaded. Dummy injury criteria was extracted from the reports and applied to injury critical values and risk curves. The most commonly reported dummy measurement values were used, as an example of information that any consumer could easily acquire and analyze. This was done so that this comparison method could easily be applied to the consumer databases in the future. The crash test results and CIREN results were then compared.
Each crash,
vehicle, and occupant characteristic was compared to determine similarities and differences between the two cases.
2.3. Development of Similarity Score After finding comparison cases for each CIREN real-world crash, a scoring system was developed to determine the best comparisons according to crash, vehicle, and occupant parameters. A close comparison was needed to extract useful similarities and differences from the dummy and occupant injury results. Using the important crash, vehicle, and occupant characteristics outlined for searching for a comparison crash test, a
18
similarity scoring system was developed. This scoring system included 8 crash and vehicle parameters and 5 occupant parameters. One equally-weighted comparison point was assigned to each parameter, resulting in a maximum similarity score of 13 points. The requirements for each crash and vehicle parameter are listed in Table 2-5. Using the Sisters and Clones list, the vehicle year received a similarity point if it was in the correct model year range. The make/model received 1 similarity point if it was either the same model or a clone model, as listed in the Sisters and Clones list. The PDOF received a point if the real-world crash PDOF was within 20 degrees difference of the crash test PDOF. The delta V computed by WinSmash for the real-world vehicle had to be within 10 mph of the crash test delta V reported. If either delta V was unknown, the case did not receive a similarity point. The crash configuration for all of these cases was either frontal or side, and had to be the same for each comparison case. The type of crash also had to be the same to receive a similarity point. The type of crash refers to whether it was full frontal or near side or far side, etc. The size and shape had to be equivalent for the impacted object, according to the selection of crash tests available.
Finally, the
maximum crush measured on the real-world vehicle had to be within 10 cm of the maximum crush measurement reported by the crash test. If this was unknown, the case did not receive a similarity point.
19
Table 2-5. Crash and vehicle parameter requirements for similarity score Comparison Characteristic Vehicle Year Vehicle Make/Model PDOF Delta V Configuration Type Impacted Object Maximum Crush
Requirement for Point S&C List S&C List +/- 20 degrees +/- 10 mph Exact Exact Similar shape/size +/- 10 cm
The requirements for each occupant parameter are listed in Table 2-6. For frontal impacts, occupant parameter received 1 point if it exactly matched the occupant parameter for driver or front passenger, or if both occupants were backseat passengers. For side impacts, occupant position had to match exactly. The airbag parameter received 1 point if the airbag deployment was the same according to the crash configuration. For this parameter, frontal airbag deployment was not considered in assigning points for side impacts, and side airbag deployment was not considered for frontal impacts. Occupant height received one similarity point if it was within 3 inches of the dummy height, and occupant weight received one similarity point if it was within 10 pounds of the dummy weight. Table 2-6. Occupant parameter requirements for similarity score Occupant Characteristics Occupant Position Belted Airbags Occupant Height Occupant Weight
Requirement for Point Exact for crash configuration Exact Exact for crash configuration +/- 3 inches +/- 10 lbs
20
After reviewing the similarity scoring results, a rank was assigned to scoring spreads to designate poor, fair, and good comparisons. A poor comparison earned 7 points or less. A fair comparison earned 8 to 10 points. A good comparison earned 11 points or greater. Each comparison characteristic was also analyzed to determine how many cases correlated with the parameter to earn a similarity point. All comparisons receiving a rank of “good” were further analyzed according to occupant injuries and dummy measurement injury probabilities. These injury comparisons were not included in the similarity scoring because they were considered outcomes of the comparison methods. The main reason for this is due to the fact that none of the regulated dummy measurements exceeded their performance limits, so they would not predict a high incidence of injury severity for those measures. Alternatively, the CIREN occupants had all received serious injuries due to the real-world crash. In the comparison of these cases, dummy injury criteria were used to calculate the injury probability for each body region. A one-page crash test summary was created to compliment the one-page case summaries that were made for each real-world crash.
21
3. Results The results were divided into separate sections, relating to the comparison methods. The first results were for the T/WFU CIREN cases that were chosen for comparison. The second set of results detailed the comparison crash tests chosen for comparison. The real-world crashes compared to the crash tests are then reported.
Finally, the
comparisons that earned a “good” rank are analyzed according to crash test dummy measurements and real-world occupant injuries.
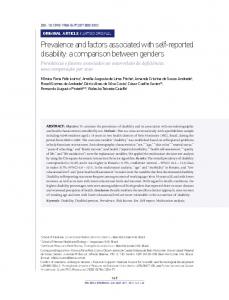
3.1. CIREN case selection From the T/WFU CIREN center, cases 001 through 120 were selected for analysis. After excluding all cases with non-horizontal main impacts, 100 cases were available for finding comparison crash tests. Of these cases, 66 were frontal impacts and 34 were side impacts. Figure 3-1 shows the breakdown of cases according to vehicle body type.
22
Case Vehicle Body Type .
Van
9
Pickup
14
SUV
17
Passenger Car
60
0
10
20
30
40
50
60
70
Number of Case Vehicles Figure 3-1. Real-World crash vehicle types The case vehicle model years ranged from 1997 to 2009, as shown in Figure 3-2.
14
14
11
12
12
12
12 10
10
6 2
1
Vehicle Model Year Figure 3-2. Real-World crash vehicle model years
23
2009
2008
2007
2006
2005
2004
2003
2002
2001
2000
1999
0 1998
0 1997
0
7
4
4 2
8
7
8
1996
Number of Case Vehicles .
16
The case vehicles represented 21 different vehicle manufacturers. 16
Chevrolet Toyota
14 14
Vehicle Manufacturer .
Ford 13
Honda Dodge
7
Nissan
7 5
Chrysler Mitsubishi
4 3
Saturn Mazda Jeep
2 2
Infiniti Lexus
2 2
Kia Hyundai
2 1 1
Suburu
1
Acura Cadillac Mercedes
1 1
Pontiac Scion
1 1 0
2
4
6
8
10
12
14
16
18
Number of Case Vehicles Figure 3-3. CIREN case crash vehicle manufacturers More of these case vehicle crashes occurred on the weekend than during the week. The average number of crashes occurring on the weekend (Friday, Saturday, Sunday) was 17 while the average number of crashes occurring during the week was only 12.
24
24
25 20 15
18 15
14 12 10
10
7
Saturday
Wednesday
Tuesday
Monday
Sunday
0
Friday
5
Thursday
Number of Cases Crashed
30
Figure 3-4. CIREN case crash weekday distributions More crashes occurred during the summer months of June, July, and August (38) than during the fall months of September, October, and November (16) and spring months of March, April, and May (22). There were more crashes in the winter around the holidays in December and January, resulting in a winter total of 24. The monthly distributions of crashes can be seen in Figure 3-5.
25
16
15 12
12
12 11
9
9
9
8 6 4
4
6
6
November
10
October
Number of Cases
14
4
3
December
September
August
July
June
May
March
February
January
0
April
2
Crash Month Figure 3-5. CIREN case crash monthly distributions There were 63 female case occupants and 37 male case occupants from the 100 CIREN cases selected.
Male 37% Female 63%
Figure 3-6. CIREN case crash occupant gender distribution
26
Most case occupants (73 %) were drivers in the CIREN crashes. There were very few rear seat passengers (8 %). 50 45 40
Case Count
35 30
Female
25
Male
20 15 10 5 0 Driver
Front Passenger
Rear Passenger
Occupant Position Figure 3-7. CIREN case occupant seating position by gender The average age of the female case occupants was 47.5 years old and the average age of male case occupants was 40.8 years old, resulting in an overall case occupant average age of 45.0 years old.
27
14
13
12
Number of Case Occupants
Female
12 10
10
Male
10
9
8
8 6
6 4
6 5 4
4 3
2
3 2
2
2
1 0
0 0-9
10-19
20-29
30-39
40-49
50-59
60-69
70-79
80-89
Occupant Age Group Figure 3-8. CIREN case crash occupant age distributions After gathering all the real-world case information about crash, vehicle, and occupant characteristics, a comparison crash test was found for each case.
3.2. Comparison Crash Tests After finding a comparison crash test for each CIREN crash, 67 % of comparison crash tests came from the NHTSA database and 33% came from the IIHS database. Figure 3-9 shows the breakdown of crash tests according to database and crash configuration.
28
45 Frontal Side
40
Number of Cases
35 30 25 20 15 10 5 0 NHTSA
IIHS
Crash Test Database Figure 3-9. Comparison crash test results There were 66 frontal impact crash tests found. This included fifty-seven 50th percentile male dummy occupants, seven 5th percentile female dummy occupants, and two HIII 3 year old dummy occupants, both of which were seated in a child safety seat.
29
60
50
Case Count
40
30
20
10
0 50th % Male
5th % Female
HIII 3 year old
Dummy Type - Frontal Crash Tests Figure 3-10. Dummies used in comparison frontal crash tests In the 34 side impact crash tests, two occupants were ES-2 dummies, twenty-four occupants were SID dummies, and eight occupants were SID-IIs dummies.
30
30
25
Case Count
20
15
10
5
0 ES-2
SID
SID-IIs
Dummy Type - Side Crash Tests Figure 3-11. Dummies used in comparison side impact crash tests Each of these dummies differs in height and weight. Table 3-1 shows the measurements for each crash test dummy used in the comparison cases. The weight for the ES-2 dummy was adjusted because this dummy weighs the amount of a 50th percentile male without arms. Therefore, the weight of the ES-2 was listed as that of the 50th percentile male at 172 lbs because all of our comparison occupant’s weights included upper limbs. This same weight adjustment was used on the SID-IIs, because this dummy does not have a right arm. The weight used for the SID-IIs is the weight listed for the 5th percentile female.
31
Table 3-1. Crash test dummy heights and weights Dummy Height (in) Weight (lbs) 50th % Male HIII 69 172 Frontal 5th % Female HIII 59 108 3 year old HIII 37 35 ES-2 (50th % Male) 69 172 Side SID (50th % Male) 69 170 SID-IIs (5th % Female) 59 108 After reviewing the results for the CIREN parameters and the crash test parameters, the two were combined to develop a similarity scoring method.
3.3. Similarity Scoring The results of the similarity scoring showed a large range in similarity scores for the comparison cases. The overall range for the scoring was from 5 points to 12 points, with an average of 7.7 points.
32
Similarity Scoring Results 30
Number of Cases
25
25
26
Number of Cases
21 20 15 11 10 5 0
3 0
0
0
0
1
2
3
4
6
4
4 0
5
6
7
8
9
10
11
12
13
Similarity Score Figure 3-12. Similarity scoring results for all comparison cases Of the 66 frontal crashes which were compared, 10 cases received a “poor” rank, 51 cases received a “fair” rank, and 5 cases received a “good” rank. No cases received a perfect similarity score of 13 points. Similarity scores with good rank were indicated with patterned bars in Figure 3-13.
33
Similarity Scoring Results- Frontal Impact 25 20
Number of Cases
20 16
15
15
10 6
5 2
0
0
0
0
0
1
2
3
4
3
2
2 0
5
6
7
8
9
10
11
12
13
Similarity Score Figure 3-13. Similarity score for frontal impacts For the side impact cases, 8 cases received a “poor” rank, 21 cases received a “fair” rank, and 5 cases received a “good” rank. Once again, no cases received a perfect similarity score of 13 points. Side similarity scores with good rank are indicated with patterned bars in Figure 3-14.
34
Similarity Scoring Results- Side Impact 25
Number of Cases
20
15 10
10
6 5
5
0
5 3
0
0
0
0
1
2
3
4
1
5
2
2 0
6
7
8
9
10
11
12
13
Similarity Score Figure 3-14. Similarity score for side impacts After completing the comparison scores, the crash and vehicle characteristics that compared the best were crash configuration (100%), vehicle year (98%), and vehicle make/model (92%). The characteristics with the worst comparisons were the object impacted (56%), the delta V (39%), and the maximum crush measurement (35%). The final results of the crash and vehicle characteristic comparisons are shown in Table 3-2.
35
Table 3-2. Crash and vehicle similarity comparisons Crash & Vehicle Characteristics Vehicle Year Vehicle Make/Model PDOF Delta V Configuration Type Impacted Maximum Crush
Cases Receiving Similarity Point 98 92 80 39 100 76 55 35
The parameters that compared the worst were then broken down to investigate the differences between the real-world crash and the crash test. The impacted objects in frontal crashes differed in size and shape, mainly due to more pole impacts in the realworld crashes. Cases receiving 1 similarity point for the impacting objects parameter are listed in bold in Table 3-3. The CIREN impacted objects are listed in the left column with the crash test impacted objects listed across the top. Table 3-3. Impacted objects comparison results for frontal impacts
CIREN
Frontal Impacts Standard Vehicle Large Vehicle Pole-type Other
Crash Test Standard Barrier Pole 0 20 0 16 24 2 4 0
For side impact comparisons, the main difference was the size of the impacting object. Cases receiving 1 similarity point for the impacting object parameter are listed in bold in Table 3-4. The CIREN impacted objects are listed in the left column with the crash test impacted objects listed across the top.
36
Table 3-4. Impacted objects comparison results for side impacts
CIREN
Side Impacts Standard Vehicle Large Vehicle Pole-type Other
Crash Test Standard Barrier Large Barrier 0 10 12 6 4 1 0 0
Pole 0 0 1 0
Delta V comparisons were computed by subtracting the real-world delta V from the crash test delta V. Therefore, a negative delta V range had a higher delta V for the crash test and a positive delta V range had a higher delta V for the real-world crash. Delta V ranges receiving the similarity point were designated with the striped bars in Figure 3-15. When the delta V was unknown for either the crash test or the real-world crash, a similarity point was not assigned for this parameter.
37
Delta V Comparison Ranges
Number of Cases .
30
27
25
20
20
17
18
15
10
10
5
5
2
1
20