Edward J. Sadler, Kenneth A. Sudduth, and Fessa- ...... However, McDowell and McGregor (1984) ..... Society of Agricultural Engineers, St. Joseph, Michigan.
Development of a conservation-oriented precision agriculture system: Water and soil quality assessment R.N. Lerch, N.R. Kitchen, R.J. Kremer, W.W. Donald, E.E. Alberts, E.J. Sadler, K.A. Sudduth, D.B. Myers, and F. Ghidey ABSTRACT: A comprehensive approach to achieving sustained crop productivity and profitability requires implementation of conservation systems that simultaneously consider soil and water quality. The objectives of this study were to: 1) assess long-term surface and groundwater quality in a conventionally managed field; 2) assess long-term changes in soil quality in a conventionally managed field; and 3) use this assessment to support development of the precision agriculture system presented in the companion paper. The study site was a 36-ha (89 ac) field in the Central Claypan Area of northeastern Missouri. The field was managed in a cornsoybean rotation using mulch tillage and soil incorporated fertilizer and pre-emergence herbicide inputs for 13 years (1991 to 2003). In general, agrichemical leaching to groundwater was minimal, but the existing management system negatively impacted the quality of surface runoff in five of the nine years reported. Preliminary spatial assessment indicated that the northern half of the field has been the main source of herbicides, nutrients, and sediment transported in surface runoff from this field. Topsoil loss and, therefore, decreased depth to the claypan from historic erosion of the field was a key soil quality indicator related to limitations in crop productivity. Spatial variability in soil loss over the last 150 to 200 years controls the soil quality, water quality, and crop productivity patterns currently observed within this field. Therefore, spatial variability in soil erosion, or a surrogate measure such as depth to claypan, serves as a useful basis for the development of a comprehensive precision agriculture system. Keywords: Precision agriculture system, runoff, soil erosion, soil quality, spatial variability, topsoil depth, water quality
Best management practices (BMPs) to improve soil and water quality encompass an array of strategies, including reduced or no tillage, crop rotation, cover crops, off-site bioremediation (e.g., vegetative buffers), reduced chemical inputs, and more efficient use of chemical inputs, such as variable rate application (USDA, 1999; Ward et al., 1994; Larson et al., 1997). Past research has focused on developing cropping systems that reduce soil erosion as a way to sustain soil quality and maintain or improve water quality (Ascough and Flanagan, 2001). Hydrologic processes, such as surface runoff and percolation, physically link soil erosion and soil quality to water quality. Thus, a comprehensive
Reprinted from the Journal of Soil and Water Conservation Volume 60, Number 6 Copyright © 2005 Soil and Water Conservation Society
approach to implementation of conservation systems should simultaneously address soil and water quality. Precision conservation is an example of such a system (Berry et al., 2003). In this approach, soil and water conservation management practices are implemented by taking into account spatial and temporal variability across natural and agricultural landscapes. The soil quality concept involves the capacity of a soil to function; included among the soil functions are water flow and retention, physical stability and support, retention and cycling of nutrients, and maintenance of biodiversity, habitat, and crop productivity (Karlen et al., 1997; Marques da Silva and Soares, 2001; Andrews et al., 2004). Soil
erosion is a key factor controlling soil quality and crop productivity (Larson et al., 1983; Marques da Silva and Soares, 2001). Moreover, soil quality and soil erosion are closely linked. For example, water-stable soil aggregates are important to maintenance of soil structure, which improves infiltration, reduces erosion, and enhances soil quality (Kremer and Li, 2003). The concept of soil quality not only includes sustaining crop productivity but also maintaining environmental quality, and it is likely the enhancement of soil quality that would be a major step toward improving or maintaining water quality (Kennedy and Papendick, 1995; Delgado et al., 1999; Delgado and Follett, 2002). Various conservation tillage systems, including no-till, have been among the most frequently studied conservation practices, and they have consistently been shown to reduce soil erosion (Langdale et al., 1979; Ghidey and Alberts, 1998; Klik et al., 2001; Reddy et al., 2001) and improve soil quality (Arshad et al., 1990; Doran, 1987). However, the water quality benefits of conservation tillage can vary substantially depending upon application method, chemical properties of inputs, and soil characteristics (Ghidey and Alberts, 1998; Klik et al., 2001; Reddy et al., 2001). In a long-term study on a claypan soil, Ghidey and Alberts (1998) reported that notill greatly reduced soil loss, but it increased runoff volume by 14 to 20 percent compared to conventional and chisel tillage. This creates a vulnerable situation for no-till systems implemented on soils with high runoff potential because soil-applied herbicides and, in some cases, fertilizers are not incorporated. Hence, the greater runoff volume associated with the use of no-till on these soils may facilitate greater dissolvedphase losses of herbicides and nutrients in runoff compared to tillage systems that incorporate chemical inputs.
Robert N. Lerch, Newell R. Kitchen, Robert J. Kremer, William W. Donald, Edward E. Alberts, Edward J. Sadler, Kenneth A. Sudduth, and Fessahaie Ghidey all work for the U.S. Department of Agriculture Agricultural Research Service, Cropping Systems and Water Quality Research Unit, at the University of Missouri-Columbia, Columbia, Missouri. D. Brenton Myers works as a graduate fellow in the Department of Soil, Environmental and Atmospheric Sciences, also at the University of Missouri-Columbia, Columbia, Missouri.
N| D 2005
VOLUME 60 NUMBER 6
411
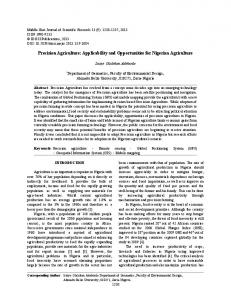
Photo 1 Conventional agronomic practices for row crop production have degraded soil and water resources in the Central Claypan Area (Major Land Resource Area 113; USDA, 1981) of the Midwestern United States, a region dominated by high runoff potential soils (Lerch and Blanchard, 2003). In 1990, the Midwest Management Systems Evaluation Area (MSEA) project was initiated to address the environmental impacts associated with rowcrop production (Ward et al, 1994). The Missouri MSEA project was established within Goodwater Creek watershed (Figure 1), an area dominated by claypan soils. An initial assessment of groundwater quality for three fields within the watershed showed that historical crop and fertilizer management practices had significantly impacted groundwater nitrate-nitrogen (NO3-N) levels (Kitchen et al., 1997). In addition, several studies showed that surface water contamination by herbicides (Alberts et al., 1995; Donald et al., 1998; Lerch et al., 1995; Lerch and Blanchard, 2003) and sediment (Ghidey and Alberts, 1998) were significant water quality problems within claypan soil watersheds. These ground and surface water quality studies provided an initial evaluation of the impact of prevailing and historic cropping systems on water resources within the Central Claypan Area at both field and watershed scales. Building on these prior investigations, the objectives of this study were to: 1) assess long-term surface and groundwater quality in a conventionally managed mulch-tillage field; 2) assess longterm changes in soil quality in a conventionally managed field; and 3) use this assessment to support development of a precision agriculture system. The goal of the precision agriculture system, presented in the companion paper (Kitchen et al., 2005), is to use sitespecific management to improve profitability and protect soil and water resources as compared to past management practices. Methods and Materials Field description. The 36-ha (89-ac) field is located near the town of Centralia in northcentral Missouri (Lat. 39.2297, Lon. 92.1169) (Figure 1). The field (Photo 1) is typical of the Central Claypan Area, which occupies about 4 million ha (10 million ac) in Missouri and Illinois (Soil Survey Staff, 1992; USDA, 1981). Within the field, 1.5 to 3.0 m (5 to 10 ft) of loess overlies 3 to 12 m (10 to 40 ft) of glacial till. The modern soil devel-
412
JOURNAL OF SOIL AND WATER CONSERVATION N| D 2005
Photograph of the study field and adjacent research plots, taken on December 9, 2004, showing groundwater flow direction and the location of the weir, weather station, and well nests (A-E).
Figure 1 Map showing location of the study field.
Goodwater Creek watershed
Study field 3 km
Audrain County
Boone County
Table 1. Management of the Missouri claypan soil study field. Time period
Management practices
early 1900s - 1960
• • • • • •
1961 - 1980
1981 -1990
1991 - 2003
• • • • • • • • •
Crop production under plow and disc tillage for north end of field (north of east-west treeline). Unsure of crops but most likely corn and wheat based on historical records of crops generally grown in this area. South of east-west treeline pastured (approximately 7 ha). Little or no manure application on field. Crop production under plow and disk tillage north of treeline. North of treeline, cropped in soybean, corn, and grain sorghum (approximately 85, 10, and 5 percent of the time respectively). South of east-west treeline pastured. Some manure application from nearby feedlot. Crop production under disc and field cultivator tillage for whole field (pasture taken out about 1981). Cropped in soybean, grain sorghum, and wheat (approximately 40, 40, and 20 percent of the time respectively). No animal manures applied. Uniform management (i.e., no variable-rate management). Corn (odd yrs) - soybean (even yrs) rotation (one exception: grain sorghum replaced corn in 1995 because persistent spring rains delayed planting). Mulch tillage, typically 1 disc and 1 or 2 field cultivation passes in spring prior to planting. Corn/grain sorghum herbicides: 2.24 kg ha-1 of both atrazine and alachlor from 1991 to 1995; and 2.24 kg ha-1 of
both atrazine and of metolachlor from 1997 to 2003. • Soybean herbicides: 2.24 kg ha-1 of alachlor from 1991 to 1995, and 2.24 kg ha-1 metolachlor from 1996 to 2003. Also, 0.13 L ha-1 of imazaquin, all years. • Nitrogen: 190 kg N ha-1 (123 kg N ha-1 for grain sorghum) usually as urea-ammonium-nitrate solution, pre-plant broadcast, then incorporated. • Phosphorus: 90, 56, 90 kg P2O5 ha-1 in 1993, 1995, and 2001, respectively, pre-plant broadcast, then incorporated. • Potassium: 67, 56, 90 kg K2O ha-1 in 1993, 1995, and 2001, respectively, pre-plant broadcast, then incorporated. • Lime: 6.7 Mg ha-1 in December 1999.
oped from the loess and contains a claypan that limits water percolation and promotes surface water runoff. Clay content in the argillic horizon is usually greater than 500 g kg-1 (50 percent) and is comprised of smectitic (high shrink-swell) clay minerals. These soils have a unique hydrology with slow percolation in the soil matrix of the clay layer when wet (i.e., mainly winter and spring seasons), but rapid preferential flow through cracks after the profile dries in late summer and early fall (Jamison et al., 1968). The soils on fields in this area are generally classified as Adco silt loam (fine, smectitic, mesic aeric Vertic Albaqualfs) and Mexico silt loam (fine, smectitic, mesic aeric Vertic Epiaqualfs). The deeper loess and till collectively define the glacial till aquifer; the source of groundwater monitored in this research. Groundwater recharge occurs primarily by flow through cracks in the claypan and other preferential pathways (Blevins et al., 1996). Management history before 1991. Most crop fields lack reliable historical information. Consequently, the best historic management information for this field was obtained by interviewing previous landowners and leaseholders (Table 1). We also obtained a
Figure 2 Aerial photos of the study field showing historic farmsteads and different field divisions over the years.
1939
1956
1968
sequence of aerial photos of the field, dating back to the 1930s (Figure 2), from the county U.S. Department of Agriculture Farm Service Agency (USDA-FSA) (then the Agricultural Stabilization and Conservation Service). These two information sources were used to create an understanding of pre-1991 agricultural practices on the field. Our assessment found this field comparable to other claypan soil crop production fields in this area (Kitchen et al., 1997).
1982
1990
Management and assessment from 19912003. In October 1990, this field was selected as a research site for the Missouri Management Systems Evaluation Area project (MSEA) (Ward et al., 1994). A weather station was installed on the west side of the field (Photo 1) to collect climatic variables, including hourly and daily precipitation, temperature, wind, and solar radiation. Spatially variability in soil properties and crop production from this field have been previously pub-
N| D 2005
VOLUME 60 NUMBER 6
413
lished (Kitchen et al., 1999; Kitchen et al., 2003; Sudduth et al., 2003), and additional details are provided in the companion paper (Kitchen et al., 2005). Crop management practices. The study field was managed uniformly for a high yield goal in a corn-soybean (Zea mays L. - Glycine max (L.) Merr.) rotation, using mulch-tillage to maintain ~30 percent residue cover. Corn was grown in odd years and soybean was grown in even years. Because a wet spring delayed planting in 1995, grain sorghum (Sorghum bicolor L.) was substituted for corn. Additional practices are described in Table 1. Background information on the overall goal of this system has been described (Ward et al., 1994). Water quality assessment. In the early spring of 1991, the field was instrumented with five groundwater well nests, with four wells per nest. Three nests were located within the field boundary and two nests were positioned along the field edge (Photo 1). The wells within each nest were within close proximity of each other, with the total nest area encompassing about 25 m2 (270 ft2). The wells within each nest were drilled and screened at different depths to determine groundwater flow direction and water quality differences by depth. In June 1992, an additional shallower well was drilled at each well nest. Screened intervals of the five wells at each nest ranged from 1.2 m (4 ft) (top of the glacial till) to 15.7 m (51.6 ft) (bottom of the glacial till). Additional details of well installation and sample collection procedures were previously documented (Blanchard and Donald, 1997; Kitchen et al., 1997). Well samples were collected quarterly (March, June, September, and December) from June 1991 through June 1996, and semi-annually (March and September) from 1997 through 2004. Because of low recharge rates, some deeper wells were sampled annually. Between 1991 and 2004, over 650 groundwater samples were collected and analyzed. To help interpret the potential source of groundwater NO3-N, the amount of fertilizer N left on the field after a growing season was mapped, both annually and cumulatively for all years with N fertilizer inputs. N removed with harvested grain was determined by yield mapping (corrected for moisture) combined with the average corn or sorghum grain N content of 0.016 kg N ha-1 (0.014 lb N ac-1). The residual N maps were then derived by subtracting the amount of N removed with
414
JOURNAL OF SOIL AND WATER CONSERVATION N| D 2005
grain harvest from the amount of fertilizer applied (Table 1) [i.e., fertilizer N - (mapped yield X 0.016 kg N per kg grain)]. For surface water assessment, a v-notch concrete weir was constructed in 1991 at the north end of the field and equipped with a runoff water stage recorder and a refrigerated pumping sampler (Photo 1). Runoff from all but three percent of the total field area discharges at this location, and there was no runoff from adjacent fields onto this field. The sampler automatically collected a sample when flow over the weir was approximately 0.8 mm (0.03 in), and continued to sample through the runoff event. Samples were refrigerated before transport to the laboratory. Samples were filtered through a 0.45-µm nylon filter and analyzed for atrazine [6-chloro-2-ethyl-4-(1-methylethyl)-1,3,5triazine-2,4-diamine], alachlor [2-chloro-N(2,6-diethylphenyl)-N-(methoxy-methyl) acetamide], metolachlor [2-chloro-N-(2ethyl-6-methylphenyl)-N-(2-methoxy-1methylethyl) acetamide], dissolved nitrogen (NO3-N, NH4-N), dissolved phosphorus (P04-P), and sediment. From 1991 to 1996, herbicides were isolated and concentrated by solid-phase extraction and quantified by gas chromatography with an N-P detector (Lerch et al., 1995; Blanchard and Donald, 1997). For surface runoff samples, limits of detection for the gas chromatography/N-P method were 0.04 µg L-1 (parts per billion, ppb) for atrazine, 0.23 µg L-1 for alachlor, and 0.29 µg L-1 for metolachlor, and limits of detection for groundwater samples were onehalf that of surface runoff samples (Blanchard and Donald, 1997). Beginning in 1997, atrazine and metolachlor in runoff samples were analyzed by magnetic particle enzymelinked immunosorbent assays (Strategic Diagnostics, Inc., Warminster, Pennsylvania). Limits of detection for the enzyme-linked immunosorbent assay method were 0.05 µg L-1 for both herbicides. Samples from the first two to three runoff events each year typically were diluted to be within the linear range of the enzyme-linked immunosorbent assay kits (0.05 to 5 µg L-1). Dissolved nutrient analyses were determined by colorimetric methods using a Lachat flow injection system (Lachat Instruments, Milwaukee, Wisconsin) as described by Lerch et al. (2001). Between 1993 and 2001, 815 surface runoff samples were collected and analyzed. To illustrate herbicide persistence spatially, multivariate regression models for atrazine
persistence over time (at 18 days R2 = 0.50; at 28 and 58 days R2 = 0.35) were developed from measurements of soil organic matter content, cation exchange capacity, and pH (Ghidey et al., 1997). This model was then applied to grid soil sample points over the whole field (n = 468), kriged, and mapped. Soil quality assessment. Two aspects of soil quality are reported here: 1) a mapping analysis of topsoil depth; and 2) measures of soil microbial activity and aggregate stability. The objective of the topsoil depth analysis was to highlight where and to what extent topsoil depth has degraded (i.e., soil quality degraded) since cultivation of crops started 150 to 200 years ago. Profile descriptions of similar soils on un-cultivated sites allowed for the assignment of possible horizonation and topsoil depth, circa 1800. The un-cultivated topsoil depth was then estimated by identifying the exposed horizon from unambiguous areas of bare-soil remotely-sensed images of the field following procedures in Hong et al. (2002). For example, dark color areas were classified as soil mostly un-eroded, light-grey color areas were where the A horizon had been lost and the E horizon was exposed, and red-orange areas showed where the Bt horizon was exposed. Assuming that topsoil loss processes were dependent on topography, a quadratic model (R2 = 0.66) of slope and elevation was used to map the original topsoil depth based on the image-derived point estimations. To quantify topsoil loss and to identify specific areas of the field with the greatest topsoil loss, we constructed a topsoil depth difference map by subtracting the current topsoil depth map, based on EM-38 soil electrical conductivity (ECa) data obtained in 1999 (Sudduth et al., 2003), from the estimated 1800 topsoil depth map. For soil quality measurements of microbial activity and aggregate stability, a limited dataset of indicators was available from longterm cropping system research plots adjacent to the study field (see Photo 1). Management on one of the cropping systems has been nearly identical to management practices on the study field (Kitchen et al., 1998). Surface bulk soil samples (0 to 10 cm or 0 to 4 in depth) were collected in 2001, 2003, and 2004 using a stainless steel probe [10-cm diameter (4 in)] along transects within each research plot. From these samples, soil microbial activity expressed as fluorescien diacetate hydrolysis and dehydrogenase enzymatic activity was determined following pro-
Figure 3
Nitrate-N (mg l-1) Nitrate-N (mg l-1) Nitrate-N (mg l-1) Nitrate-N (mg l-1)
Results and Discussion Groundwater quality. NO3-N concentrations were quite variable, ranging from a low of 0.3 mg L-1 (parts per million, ppm), to a high of 46 mg L-1. Averaged over all samples, NO3-N concentration was 5.2 mg L-1, with seven percent of the well samples exceeding 10 mg L-1, a common state and federal drinking water standard. Nitrate concentration averaged over all wells in 1993 (after the shallower wells were installed) was 5.1 mg L-1 (parts per million, ppm), and in 2004 (excluding the shallow well in nest C), NO3-N was 5.6 mg L-1, suggesting little change over time. Of the five wells in each nest, NO3-N levels in shallow, medium, and deep wells were plotted over a 14-year period to further illustrate that NO3-N in most wells changed little over this time period (Figure 3). Within a nest, NO3-N concentrations at varying depths of the glacial till can be nearly identical over time (nest B), or vary greatly (nest A). There were no consistent relationships found between NO3-N level and well depth. Also, in a few wells NO3-N concentration rose and fell rapidly around the year 2002 (see nests A, D, and E in Figure 3 as examples). These results support a characterization of the glacial till aquifer in which NO3-N storage was stratified and water movement predominantly occurred by preferential flow through fractures (Blevins et al., 1996; Kitchen et al., 1998). The shallow well in nest C had unusually high NO3-N concentration increases from 2000-2004. For eight years, NO3-N concentrations in this 2.7-m (8.9 ft) deep well were less than 5 mg NO3-N L-1. Starting in the fall of 2000, NO3-N concentration in this well dramatically increased, first to about 20 mg L-1, then to above 40 mg L-1 in recent years. Extremely dry conditions from July through September of 1999 (Kitchen et al., 2005, Table 1) resulted in unusually large soil cracks visible at the soil surface that summer. In addition, well elevation levels during this period dropped below
Nitrate-N (mg l-1)
cedures in Kremer and Li (2003). Fluorescien diacetate is a general substrate for several hydrolytic enzymes including esterases, lipases, and certain proteases; dehydrogenase estimates respiratory activity of viable soil microorganisms. Water-stable aggregates in 10 mm (0.4 in) sieved, air-dried soil samples were measured and expressed as the percentage of total aggregates, greater than 250 µm, that were water-stable after wet-sieving.
Groundwater nitrate-nitrogen (NO3-N) concentration over 14 years from three wells at each of the five well nests (A-E) on the study field (left graphs). Right shows annual (top) and cumulative (bottom) maps of the fertilizer N left on the field as determined by subtracting estimated grain N from the amount of fertilizer applied. 50 2.3 m 45 7.0 m 9.7 m 40 35 30 25 20 15 10 5 0 Mar-91 Mar-93 Mar-95 Mar-97 Mar-99 Mar-01 Mar-03
E
50 2.7 m 45 8.5 m 11.5 m 40 35 30 25 20 15 10 5 0 Mar-91 Mar-93 Mar-95 Mar-97 Mar-99 Mar-01 Mar-03
1993
1999
169
185
16
115
1995
2001
135
150
45
65
1997
2003
155
190
43
85
D
50 2.7 m 45 8.5 m 14.2 m 40 35 30 25 20 15 10 5 0 Mar-91 Mar-93 Mar-95 Mar-97 Mar-99 Mar-01 Mar-03
Annual residual N (kg ha-1)
C
50 2.7 m 45 6.8 m 14.4 m 40 35 30 25 20 15 10 5 0 Mar-91 Mar-93 Mar-95 Mar-97 Mar-99 Mar-01 Mar-03
B
Total Residual N (kg ha-1)
E D
780
C
B
50 2.7 m 45 6.8 m 13.4 m 40 35 30 25 20 15 10 5 0 Mar-91 Mar-93 Mar-95 Mar-97 Mar-99 Mar-01 Mar-03
A
the depth of shallow wells on the field (unpublished data). Thus, these cracks effectively connected the soil surface to the top of
520
A
the glacial till and allowed preferential flow and influx of soil water containing high NO3-N levels. Other than the few wells that
N| D 2005
VOLUME 60 NUMBER 6
415
Figure 4 showed NO3-N spikes since 2000, no clear trend exists to indicate groundwater NO3-N has been greatly impacted as a result of crop management practices over the last 13 years. Characteristics of the field soils, the glacial till, and climate help explain the spatial variation observed in groundwater NO3-N levels. An evaluation of groundwater elevation within the five well nests indicated groundwater flow to be in a north-west direction. To determine which areas within the field contribute more N to groundwater nitrate, we developed maps of the fertilizer N left on the field as determined by subtracting grain N from the amount of fertilizer applied (Figure 3). Leaching of fertilizer N, as NO3-, to groundwater is just one of many potential N transformation pathways. However, the maps provided a reasonable depiction of temporal (year-to-year) and spatial (within field) variability in fertilizer N that has the potential for leaching to groundwater. When examining individual years, residual fertilizer N was relatively high in all years except 1995, which had an extremely wet spring and early summer (Kitchen et al., 2005, Table 1), suggesting a high degree of denitrification for this year. For 1997, 1999, 2001, and 2003, corn yield was low because of droughty conditions during the growing season (Kitchen et al., 2005,Table 1), and it was lowest in field areas with shallow topsoil thickness (Figure 4). A map of the cumulative residual fertilizer N (Figure 3) showed that its spatial patterns closely corresponded to soil ECa, an indirect measure of topsoil depth (Kitchen et al., 1999). In essence, corn growth and yield
Topsoil depth has changed as a result of modern agriculture. Estimated topsoil depth map prior to modern tillage practices (left), current topsoil depth map (center), and the map of net loss of topsoil (right) obtained by taking the difference of the first two maps.
1999
1800
1800 -1999
Depth to Claypan (cm) 10
20
30
40
50
60
Topsoil loss (cm) 70
80
90 100 110 120
were poor in areas where topsoil thickness was 0.04 in) of runoff after N fertilizer application, but there were major runoff events in both years that occurred within about three weeks of application. In 1997, the first event accounted for 72 percent of the annual N transport, and the first two events in 1999 accounted for 83 percent of the annual N transport. The impact of N fertilization on ammonium and nitrate loads was evident when comparing loads between fertilizer application and non-application years. Average nitrate load in fertilizer application years was 10.6 kg N ha-1 (9.5 lb ac-1) compared to an average load of only 0.84 kg N ha-1 (0.75 lb ac-1) in non-application years. Assuming an organic-N mineralization rate of two percent per year, average soil organic-N content of 2.0 g kg-1 (0.2 percent), and negligible atmospheric N inputs, the combined nitrate and ammonium loads in surface runoff accounted for 4.8 percent of the applied and mineralized N from 1993 to 2001. This represents considerably greater N losses in surface runoff than have been reported in other studies in which N losses accounted for less than one percent of applied N (Alberts et al., 1978; Barisas et al., 1978; Owens and Edwards, 1993). The high runoff potential of the claypan soils, combined with significant runoff events within 30 days of application, led to the overall high N losses in runoff at this site. Dissolved P transport in surface runoff was mainly related to mass input, runoff amount, and soil pH (Table 2). Three of the five highest P loads occurred in the same year as P fertilizer application (1993, 1995, and 2001), and all three years also had high annual runoff and multiple runoff events following P application, leading to the high observed loads. The other two years with high P loads (1998 and 1999) occurred several years after P fertilizer application, had few runoff events, and
N| D 2005
VOLUME 60 NUMBER 6
417
Figure 5 thus, P transport in these years could not be explained by P input mass or amount of runoff. P solubility is highly pH dependent and it increases with decreasing pH (Lindsay, 1979). The use of Ca-based liming agents to maintain near-neutral soil pH will result in the precipitation of calcium phosphates, but as soil pH drops below six, dissolution of the calcium phosphates will substantially increase PO43- solubility. By 1997, significant portions of the field were below pH six since it had been over seven years since the previous lime application (Table 1; Kitchen et al., 2005, Figure 1). Hence, the high P loads observed in 1998 and 1999 very likely reflected the low soil pH. Furthermore, after lime was applied in December 1999, P load during 2000 was the lowest observed for the study. Average annual dissolved P load was 0.33 kg ha-1 (0.29 lb ac-1), and total dissolved P load over the nine years accounted for 1.3 percent of the applied fertilizer P. The average annual dissolved P load from this field was greater than that reported in other surface runoff studies in which dissolved P load was typically less than 0.25 kg ha-1 (0.22 lb ac-1) for conventional and conservation tillage systems (Barisas et al., 1978; Johnson et al., 1979; McDowell and McGregor, 1984). However, McDowell and McGregor (1984) reported similar or higher dissolved P losses for no-till corn than those reported here. Sediment transport from the field was a function of annual runoff amount and the time of year in which major runoff events occurred (Table 2). Four of the five highest annual sediment loads occurred in the highest runoff years. The high sediment load in 1993 occurred as a result of multiple large runoff events in July and September of that year. The largest sediment load of the study occurred during a series of two runoff events from April 12-20, 1993, with total runoff of 6.5 cm (2.6 in). This event accounted for 63 percent of the annual sediment load. Despite record precipitation in 1993, the sediment load for the year was only slightly higher than the “erosion factor T” of 6.72 Mg ha-1 (3 t ac-1) for these soils (USDA-NRCS, 1995). In 1997, three large runoff events that occurred during the winter and spring months resulted in high sediment concentrations that accounted for 90 percent of the annual sediment load. Overall, mean sediment load was 3.45 Mg ha-1 (1.59 t ac-1) or about 53 percent of the erosion factor T for these soils.
418
JOURNAL OF SOIL AND WATER CONSERVATION N| D 2005
Predicted atrazine persistence in the soil at 18, 30, and 58 days after application as a function of soil pH, organic matter, and cation exchange capacity (CEC).
Day 18
Day 30
Day 58
Atrazine residual (ppm) 0
0.45
0.9
1.35
1.80
2.25
Two studies place herbicide and sediment loss within a spatial context. First, spatiallyvariable sediment loss off-field was obvious when change in topsoil depth as a result of modern agriculture was estimated. Net soil loss was greatest on the northern half of the field, suggesting this was the most vulnerable area of the field to erosion processes (explained further under “Soil quality”). Second, spatial variability of herbicide concentration in the soil over time was assessed on a portion of this field, and then related to other soil properties (Ghidey et al., 1997). Soil herbicide persistence increased with increasing cation exchange capacity and soil organic matter, but decreased with increasing pH. Thus, areas of the field that have both high soil cation exchange capacity and organic matter and low pH will correspond to areas with the greatest herbicide persistence. Atrazine persistence was greatest on a few small areas on the south end of the field (associated with high organic matter from historic farmsteads), and areas in the north half of the field (Figure 5). Since slope (Kitchen et al., 2005, Figure 1) and therefore runoff generation is greater in the north end of the field, this area represents the greatest risk of herbicide loss in runoff. Soil quality. Jung et al. (2005) spatially evaluated selected chemical, physical, and microbiological parameters of soil quality on this study field during the 2002 growing season, and correlated these to sensor-based
2.7
3.15
3.60
4.05
4.5
ECa measurements. Of the soil quality indicators measured, topsoil depth was most strongly related to crop productivity. Previous analysis on claypan soil fields supported this conclusion (Kitchen et al., 1999; Kitchen et al., 2003). Water erosion, accelerated by modern agricultural practices, results in significant soil loss and a change in topsoil depth for claypan soils (Jamison et al., 1968). Topsoil loss has been highest in the northern three-quarters of the field. Topsoil losses were estimated to be as high as 30 cm (12 in) in some areas on the north end of the field (Figure 4). The portion of the field south of the east-west tree-filled fence line has only been in crop production for about 30 years (Table 1) and is quite flat (Kitchen et al., 2005, Figure 1). Averaged over the whole field, we estimated 13 cm (5 in) of soil loss (i.e., moved off the field) over the last 150 years. Using an average topsoil bulk density of 1.3 g cm-3 (Jung et al., 2005), this represents 1690 Mg ha-1 (754 t ac-1), or about 11.3 Mg ha-1 yr-1 (5.0 t ac-1 yr-1) when assuming 150 years of intensive agricultural practices. This calculated average soil loss is considerably more than that measured from 1993 to 2001 (Table 2); however, we suspect moldboard plowing practices of earlier years increased erosion rates compared to recent mulch tillage practices. Because the physical and chemical characteristics of the argillic claypan horizon are not well suited for crop root growth (Scrivner et al., 1985), loss of topsoil
Table 3. Microbial enzyme activity and water-stable aggregates in a claypan soil on the cropping systems evaluation plots adjacent to the precision agriculture system field. Cropping system
Year
Corn-soybean; minimum tillage system
2001
Corn-soybean-wheat (cover crop); no-tillage system
FDA* hydrolase
Dehydrogenase
————— µmol product g-1 soil h-1 ————— 2130 b 3.70 a
Water-stable aggregates (%) 6.8 d
2004
2200 b
2.50 b
12.5 c
2001
3480 a
3.70 a
5.8 d
Cool-season meadow (CRP)
2001 3900 a 4.80 a 18.4 b 2003 3370 a 4.76 a 36.4 a 2004 3500 a 5.00 a 49.7 a Values within a column followed by the same letter are not significantly different based on least significant difference (p=0.05). * FDA= fluorescien diacetate
represents irreparable soil quality degradation. The interaction of erosion with landscape topography will largely control the spatial variability in soil quality and crop productivity within the field. This is supported by Marques da Silva and Soares (2001), who reported that spatial variation in hay production was primarily explained by the clay + silt content of soil and profile curvature (i.e. concave or convex hillslopes). These two parameters essentially reflected erosion patterns over the field, which in turn, controlled the spatial variation in soil quality and hay productivity. Our limited research on adjacent plots showed that soils collected from a long rotation (three or more crops) with no-till or permanent vegetation cool-season grasses had greater fluorescien diacetate hydrolytic and dehydrogenase activities than soils under short rotation (corn-soybean) with minimum tillage (Table 3). From 1991 to 2004, the corn-soybean, minimum tillage system on the plots has been managed the same way as the study field. The proportion of water-stable soil aggregates was associated with higher soil enzyme activity except for the long rotation-no-till system (Table 3). The representative enzyme activities and water-stable aggregate analyses determined in our survey are useful parameters for assessing soil quality (Dick, 1997). Increased microbial activity and the associated improved soil aggregation in the cropping systems under longer periods of continuous vegetation may reflect a greater availability of substrates that support such activity. Summary and Conclusion Nitrate leaching is a potential threat to the glacial till aquifer, and it posed a much greater risk of contaminating groundwater than do herbicides in this setting. However, the conventional crop management practices
employed on this field over the last 13 years have not significantly increased groundwater NO3-N concentrations over levels caused by historical management. Observed increases in groundwater NO3-N have generally been limited to preferential flow in localized areas of the field following summer droughts that restricted crop growth and N uptake, leading to high levels of residual N in the surface soil. This aquifer is generally less vulnerable than others because of low soil percolation through the claypan, especially in spring and early summer (the time period of most herbicide and fertilizer applications). Herbicide, nutrient, and sediment transport in surface runoff showed that surface water quality impacts from conventional management were of much greater concern than groundwater contamination in this setting. Over a nine-year period, the key factor controlling herbicide transport in surface runoff was the timing of runoff events relative to application, but herbicide incorporation did slightly reduce annual losses compared to other field studies. The greater losses of atrazine compared to alachlor and metolachlor were mainly due to the greater soil persistence of atrazine. Dissolved N losses in surface runoff were primarily a function of input mass whereas dissolved P transport was related to input mass, annual runoff quantity, and soil pH. Nutrient transport in runoff was generally greater from this field than that reported in the literature. The use of a mulch tillage system reduced average annual soil loss to about one-third of the historic erosion rate for the field. However, in four out of nine years, erosion rates were essentially equal to the erosion factor T for these soils. Preliminary spatial assessment indicated that the field does not uniformly add to surface water quality impairment. Generally, the
northern half of the field has been the most significant source of herbicides, nutrients, and sediment transported in surface runoff from this field. The soil quality parameters measured at the adjacent cropping systems site appear to be sensitive in detecting changes in soil function due to different management practices. Soil enzyme activities were closely related to the amount of continuous vegetative cover, and water-stable aggregates were consistently lower in cropped plots compared to permanent vegetation cool-season grass plots. These soil quality parameters may be useful in predicting and/or monitoring changes in soil function on this field under the newly developed precision agriculture system. Topsoil loss and, therefore, decreased depth to the claypan from historic erosion of the field has been shown to limit crop productivity due to restricted root growth and lower plant available water in the claypan. Moreover, the spatial variability in soil loss over the last 150 to 200 years controls the soil quality, water quality, and crop productivity patterns currently observed within this field. Soil erosion is the fundamental process through which the various indicators of environmental quality are integrated. Therefore, spatial variability in soil erosion, or a surrogate measure such as depth to claypan, serves as a useful template upon which a comprehensive precision agriculture system can be developed. Acknowledgements We thank the U.S. Department of Agriculture Cooperative State, Research, Education, and Extension Service’s Special Water Quality Grants programs for financial support of this research. Thanks to Dr. L. Stanley, J.S. Absheer, W.M. Olson, M.R. Volkmann, S.T. Drummond, K.W. Holiman, and R.L. Mahurin for their assistance in
N| D 2005
VOLUME 60 NUMBER 6
419
the collection and analysis of water and soil samples. Special thanks to Mr. D.F. Collins for his cooperation in allowing us to conduct investigations on his field.
Endnote Mention of trade names or commercial products in this article is solely for the purpose of providing specific information and does not imply recommendation or endorsement by the U.S. Department of Agriculture. References Cited Alberts, E.E., R.C.Wendt, and R.E. Burwell. 1978. Seasonal runoff losses of nitrogen and phosphorus from Missouri valley loess watersheds. Journal of Environmental Quality 7:203-208. Alberts, E.E.,A.T. Hjelmfelt,W.W. Donald, and N.R. Kitchen. 1995. Herbicide transport in surface runoff from three field-sized watersheds in Missouri. Pp. 5-8. In: Proceedings of Clean Water-Clean Environment-21st Century; U.S. Department of Agriculture and American Society of Agricultural Engineers, St. Joseph, Michigan. Andrews, S.S., D.L. Karlen, and C.A. Cambardella. 2004.The soil management assessment framework: A quantitative soil quality evaluation method. Soil Science Society of America Journal 68:1945-1962. Arshad, M.A., M. Schnitzer, D.A. Anders, and J.A. Ripmeester. 1990. Effects of till vs. no-till on the quality of soil organic matter. Soil Biology Biochemistry 22:595-599. Ascough, J.C. and D.C. Flanagan. 2001. Soil Erosion Research for the 21st Century, American Society of Agricultural Engineers, St. Joseph, Michigan. Barisas, S.G., J.L. Baker, H.P. Johnson, and J.M. Laflen. 1978. Effect of tillage systems on runoff losses of nutrients: A rainfall simulation study. Transactions of the ASAE 21:893-897. Berry, J.K., J.A. Delgado, R. Khosla, and F.J. Pierce. 2003. Precision conservation for environmental sustainability. Journal of Soil and Water Conservation 58(5):332-339. Blanchard, P.E. and W.W. Donald. 1997. Herbicide contamination of groundwater beneath claypan soils in NorthCentral Missouri. Journal of Environmental Quality 26:1612-1621. Blevins, D.W., D.H. Wilkerson, B.P. Kelly, and S.R. Silva. 1996. Movement of nitrate fertilizer to glacial till and runoff from a claypan soil. Journal of Environmental Quality 25:584-593. Capel, P.D., S.J. Larson, and T.A. Winterstein. 2001. The behaviour of 39 pesticides in surface waters as a function of scale. Hydrological Processes 15:1251-1269. Delgado, J.A. and R.F. Follett. 2002. Carbon and nutrient cycles. Journal of Soil and Water Conservation 57(6):455-464. Delgado, J.A., R.T. Sparks, R.F. Follett, J.L. Sharoff, and R.R. Riggenbach. 1999. Use of winter cover crops to conserve soil and water quality in the San Luis Valley of Soith Central Colorado. Pp. 125-142. In: Soil Quality and Soil Erosion. R.Lal (ed.) Soil and Water Conservation Society, Ankeny, Iowa. Dick, R.P. 1997. Soil enzyme activities as integrative indicators of soil health. Pp. 121-156. In: Biological indicators of soil health. C.E Pankhurst, B.M Doube, and V.V.S.R. Gupta (eds.) CAB International, Oxford, UK.
420
JOURNAL OF SOIL AND WATER CONSERVATION N| D 2005
Donald, W.W., A.T. Hjelmfelt, Jr., and E.E. Alberts. 1998. Herbicide distribution and variability across Goodwater Creek Watershed in North Central Missouri. Journal of Environmental Quality 27:999-1009. Doran, J.W. 1987. Microbial biomass and mineralizable nitrogen distributions in no-tillage and plowed soils. Biology Fertile Soils 5:68-75. Ghidey, F., E.E.Alberts, and R.N. Lerch. 1997. Spatial and temporal variability of herbicides in a claypan soil watershed. Journal of Environmental Quality 26:1555-1563. Ghidey, F. and E.E. Alberts. 1998. Runoff and soil losses as affected by corn and soybean tillage systems. Journal of Soil and Water Conservation 53(1):64-70. Hong,S.Y.,K.A.Sudduth,N.R.Kitchen,S.T.Drummond,H.L. Palm, and W.J.Wiebold. 2002. Estimating within-field variations in soil properties from airborne hyperspectral images. CD-ROM. In: Proceedings of PECORA Conference on Land Satellite Information in the Next Decade, Denver, Colorado, November 11-14, 2002. Jamison,V.C., D.D. Smith, and J.F. Thornton. 1968. Soil and water research on a claypan soil. U.S. Department of Agriculture Agricultural Research Service Technical Bulletin No. 1379. U.S. Government Printing Office, Washington, D.C. Johnson, H.P., J.L. Baker,W.D. Shrader, and J.M. Laflen. 1979. Tillage system effects on sediment and nutrients in runoff from small watersheds.Transactions of the ASAE 22:1110-1114. Jung,W.K., N.R. Kitchen, K.A. Sudduth, R.J. Kremer, and P.P. Motavalli. 2005. Claypan soil quality indicators can be characterized using apparent soil electrical conductivity. Soil Science Society of America Journal 69:883-892. Karlen, D.L., M.J. Mausbach, J.W. Doran, R.G. Cline, R.F. Harris, and G.E. Schuman. 1997. Soil quality:A concept, definition, and framework for evaluation. Soil Science Society of America Journal 61:4-10. Kennedy, A.C. and R.I. Papendick. 1995. Microbial characteristics of soil quality. Journal of Soil and Water Conservation 53(4):243-252. Kitchen, N.R., P.E. Blanchard, D.F. Hughes, and R.N. Lerch. 1997. Impact of historical and current farming systems on groundwater nitrate in northern Missouri. Journal of Soil and Water Conservation 52(4):272-277. Kitchen, N.R., D.F. Hughes,W.W. Donald, and E.E. Alberts. 1998. Agrichemical movement in the root-zone of claypan soils: ridge- and mulch-tillage farming systems compared. Soil and Tillage Research 48:179-193. Kitchen, N.R., K.A. Sudduth, and S.T. Drummond. 1999. Soil electrical conductivity as a crop productivity measure for claypan soils. Journal of Production Agriculture 12:607-617. Kitchen, N.R., S.T Drummond, E.D. Lund, K.A. Sudduth, and G.W. Buchleiter. 2003. Soil electrical conductivity and topography related to yield for three contrasting soil-crop systems. Agronomy Journal 95:483-495. Kitchen, N.R., K.A. Sudduth, D.B. Myers, R.E. Massey, E.J. Sadler, R.N. Lerch, J.W. Hummel, and H.L. Palm. 2005. Development of a conservation-oriented precision agriculture system: II. Crop production assessment and plan implementation. Journal of Soil and Water Conservation 60(6):421-430. Klik,A.,A.S. Zartl., and J. Rosner. 2001.Tillage effects on soil erosion, nutrient, and pesticide transport. Pp. 71-74. In: Soil erosion research for the 21st Century. J.C. Ascough and D.C. Flanagan (eds.) American Society of Agricultural Engineers, St. Joseph, Michigan. Kremer, R.J. and J. Li. 2003. Developing weed-suppressive soils through improved soil quality management. Soil and Tillage Research 72:193-202.
Langdale, G.W., A.P. Barnett, R.A. Leonard, and W.G. Fleming. 1979. Reduction of soil erosion by the no-till system in the Southern Piedmont. Transactions of the ASAE 22:82-86, 92. Larson, W.E., F.J. Pierce, and R.H. Dowdy. 1983. The threat of soil erosion to long-term crop production. Science 219:458-465. Larson, W.E., J.A. Lamb, B.R. Khakural, R.B. Ferguson, and G.W. Rehm. 1997. Potential of site-specific management for nonpoint environmental protection. Pp. 337-367. In: The state of site-specific management for agriculture. F.J. Pierce and E.J. Sadler (eds.) Agronomy Society of America, Crop Science Society of America, Soil Science Society of America, Madison,Wisconsin. Lerch, R.N., W.W. Donald,Y.X. Li, and E.E. Alberts. 1995. Hydroxylated atrazine degradation products in a small Missouri stream. Environmental Science and Technology 29:2759-2768. Lerch, R.N., J.M. Erickson, and C.M.Wicks. 2001. Intensive monitoring in two karst basins of Boone County, Missouri. Pp. 157-168. In: Proceedings of the 15th National Cave and Karst Management Symposium. G.T. Rea (ed.) Gainesville, Florida. Lerch, R.N. and P.E. Blanchard. 2003.Watershed vulnerability to herbicide transport in northern Missouri and southern Iowa streams. Environmental Science and Technology 37:5518-5527. Lindsay, W.L. 1979. Chemical equilibrium in soils. John Wiley and Sons, New York, New York. Lowrance, R., R.K. Hubbard, and R.G. Williams. 2000. Effects of a managed three zone riparian buffer system on shallow groundwater quality in the southeastern coastal plain. Journal of Soil and Water Conservation 55(3):212-219. Marques da Silva, J.R. and J.M.C.N. Soares. 2001. Spatial variability of soil quality indicators, a consequence of soil erosion. Pp. 59-62. In: Soil erosion research for the 21st Century. J.C. Ascough and D.C. Flanagan (eds.) American Society of Agricultural Engineers, St. Joseph, Michigan. McDowell, L.L. and K.C. McGregor. 1984. Plant nutrient losses in runoff from conservation tillage corn. Soil and Tillage Research 4:79-91. Owens, L.B. and W.M. Edwards. 1993.Tillage studies with a corn-soybean rotation: Surface runoff chemistry. Soil Science Society of America Journal 57:1055-1060. Reddy, G.B., C.W. Raczkowski, M.R. Reyes, and G.A. Gayle. 2001. Surface losses of N, P, and herbicides from a long-term tillage study at North Carolina A&T State University. Pp. 669-672. In: Soil erosion research for the 21st Century. J.C. Ascough and D.C. Flanagan (eds.) American Society of Agricultural Engineers, St. Joseph, Michigan. Scrivner, C.L., B.L. Conkling, and P.G. Koenig. 1985. Soil productivity indices and soil properties for farm-field sites in Missouri. Missouri Agriculture Experiment Station Publication No. EC0947. University of Missouri, Columbia, Missouri. Soil Survey Laboratory Staff, 1992. U.S. Department of Agriculture Soil Conservation Service National Soil Survey Center, Soil Survey Inventory Report No. 42, version 2.0, August, 1992. Sudduth, K.A., N.R. Kitchen, G.A. Bollero, D.G. Bullock, and W.J.Wiebold. 2003. Comparison of electromagnetic induction and direct sensing of soil electrical conductivity. Agronomy Journal 95:472-482. U.S. Department of Agriculture (USDA). 1981. USDA Agricultural Handbook. 296 pp.
U.S. Department of Agriculture-Natural Resources Conservation Service (USDA-NRCS). 1995. Soil Survey of Audrain County, Missouri (1995—387974/00537/SCS), U.S. Government Printing Office, Washington, D.C. U.S. Department of Agriculture-Natural Resources Conservation Service (USDA-NRCS). 1999. CORE4 Conservation Practices Training Guide. The Common Sense Approach to Natural Resource Conservation. Vencill,W.K. 2002. Herbicide Handbook, 8th Edition;Weed Science Society of America, Lawrence, Kansas. Ward, A.D., J.L. Hatfield, J.A. Lamb, E.E. Alberts, T.J. Logan, and J.L. Anderson. 1994. The management systems evaluation areas program: Tillage and water quality research. Soil and Tillage Research 30:49-74.
N| D 2005
VOLUME 60 NUMBER 6
421