Journal of Physics: Conference Series
PAPER • OPEN ACCESS
Development of a dynamically scaled wind turbine To cite this article: Roman Rachholz et al 2018 J. Phys.: Conf. Ser. 1037 052033
View the article online for updates and enhancements.
This content was downloaded from IP address 216.74.106.61 on 19/06/2018 at 01:50
The Science of Making Torque from Wind (TORQUE 2018) IOP Conf. Series: Journal of Physics: Conf. Series 1037 (2018) 1234567890 ‘’“” 052033
IOP Publishing doi:10.1088/1742-6596/1037/5/052033
Development of a dynamically scaled wind turbine Roman Rachholzˡ, René Bartkowiakˡ, Andreas Schulzeˡ, Johannes Lutheˡ, János Zierath², Christoph Woernleˡ, ˡ Chair of Technical Dynamics, University of Rostock, 18051 Rostock, Germany ² W2E Wind to Energy GmbH, 18055 Rostock, Germany E-mail: {roman.rachholz,woernle} @uni-rostock.de,
[email protected] Abstract. Experimental analyses of modal parameters on operating wind turbines are associated with great technical expense, standstill times and therefore with high costs. This makes experimental research on operating wind turbines, for example testing innovative measurement strategies, uneconomical. Thus it is desirable to conduct portions of experimental research on laboratory test structures. In this paper the development of a scaled laboratory test rig is presented. It is designed in such a manner that the lower natural frequencies of a reference wind turbine are approximately reproduced. To find feasible physical parameters for the test rig, preliminary analyses based on an analytical model of a vertical cantilever beam with a top body were combined with experiments based on Operational Modal Analysis (OMA) and multibody simulations.
1. Introduction Experimental identification of modal properties on operating wind turbines is associated with standstill times and therefore with high costs. For example experimental analysis of modal properties of a 2 MW wind turbine by means of Operational Modal Analysis (OMA) [1] techniques was conducted with acceleration measurements at 61 sensor positions in seven measurement campaigns, each with a duration of 90 minutes [2]. Ongoing measurements on similar wind turbines required even more measurement time as additional sensor positions on the blades are needed to improve identification of tower, blade, mixed and closely spaced modes. Beyond the measurements themselves significant portions of additional standstill times are needed to equip, rearrange and reinstall sensors and cables on the structure, especially on the tower and rotor blades. It becomes evident that development and testing of measurement procedures on operating wind turbines is highly uneconomical. Therefore a dynamically scaled laboratory test rig was developed for testing innovative measurement strategies before their application on real wind turbines. The present contribution describes the design of the test rig with respect to the desired dynamic properties, its mechanical construction and first measurements of its dynamic properties. The objectives and requirements for the test rig are described in section 2. The dynamic design of the test rig is based on an idealized analytic model presented in section 3. In section 4 the mechanical design is introduced. Further, the data acquisition system and the acceleration sensors utilized for dynamic measurements are described. Comparisons between measurements and analytical calculations show the validity of the test rig design.
Content from this work may be used under the terms of the Creative Commons Attribution 3.0 licence. Any further distribution of this work must maintain attribution to the author(s) and the title of the work, journal citation and DOI. Published under licence by IOP Publishing Ltd 1
The Science of Making Torque from Wind (TORQUE 2018) IOP Conf. Series: Journal of Physics: Conf. Series 1037 (2018) 1234567890 ‘’“” 052033
IOP Publishing doi:10.1088/1742-6596/1037/5/052033
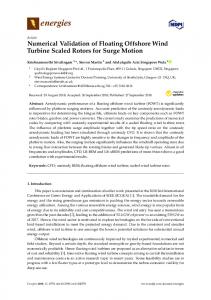
2. Wind turbine test rig objectives and requirements The principal objective of the test rig is to develop innovative measurement strategies aimed at an enhanced identification of modal properties on real wind turbines. Compared to measurements on real wind turbines, the time for preparation and reconfiguration of measurement equipment is significantly reduced, and there are no constraints with respect to downtimes. It is even possible to excite the structure manually and to observe eigenmodes at lower frequencies. Different data acquisition systems (data transmission using cables, WLAN or GPS) and sensors (measurement principle, frequency range, sensitivity, signal to noise ratio) can be applied and compared. Optimized sensor positions on the structure for the identification of lower frequency modes can be found. Strategies to identify modal properties during operation by means of OMA techniques are also investigated. A secondary objective is to study the dynamic behaviour of the scaled wind turbine including parameter sensitivity analyses with changing pitch, rotor and tilt angles at standstill and in operation. In addition vibration reducing concepts are investigated in order to enhance the dynamic behaviour. The 2 MW wind turbine developed by W2E GmbH [3] was defined as the reference system for the test rig design. A major requirement for the test rig is that it exhibits similar fundamental frequencies of tower and blade modes and the rotational speed of the rotor. Accordingly, the first tower bending modes in fore-aft and side-side direction are defined to be close to 0.3 Hz and the first blade bending mode flapwise to be at 0.7 Hz [4]. To simulate in operation under full load, a rotational speed of 15 rev/min is required. This dynamic design of the test rig enables the evaluation of sensors and data acquisition systems in the low frequency range. Another limitation is given by the size of the laboratory that limits the overall height of the test rig to 5.75 m . To enable clear interpretations of eigenmodes, the mechanical components of the test rig should have simple geometries. Therefore straight beams with constant cross sections for tower and blades were chosen. Aerodynamic lift forces are neglected. Accordingly wind-induced rotation is not necessary. 3. Dimensioning the test rig based on an analytical design model The tower and the blades of the test rig have to be dimensioned in such a way that the system exhibits the desired fundamental frequencies according to the reference wind turbine. As these frequencies are very low, with the first natural frequency close to 0.3 Hz , stability against buckling also has to be considered. A vertical cantilever beam, loaded by its self-weight, and a rigid body mounted on the top according to Figure 1a is used as a model for preliminary design that can be analysed analytically. It enables estimations of the tower with nacelle and rotor represented by the top body.
mK ,Jyy
N (x, t )
w(x,t )
N (x, t ) dx x
dx
(x,t )
ds (x, t ) g ds
M (x, t )
E, A, Iyy,
a)
y
x
P
M (x, t ) dx x Q(x, t ) Q(x, t ) dx x dmw(x, t ) M (x, t )
Q(x, t )
d
yy
(x, t )
St
N (x, t )
z
y
b)
x
z
Figure 1. a) Vertical cantilever beam additionally loaded by a rigid body at the free end. b) Free body diagram of a deflected beam element.
2
The Science of Making Torque from Wind (TORQUE 2018) IOP Conf. Series: Journal of Physics: Conf. Series 1037 (2018) 1234567890 ‘’“” 052033
IOP Publishing doi:10.1088/1742-6596/1037/5/052033
If the mass and inertia of the rigid body is set to zero, the analytical model is simplified and applicable to determine the dynamic behaviour of the blades. Calculations can be performed for upright, hanging and horizontal positions Although in [5,6,7] similar problems are discussed, the derivation of the differential equation of the given problem in combination with the solution procedure described in the following could not be found. Assuming small deflections and slim structures an Euler-Bernoulli beam (length , constant cross section area A , moment of inertia I , mass per length , Young’s modulus E ) rigidly clamped at x 0 with a top body (mass mK , inertia J yy ) at x is used (Figure 1a). Notating the partial derivatives of transversal deflection w(x, t ) with respect to the longitudinal coordinate x by w j , j I , II ,..., the dynamic equilibrium condition of a deflected small beam element according to Figure 1b reads
EI w IV (x , t )
N (x, t ) I w (x , t ) N (x , t )w II (x , t ) w(x , t ) 0 . x
(1)
Inserting the axial force due to gravity N (x, t ) g( x ) mK g according to the free-body diagram of Figure 2a into (1) yields EI w IV (x, t ) g w I (x, t ) g( x )w II (x, t ) mK g w II (x, t ) w(x, t ) 0 ,
(2)
Separating in (2) the variables x and t according to Bernoulli [8]
w(x, t ) W (x )q(t ) ,
(3)
leads to the ordinary fourth-order differential equation
RW [ (x )] EI W IV (x ) gW I (x ) g( x )W II (x ) mK gW II (x )
2
W (x ) 0
(4)
with the residual R . The constant parameter indicates the angular frequency, whereby this notation was chosen in order not to be mixed up with the lateral deflection w . The geometric boundary conditions at x 0 require
W (0) 0, W I (0) 0,
(5)
and the dynamic boundary conditions at x
R1[W ( )] EI W II ( ) J yy
2
according to Figure 2b are
W I ( ) 0,
R2[W ( )] EI W III ( ) mK gW I ( ) mK
2
(6)
W ( ) 0,
with the residuals R1 and R2 . mK g mKw( ,t )
mK g N ( ,t )
g( x )
Q( ,t )
N (x,t ) y
a)
x
y
z
Jyy ( ,t ) S
Q( ,t ) M ( ,t )
M ( ,t )
x z
b)
Figure 2. a) Free body diagram for the beam normal force. b) Free body diagram of the rigid body.
3
The Science of Making Torque from Wind (TORQUE 2018) IOP Conf. Series: Journal of Physics: Conf. Series 1037 (2018) 1234567890 ‘’“” 052033
IOP Publishing doi:10.1088/1742-6596/1037/5/052033
As (4) does not have a closed form solution, an approximate solution W (x ) is determined that fulfills the geometric boundary conditions (5) and makes the weighted sum of the residuals R , R1 , R2 vanish. This leads to the weak formulation
[ (x )] RW
(x )dx R1[W ( )]
1
R2[W ( )]
2
0,
(7)
0
with the weighting function (x ) and weighting factors 1 and 2 . In (7) the approximation W (x ) must be at least three times differentiable with respect to x . Applying partial integration twice on the first summand in (4) and defining the weighting factors 1 I ( ) and 2 ( ) brings the weak formulation (7) into the form
EI W II
II
g( x )W I
I
mK gW I
I
2
0
J yy
2
WI( )
I
( ) mK
W dx 2
(8)
W ( ) ( ) 0.
According to the Galerkin approach [8], the function W (x ) is defined as a linear combination of shape functions k (x ), k 1, , n with linear factors ak according to
W (x )
n
ak
k 1
k (x )
or W (x ) 1(x )...
a1 n (x ) (x ) a , a
(9)
n
whereby the shape functions k (x ) summarized in the row vector (x ) are simultaneously used as weighting functions. Here Bernstein polynomials are applied. Inserting (9) into (8) yields a homogeneous system of n linear equations for the n coefficients a ,
EI
0
dx g ( x ) 0
dx mK g 0
dx
2
0
dx
(10) J yy 2 ( ) ( ) mK 2 ( ) ( ) a 0. Nontrivial solutions for a are obtained if the coefficient determinant is zero, corresponding to the characteristic equation for calculation of the angular frequencies k , j 1, , n . For each k the corresponding coefficients a (k ) obtained from (10) are used to calculate the k th eigenmode W (k )(x ) by means of (9). The buckling problem is included in (10) for the angular frequency 0 . The coefficient determinant of (10) then yields the critical top body mass mK for given geometric and material properties of the tower. The corresponding buckling mode W (0)(x ) is then calculated in the same manner as the dynamic eigenmodes. Several calculations in Matlab with different tower and top body parameters showed that for the desired low natural frequencies a slim tower beam and high ratios between top body mass and tower mass are necessary that are considerably higher than those of a real wind turbine. In particular, mass ratios between 3 and 5 were considered for the test rig, while the reference wind turbine has a mass ratio between 0.5 and 0.6. Considering the tower that was later used for the test rig, Figure 3 and Table 1 exemplarily show the effect of tower body mass and inertia on the natural frequencies. Starting the upright cantilever beam without top mass (column 1 in Table 1), a point mass reduces the natural frequencies of all modes (column 2). Adding significant rotational inertia reduces the frequencies of the higher modes (column 3), while the fundamental frequency is not much influenced.
4
The Science of Making Torque from Wind (TORQUE 2018) IOP Conf. Series: Journal of Physics: Conf. Series 1037 (2018) 1234567890 ‘’“” 052033
IOP Publishing doi:10.1088/1742-6596/1037/5/052033
The tower top mass has approximately the same effect as an artificial rotational joint, while the additional high rotational inertia acts as an artificial clamping.
mK 0 kg, Jyy 0 kgm2
mK 17.4 kg, Jyy 0 kgm2
mK 17.4 kg, J yy 2.0 kgm2
Figure 3. Eigenmodes of a vertical cantilever beam with different top body parameters calculated with the model from Figure 1. Table 1. Natural frequencies of the first four modes of the upright cantilever beam with varied parameters of the top body (tubular steel beam, length 3.68 m , outer diameter 26.9 mm , wall thickness 2.6 mm , beam mass mT 5.1kg ) calculated with the model from Figure 1. Mode
mK = 0.0 kg J yy = 0.0 kgm²
1 2 3 4
1.84 Hz 11.71 Hz 32.84 Hz 64.48 Hz
mK = 17.4kg J yy = 0.0 kgm²
mK = 17.4kg J yy = 2.0 kgm²
0.39 Hz 8.07 Hz 25.67 Hz 50.96 Hz
0.39 Hz 5.16 Hz 13.76 Hz 33.58 Hz
4. Construction of the test rig The test rig was designed according to the requirements described in section 2. The main components of the test rig are base plate, tower, nacelle and rotor according to Figure 4a. Tower height is 3.68 m , and the blade lengths are 1.86 m . The dimensions of the cross sections of the tower and the blades were determined in such a way that the requirements regarding the frequencies are fulfilled. Parameter analyses of different tower and blade designs were conducted.
MainData-AcquisitionBearing System Main-Shaft Hub Clutch
Planetary Gear
Stepper Motor
Adapter Plate
Main-Frame a)
b)
Blade
Tower
Counter Weight
Figure 4. a) Overall topology of the test rig with acceleration sensors attached to the tower and blade structures. b) Design details of nacelle and rotor.
5
The Science of Making Torque from Wind (TORQUE 2018) IOP Conf. Series: Journal of Physics: Conf. Series 1037 (2018) 1234567890 ‘’“” 052033
IOP Publishing doi:10.1088/1742-6596/1037/5/052033
An equilateral triangular base plate made of steel is provided to achieve the same stiffness in all directions (Figure 5). It is supported by three bolts that are fixed on the concrete floor and adjustable for precise levelling. The tower consists of a steel tube with constant circular cross section of 26.9 mm x 2.6 mm . The main frame of the nacelle supports the drive train and the rotor bearing. Long holes in the main frame enable horizontal adjustments of the nacelle relative to the top of the tower. Inertia and center of gravity of the nacelle can be adjusted by additional masses bolted on the main frame. The drive train consists of hub, main shaft, clutch, planetary gear and stepper motor as seen in Figure 4b. Under consideration of the rotor inertia the drive train is designed to accelerate the rotor from standstill to 25 rev /min in 20 s . It includes a hybrid stepper motor ST6018L3008B (max rotational speed 2500 rev /min ; rotor inertia 8.4 105 kgm2 ) and a planetary gear GPLE40-3S-100F56 (gear reduction i 100 ) both from Nanotec Electronic GmbH & Co. KG, Germany. The motor controller is mounted on the main frame with power cable laid through the tower. The rotor hub made of aluminum bears the blade mountings as well as the electrical adapters and wireless transmission components of the data acquisition system shown in Figures 4b and 5. The blades are of aluminum, too. They have a constant rectangular cross section of 40 x 3 mm .
Figure 5. Construction details of base plate, tower and data acquisition system. For the purpose of OMA measurements on all structural parts the data acquisition system Meda RedSens (Wölfel Group, Germany) is mounted. It enables wireless transmission between the rotating and non rotating structural components. Data recording occurs simultaneously with negligible time delay. The Meda RedSens system consists of 8 nodes and can be extended up to 10. As each node accommodates 3 BNC adapters, altogether 24 sensor signals can be recorded at the same time. The sensor configuration of acceleration sensors according to Figure 6 includes 8 sensor positions on the tower, 4 on the main frame of the nacelle and 12 on the rotor. This configuration was chosen with the objective to be able to distinguish symmetric and antisymmetric rotor modes and closely spaced modes. Additional sensor positions can be evaluated by reconfiguration of sensor positions while the positions of reference sensors are maintained. First measurements have shown that it is appropriate to utilize sensors of the same physical principle in order to avoid errors in amplitude and phase. Capacitive acceleration sensors designed as Micro Electro-Mechanical Systems (MEMS) proved to be appropriate since they are able to measure in the desired low frequency range. The test rig is currently being equipped with BST 54K1 uniaxial acceleration sensors from Bay SensorTec GmbH, Germany. These sensors are specified by a sensitivity of 2000 mV/g and a frequency range from 0-90 Hz. The sensors have a measurement range between 0 and 20 m s2 and a mass of approximately 10 g. Their low mass is advantageous as the
6
The Science of Making Torque from Wind (TORQUE 2018) IOP Conf. Series: Journal of Physics: Conf. Series 1037 (2018) 1234567890 ‘’“” 052033
IOP Publishing doi:10.1088/1742-6596/1037/5/052033
influence on the dynamics of the structure is minimized. The data acquisition system is operated in the DC mode to avoid disturbances in the low frequency range due to high-pass filtering.
Figure 6. Mounting positions and measurement directions of acceleration sensors on the test rig (8 sensor positions on the tower, 4 on the main frame of the nacelle and 12 on the rotor.) 5. Experiments and numerical simulations During design and construction of the test rig a first experimental validation of the calculations from section 3 was conducted using a preliminary test setup where a concentrated test body is applied on the top of the tower with mass mK 17.4 kg and an estimated rotational inertia of about J yy 0.3 kgm2 as shown in Figure 7. The tower mass is mT 5.1kg . The lower natural frequencies were determined by means of OMA. Different methods of Frequency Domain Decomposition (FDD) and Stochastic Subspace Identification (SSI) were used for data evaluation [1]. Airflow in the laboratory room with the windows open before and during the measurement proved to generate sufficient ambient excitation for OMA.
Figure 7. Test body mounted on the top of the tower. Measurements of the lower natural frequencies are compared with calculations in Matlab according to section 3. The results are shown in Table 2. The measured fundamental frequency 0.34 Hz is lower than the calculated value 0.38 Hz, while the frequencies of modes two and three are very similar. The difference in the fundamental frequency is explained by the compliance of the clamping between base plate and tower seen in Figure 5. This is not included in the calculation model. The higher frequencies
7
The Science of Making Torque from Wind (TORQUE 2018) IOP Conf. Series: Journal of Physics: Conf. Series 1037 (2018) 1234567890 ‘’“” 052033
IOP Publishing doi:10.1088/1742-6596/1037/5/052033
are less affected by this effect. Altogether the fundamental frequencies of the tower correspond to the design requirements of section 1. Table 2. Natural frequencies of the first tower bending modes of the test setup shown in Figure 7 ( mT 5.1kg , mK 17.4 kg , Jyy 0.3 kgm2 ) from experiment (OMA) and calculated with the model from Figure 1. Mode 1 2 3 4
Experiment (OMA) [Hz] 0.34 7.3/7.5 20.4/22.7 -
Numerical calculations [Hz] 0.38 7.52 20.37 37.55
To verify that the fundamental frequencies of the overall test rig also meet the design requirements a multibody simulation model was built up using the multibody simulation software Simpack v9.4, and an experimental study using OMA techniques was performed at the test rig. The simulation model and its topology are shown in Figure 8. Tower and blades are defined as modally reduced elastic bodies. Ten mode shapes are considered for the tower and six mode shapes for each blade. Further components are nacelle and rotor hub with the driveline comprising clutch, gearbox and motor.
Figure 8. Multibody simulation model of the wind turbine test rig. The experiments were conducted while the rotor was locked in Y-position with pitch angles 0 deg and one blade pointing downward. Measurement, duration for OMA was 60 min, the acceleration signals were recorded with a resolution of 250 Hz. As the MEMS sensors described in section 4 were not yet available during these tests, acceleration sensors PCB 393B05 and PCB 333B40 from PCB Piezotronics, USA, were used instead. Altogether 30 measurement channels were recorded at the tower, nacelle and blade structures. However this preliminary measurement setup is not optimal as the relatively large mass of the PCB 393B05 sensors (100 g including the magnetic adapter) distorts the dynamics of the test rig. Further, the combination of two sensor types might cause problems due to their different transfer behaviour in the interesting frequency range. The MEMS sensors used in the next measurement campaigns reduce the error of additional masses and avoids the problems from different sensor types.
8
The Science of Making Torque from Wind (TORQUE 2018) IOP Conf. Series: Journal of Physics: Conf. Series 1037 (2018) 1234567890 ‘’“” 052033
IOP Publishing doi:10.1088/1742-6596/1037/5/052033
The results of fundamental frequencies received from numerical simulation and experiment are represented in Table 3. Table 3. Fundamental frequencies of tower and blade modes, numerically calculated in SIMPACK v9.4 and experimentally determined (OMA). Mode Tower Mode fore-aft Tower Mode side-side Blade Mode 1.1 Blade Mode 1.2 Blade Mode 1.3
SIMPACK [Hz] 0.42 0.44 0.64 0.69 0.85
Artemis (OMA) [Hz] 0.34 0.35 0.60 0.66 0.83
There are two independent tower bending modes closely spaced in the vicinity of the desired frequency 0.3 Hz and three blade modes near the desired frequency 0.7 Hz. The eigenfrequencies from multibody simulation are higher than the experimental results. This is mainly caused by the elasticity of the tower clamping that is inot included in the model. This influence is less for the blade modes due to the small amplitudes of the tower. Exemplarily blade mode 1.2 is represented in Figure 9.
a)
b)
Figure 9. Comparison of Blade Mode 1.2 a) from multibody simulation, b) from OMA (Artemis)
6. Conclusion and Outlook A dynamically scaled laboratory test rig of a wind turbine structure has been designed and built up in such a manner that it exhibits the low fundamental frequencies being typical for wind turbines. It is intended to be used as a test bed for vibration measurements with exactly the same acceleration sensor configurations and data processing systems that are applied for measurements on real wind turbines. In order to not distort the dynamics of the test rig, the mass of the sensors and the data acquisition system components had to be minimized. Accordingly MEMS acceleration sensors and a data acquisition system were chosen in order to measure frequencies down to 0.3 Hz. Hereby it is beneficial to measure in DC mode and to use sensors of the same type in order to avoid measurement errors due to filtering problems and different transfer behaviors. To find feasible physical parameters for the test rig, principal investigations with an analytical model of a vertical cantilever beam with a top body were combined with experiments based on Operational Modal Analysis (OMA) and multibody simulation.
9
The Science of Making Torque from Wind (TORQUE 2018) IOP Conf. Series: Journal of Physics: Conf. Series 1037 (2018) 1234567890 ‘’“” 052033
IOP Publishing doi:10.1088/1742-6596/1037/5/052033
The first measurement campaigns on the overall test rig showed good results in comparison to multibody simulations. Tower modes and blade modes could be estimated accurately. Deviations between experiment and simulation are caused by modeling uncertainties like the stiffness of the tower clamping, by the additional masses of the relatively heavy sensors that were preliminarily available for the experiments and by the combination of two sensor types. The MEMS sensors used in the next measurement campaigns reduce the error of additional masses and avoids the problems from different sensor types. The test rig will be used to investigate and further develop measurement and signal processing procedures based on OMA to analyze and monitor the dynamics of operating wind turbines. This will be the foundation for an accurate time and cost efficient measurements on wind turbines. Acknowledgement This research is part of the DYNAWIND project funded by the German Federal Ministry for Economic Affairs and Energy under grant number FKZ 0325228C/D. References [1] Rainieri C, Fabroccino G 2014 Operational modal analysis of civil engineering structures (New York, Springer) [2] Rachholz R, Zierath J, Rosenow SE, Bockhahn R, Schulze A, Woernle C 2017 Application of Operational Modal Analysis Techniques to Wind Turbines (Proceedings of the International Modal Analysis Conference IOMAC) (Ingolstadt, Germany) [3] Zierath J, Rachholz R, Woernle C, 2016 Field Test Validation of Flex5, MSC.Adams, Alaska/Wind and Simpack for load calculations on wind turbines. (Wind Energy 19) pp 1201-1222 [4] Zierath J, Rachholz R, Rosenow SE, Bockhahn R, Schulze A, Woernle C Experimental identification of modal parameters of an industrial 2-MW wind turbine (Wind Energy) [5] Lajimi S, and Glenn R, Heppler 2012 Eigenvalues of an axially loaded cantilever beam with an eccentric end rigid body (Proceeding of the International Conference on Mechanical Engineering and Mechatronics) (Ottawa, Ontario, Canada) [6] Huang T, Dareing D.W. 1968 Buckling and lateral vibration of drill pipe (Journal of Engineering for Industry 90) pp 613-619. [7] Virgin L. N. 2007 Vibration of axially-loaded structures (Cambridge University Press) [8] Gross D, Hauger W, Schnell W, Wriggers P 2002 Technische Mechanik, vol4 (Berlin, Springer)
10