Development of a Hybrid Cost Estimation Model in an Iterative Manner Adam Trendowicz A, Jens Heidrich A, Jürgen Münch A, Yasushi Ishigai B, B B, C Kenji Yokoyama , Nahomi Kikuchi A
Fraunhofer Institute for Experimental Software Engineering Fraunhofer-Platz 1 67663 Kaiserslautern, Germany +49-631-6800-0
B
Information-technology Promotion Agency Software Engineering Center 2-28-8 Honkomagome, Bunkyo-Ku, Tokyo, 113-6591, Japan +81-3-5978-7543
C
Oki Electric Industry Co., Ltd. 1-16-8 Chuou, Warabi-shi, Saitama 335-8510, Japan +81-48-431-7211
[email protected],
[email protected],
[email protected], B C
[email protected],
[email protected],
[email protected] ,
[email protected]
ABSTRACT
1. INTRODUCTION
Cost estimation is a very crucial field for software developing companies. The acceptance of an estimation technique is highly dependent on estimation accuracy. Often, this accuracy is only determined after an initial application. Possible further steps for improving the underlying estimation model typically do not influence the decision on whether to discard the technique or deploy it. In addition, most estimation techniques do not explicitly support the evolution of the underlying estimation model in an iterative manner. This increases the risk of overlooking some important cost drivers or data inconsistencies. This paper presents an enhanced process for developing a CoBRA® cost estimation model by systematically including iterative analysis and feedback cycles, and its evaluation in a software development unit of Oki Electric Industry Co., Ltd., Japan. During the model improvement cycles, estimation accuracy was improved from an initial 120% down to 14%. In addition, lessons learned with the iterative development approach are described.
Rapid growth in the demand for high quality software and the increased investment in software projects show that software development is one of the key markets worldwide [11], [12]. Together with the increased distribution of software, its variety and complexity are growing constantly. A fast changing market demands software products with even more functionality, higher reliability, and higher performance. Software project teams must strive to achieve these objectives by exploiting the impressive advances in processes, development methods, and tools. Moreover, in order to stay competitive, software providers must ensure that software products are delivered on time, within budget, and to an agreed level of quality, or even with reduced development costs and time. Moreover, software companies need a reliable basis for making make-or-buy decisions or for verifying development costs offered by contractors if they decide to buy parts of a software product.
Categories and Subject Descriptors
This illustrates the necessity for reliable software cost estimation, since many software organizations are proposing unrealistic software costs, work within tight schedules, and finish their projects behind schedule and budget, or do not complete them at all [24].
D.2.9 [Software Engineering]: Management – cost estimation
At the same time, software cost estimation is considered to be more difficult than cost estimation in other industries. This is mainly because software organizations typically develop new products as opposed to fabricating the same product over and over again. Moreover, software development is a human-based activity with extreme uncertainties from the outset. This leads to many difficulties in cost estimation, especially in early project phases. These difficulties are related to a variety of practical issues. Examples include difficulties with project sizing, a large number of associated and unknown cost factors, applicability of cost models across different organization contexts, or, finally, insufficient data to build a reliable estimation model on. To address these and many other issues, considerable research has been directed at gaining a better understanding of the software development processes, and at building and evaluating software cost estimation techniques, methods, and tools [4].
General Terms Management, Measurement, Economics, Experimentation.
Keywords Cost Estimation, Iterative Model Improvement, CoBRA®, Industrial Case Study.
Permission to make digital or hard copies of all or part of this work for personal or classroom use is granted without fee provided that copies are not made or distributed for profit or commercial advantage and that copies bear this notice and the full citation on the first page. To copy otherwise, or republish, to post on servers or to redistribute to lists, requires prior specific permission and/or a fee. ICSE’06, May 20-28, 2006, Shanghai, China. Copyright 2006 ACM 1-59593-085-X/06/0005…$5.00.
One prerequisite before selecting a certain estimation method is to evaluate the applicability of the method for the application con-
331
project took place in the context of a cooperation project between the Software Engineering Center (SEC) of the Japanese Information-technology Promotion Agency (IPA) and the Fraunhofer Institute for Experimental Software Engineering (Fh IESE).
text, which consists of considering several context characteristics such as availability of required data or effort required to apply the method. Usually, the latter two issues are contradictory: the less effort a method requires to build the estimation model, the more measurement data from previous projects is needed1. Data-based methods focus on the latter exclusively. Contrariwise, expertbased methods require almost no measurement data, but obtaining estimates costs a lot of effort. Software organizations move between those two extremes, tempted either by low application costs or low data requirements. In fact, a great majority of organizations that actually use data-based methods do not have a sufficient amount of appropriate (valid, homogeneous, etc.) data as required by such methods. Hybrid methods offer a reasonable bias between data and effort requirements, providing at the same time reliable estimates and justifiable effort to apply the method [5], [22], [6]. Depending on the context, a careful evaluation of the method to be applied should be performed.
The major goal of the project was to show that iterative model development is able to improve estimation accuracy (measured as the Mean Magnitude of Relative Error) continuously. The paper starts with an explanation of the principles of the CoBRA® method. In Section 2, we introduce the iterative development process of the estimation model in the context of the industrial case study conducted and illustrate the benefits of this approach in Section 3. After that, we present lessons learned in Section 4 and discuss related work in Section 5. Section 6 finishes the paper with a brief summary of the described results and future research directions.
2. COBRA® PRINCIPLES
As part of organization-wide improvement efforts, the technical and organizational processes should be constantly monitored in order to detect weaknesses and react appropriately [1]. Cost estimation, as one organizational process, should also be the subject of continuous improvement. Especially when introducing new estimation methods, several iterations are required to integrate the method into existing processes and calibrate it to the specific application context (as is the case with every other new technology). In practice, software organizations often overlook this fact and accept or decline the method dependent on the results of its first (pilot) application. In consequence, promising estimation methods are dropped in favor of “rule-of-thumb” and black-box approaches because they did not provide satisfactory results (usually cost/benefit ratio) when applied for the first time.
CoBRA® [5] is a hybrid method combining data- and expertbased cost estimation approaches. The CoBRA® method is based on the idea that project costs consist of two basic components: nominal project costs and a cost overhead portion as presented below. Cost = Nominal Productivity ⋅ Size + Cost Overhead 14444 4244444 3 Nominal Cost
where Cost Overhead = ∑ Multiplieri ( Cost Factori ) i
i
2
CoBRA® is a registered trademark of the Fraunhofer Institute for Experimental Software Engineering.
j
Nominal cost is the cost spent only on developing a software product of a certain size in the context of a nominal project. A nominal project is a hypothetical “ideal” project in a certain environment of an organization (or business unit). It is a project that runs under optimal conditions; i.e., all project characteristics are the best possible ones (“perfect”) at the start of the project. For instance, the project objectives are well defined and understood by all staff members and the customer and all key people in the project have appropriate skills to successfully conduct the project. Cost overhead is the additional cost spent on overcoming imperfections of a real project environment such as insufficient skills of the project team. In this case, a certain effort is required to compensate for such a situation, e.g., team training has to be conducted.
We enhanced the development process of a CoBRA® model by several analysis and feedback cycles discussing data and expertbased improvement potentials. Based on these feedback cycles, data inconsistencies can be discovered, missing or misleading cost drivers can be identified, and the estimation model can be adapted accordingly. This enhanced CoBRA® process was applied in an industrial study conducted in the context of a software development unit of Oki Electric Industry Co., Ltd., Japan. The overall
The more data is available, the less expert involvement is required and the company’s effort is reduced. This does not include the effort spent on collecting the data. Above a certain maturity level, companies have to collect the data needed anyway.
(2)
+ ∑∑ Multiplierij ( Cost Factori , Indirect Cost Factor j )
This paper presents the iterative development of a hybrid cost estimation model based on the CoBRA®, 2 method in the context of Oki Electric Industry Co., Ltd.. CoBRA® was selected as cost estimation method because of the characteristics of the companyspecific context. CoBRA® (Cost Estimation, Benchmarking and Risk Analysis) provides a means for developing transparent models based on company-specific data as well as expert knowledge. It is therefore a hybrid method (leading to an estimation model based on data and expert knowledge). The method also supports goal-oriented measurement programs in order to assess the quantitative risks of a software project.
1
(1)
In CoBRA®, cost overhead is modeled by a so-called causal model. The causal model consists of factors affecting the costs of projects within a certain context. The causal model is obtained through expert knowledge acquisition (e.g., involving experienced project managers). An example is presented in Figure 1. The arrows indicate direct and indirect relationships. A sign (´+´ or ´-´) indicates the way a cost factor contributes to the overall project costs. The ´+´ and ´–´ represent a positive and negative relationship, respectively; that is, if the factor increases, the project costs will also increase (´+´) or decrease (´–´). For instance, if the Requirements volatility increases, costs will also increase. One arrow pointing to another one indicates an interaction effect. For example, an interaction exists between Disciplined requirement man-
332
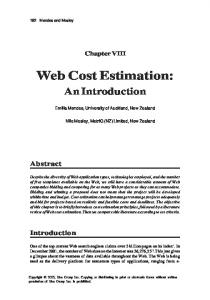
Let us assume (scenario A) that the available budget for a project is 900 Units and that this project's costs are characterized by the distribution in Figure 2. There is roughly a 90% probability that the project will overrun this budget. If this probability represents an acceptable risk in a particular context, the project budget may not be approved. On the other hand, let us consider (scenario B) that a project manager wants to minimize the risks of overrunning the budget. In other words, the cost of a software project should be planned so that there is minimal risk of exceeding it. If a project manager sets the maximal tolerable risk of exceeding the budget to 30%, then the planned budget for the project should not be lower than 1170 Units.
agement and Requirement volatility. In this case, increased disciplined requirement management compensates for the negative influence of volatile requirements on software costs.
The cost overhead portion resulting from indirect influences is represented by the second component of the sum shown in (2). In general, CoBRA® allows for expressing indirect influences on multiple levels (e.g., influences on Disciplined requirement management and influences on influences thereon). However, in practice, it is not recommended for experts to rate all factors due to the increased complexity of the model and the resulting difficulties and efforts. Further details on computing the cost overhead can be found in [5].
1.0
Disciplined requirements management
Cost
0.8
Probability
Requirements volatility
Application Platform domain capabilities capabilities
0.6
0.4
B 0.2
A
Customer participation
0.0
Development team capabilities
800
1000
1200
1400
Cost
Figure 2: Example Cumulative Cost Distribution
Figure 1: Causal Model Example
The advantage of CoBRA® over many other cost estimation methods is its low requirements with respect to measurement data. Moreover, it is not restricted to certain size and cost measures. The method provides the means to develop an estimation model that is tailored to a certain organization’s context, thus increasing model applicability and performance (estimation accuracy, consistency, etc.) A more detailed description of the CoBRA® method can be found in [5].
The influence on costs and between different factors is quantified for each factor using experts’ evaluation. The influence is measured as a relative percentage increase of the costs above the nominal project. For each factor, experts are asked to give the increase of costs when the considered factor has the worst possible value (extreme case) and all other factors have their nominal values. In order to capture the uncertainty of evaluations, experts are asked to give three values: the maximal, minimal, and most likely cost overhead for each factor (triangular distribution).
3. INDUSTRIAL CASE STUDY
The second component of CoBRA®, the nominal project costs, is based on data from past projects that are similar with respect to certain characteristics (e.g., development type, life cycle type) that are not part of the causal model. These characteristics define the context of the project. Past project data is used to determine the relationship between cost overhead and costs (see equation #1). Since it is a simple bivariate dependency, it does not require much measurement data. In principle, merely project size and effort are required. The size measure should reflect the overall project volume including all produced artifacts. Common examples include lines of code or Function Points [18]. Past project information on identified cost factors is usually elicited from experts.
One objective of the study was to introduce a structured cost estimation method capable of identifying the major cost drivers in a Japanese software company. For this purpose, the CoBRA® method was selected, which is capable of combining expert judgment and available project data. Based on the achieved results of the study, related organizational processes (such as measurement and data collection processes) have been improved adequately. First, we will describe the basic approach taken to establish the CoBRA® feedback cycle during model development. After that, we will describe how the initial estimation model was developed and which steps were taken to improve estimation accuracy (by improving data consistency and identifying cost drivers through experts). Then, we will summarize all improvement steps and compare our results to a standard cost estimation approach.
Based on the quantified causal model, past project data, and current project characteristics, a cost overhead model is generated using a simulation algorithm (e.g., Monte Carlo or Latin Hypercube). The probability distribution obtained could be used further to support various project management activities, such as cost estimation, evaluation of cost-related project risks, or benchmarking [5]. Figure 2 illustrates two usage scenarios using the cumulative cost distribution: calculating the project costs for a given probability level and computing the probability for exceeding given project costs.
3.1 Iterative Model Development The cost estimation model was developed according to the framework presented in Figure 3. First, input data was validated as part of a so-called pre-estimation analysis, with respect to its completeness, consistency, and correctness. Next, the estimation model was built and post-estimation analysis was performed in order to evaluate the quality of the model. We validated the obtained model in a cross-validation (leave-one-out) approach on
333
past project data. Estimation accuracy and stability were evaluated with respect to common measures [8] such as Mean and Median Magnitude of Relative Error (MMRE and MdMRE, respectively), prediction at level 0.25 3 (Pred(.25)), and standard deviation on the relative error (Std.Dev.). In addition, the relationships between the model output (residuals) and input data were analyzed.
fined into sub-factors (e.g., Level of experience and knowledge in Figure 5 was split into Platform experience and Application domain experience). After that, the kind of influence on effort overhead was discussed in more detail. First of all, we discussed the direct relationships between each factor and the resulting effort increase or decrease. Second, we discussed the indirect relationships of the factors among each other (e.g., Disciplined requirements management has a strong influence on Requirements definition and stability). The final result of the second meeting was the causal model presented in Figure 5, which was approved by all experts.
1st Improvement Iteration ... nth Improvement Iteration
Pre-Estimation Analysis
Building Estimation Model
#16
#16
INPUT
Data Collection & Preparation
Development Effort [ph]
Feedback
Post-Estimation Analysis
OUTPUT
Figure 3: Iterative Development of the Estimation Model
Initial data
Based on the results of the pre- and post-estimation analysis, improvement suggestions were defined with respect to the estimation method as well as to related organizational processes (e.g., the data collection process).
th
After 4 iteration
Software Size [KLOC]
We will illustrate each step in more detail when discussing the improvement iterations in the context of the case study we performed.
Figure 4: Scatter Plot – Size versus Effort After that, we defined the scales for each identified factor, which represent corresponding project situations on a 4-grade Lickert scale [23] and range from the worst imaginable case for a certain factor (which results in the greatest effort overhead increase) to the most optimal case (which results in no effort overhead at all). Then individual interview sessions with each expert were conducted based on the scale definitions. During these individual interviews, we basically collected two types of data: multiplier values for each cost factor from every expert and past project data from selected experts.
3.2 Initial Model Development CoBRA® was applied in the context of an Oki unit dealing with financial applications. Initially, measurement data from 16 past projects was provided and 12 experts (project and quality managers of the company) participated in the study; this means that they assessed past project data and discussed the main cost drivers. All projects were enhancement projects for HP-UX and Windows platforms, and were developed according to a simple waterfall life cycle model. Size was measured as uncommented LOC (for Java and C) and effort as number of person hours (Figure 4)4.
During individual interviews, every expert had to give the most likely effort as well as the minimum and maximum effort increase a certain cost factor may cause. Then, the values given by one expert were compared with values given by other experts. This was the input for a Monte-Carlo simulation used by CoBRA® in order to compute the probability distribution (see Figure 2 of Section 2), which is used to compute estimates.
In the first step, we performed a pilot study in which we built the initial CoBRA® model. The major objective of the pilot was to transfer knowledge regarding CoBRA® into the organization (learning by doing). Three different meetings with company experts were organized. In the first meeting, we presented the basics of the CoBRA® approach and illustrated the function and usage of causal models. In the second meeting, we discussed the basic cost factors of the company and constructed the causal model. In order to do this effectively, we sent a questionnaire a few weeks before our visit to selected company experts and asked for cost factors in order to get a starting point for the group discussion. We came up with an initial list of cost factors. Some of them were further re3
This defines the ratio of MMRE values less than or equal to 25%.
4
Scales not included due to confidentiality of project data.
The second input requested from experts addressed past project data. Experts with knowledge about one of the 16 past projects were asked to rate the projects with respect to the identified cost factors. In order to reduce the effort for the experts, we did not ask more than one expert about a certain project, which turned out to be a mistake, as we saw afterwards, and had to be addressed in a later iteration. The pre-estimation analysis of the input data revealed several issues that might influence the performance of the produced estimation model. The so-called software production line (size vs. actual effort) based on past project data showed that the project data contained some outliers: project #16 and a group of four
334
Table 1: Performance of the CoBRA® Model
projects, #11 to #14, differed from the main body of data. An analysis of the actual productivity did not reveal any significant effects related to the diseconomy of scale.
Iteration Initial
PROD.2.2 Requirements stability
PROD.2.1 Difficulty of requirements definition
PROD.2 Requirements definition and stability PROC.1 Disciplined requirements management
PROC.2 Customer Participation
1.07
0.79
6.25%
0.70
1
0.32
0.28
46.7%
0.23
2
nd
0.23
0.19
66.7%
0.20
3
rd
0.23
0.15
73.3%
0.22
4
th
0.14
0.12
93.3%
0.07
th
0.12
0.10
100.0%
0.07
As seen during the initial model creation, we had some problems with data consistency. Therefore, we planned two additional model iterations focusing solely upon data-based model improvement, without expert involvement.
PERS.5 Project manager’s experience and skills
1st Iteration: In the first iteration, we decided to exclude the outlier project #16 from the input data. Apart from being a very large project (outlier with respect to size), it was also a re-development project. All remaining projects were developments from scratch or enhancement projects. Since our causal model did not explicitly include this factor and development type was supposed to be equal for all projects, we decided to rebuild the estimation model based on the remaining fifteen projects.
PERS.2 Level of experience and knowledge
PERS.2.2 Platform experience
Std.Dev.
3.3 Data-based Model Improvement
PROJ.2 Development schedule constraints
PROD.4 Software performance constraints
Pred(.25)
The post-estimation analysis revealed several model weaknesses. The cross-validation of the model provided estimates of very low accuracy and low consistency (see initial iteration in Table 1). The distribution of the relative error revealed the same outliers as the pre-estimation analysis did and was therefore the entry point to improve the model in the next iteration of the CoBRA® method.
EFFORT
PROD.3 Software product complexity
MdMRE
st
4 and #16
PROJ.1 Clarity of project team roles and responsibilities
PROD.1 Importance of software reliability
MMRE
PERS.2.1 Application domain experience
Figure 5: Initial CoBRA® Causal Model
The pre-estimation analysis of the remaining project data revealed much more significant relationships between size and effort. However, the outlier group of projects #11 to #14 remained. The post-estimation analysis showed significant improvements of model performance with respect to estimation accuracy and standard deviation (see 1st iteration in Table 1). Nominal productivity was also less dependent on project size. This indicates that the new model better explained variations of productivity across the projects considered. However, projects #11 to #14 still remained outliers.
Additional doubts appeared when eliciting data from experts. Already during the individual interviews, some experts suggested that the factor Importance of software reliability might not be relevant and thus could possibly be excluded from the causal model, which was not done because of the majority of the experts. Furthermore, the experts said that it was very difficult to imagine the effects each factor may cause in isolation from all others when collecting multiplier data, which is absolutely necessary for getting the cost overhead values for each factor. However, to some extent, inconsistencies of those multiplier data are normal because they reflect individual experiences of experts, gained in numerous projects.
As we looked closer into the measurement scope, we recognized that the reported effort data had not covered the same project scope for all projects. According to Oki's data collection process, effort data was collected correctly for each development phase, but for some projects, the effort spent on requirements specification and/or system testing was not available, and therefore not included in the total effort data.
Furthermore, doubts regarding the validity of expert-elicited project data occurred because data on each project was provided by only one expert. The defined scales for each factor are supposed to support the consistent understanding of a certain project situation and ensure their consistent evaluation by various experts. However, our doubts on the validity of expert evaluation were additionally supported by a kind of paradox that resulted from comparing size measurement to expert evaluations regarding the cost factor Software complexity. Several projects having a significantly smaller size than project #16 were evaluated as having equal or even higher complexity. In principle, this can, of course, be the case, but it is very unlikely for the projects considered because the difference in size was too significant according to Oki experts.
2nd Iteration: In this iteration, the total effort data was adapted and the appropriate definition of our measurement data collection process was improved accordingly (to consistently cover the same project scope for all projects). In principle, there were two possibilities of addressing this issue: (1) include effort data of only those phases of the development life cycle that were consistently measured or (2) recalculate the total normalized effort for the whole life cycle, including the effort for missing phases calculated on the basis of effort distribution across past projects. The latter
335
In order to prevent inconsistencies in the expert evaluation, we decided to collect past project data from multiple experts this time. In order to ensure the same understanding of the subjective scales defined to quantify each factor, we invested extra effort into giving a detailed definition of the project situation related to a specific factor value, and also discussed the scales in a group meeting involving all experts.
option of normalizing effort data is, for instance, also applied in the ISBSG database [14]. Normalization, however, would require significant knowledge of historical data with respect to effort distribution across different development phases. Since we did not have sufficient data, we took the first approach. You can find a scatter plot for updated effort values in Figure 4. The pre-estimation analysis of the modified data revealed an improved (higher) correlation between size and effort (production line). However, although projects #11 to #14 were not outliers anymore with respect to MMRE, they still formed a visually outstanding cloud of data. A closer look at the project characteristics revealed that projects #11 to #14 were actually partly developed in C, while other projects were completely developed in Java. Since the current model did not include a cost factor that deals with the programming language, the enhancement of the causal model itself was to be the subject of the next improvement step.
PROD.2.2 Requirements stability
PROD.1.1 Importance of software accuracy PROD.1.2 Importance of system recoverability
PROD.2.1 Difficulty of requirements elicitation
PROD.2 Requirements controllability PROC.1 Disciplined requirements management
PROD.1 Importance of software reliability
PROC.2 Customer Participation
PROD.3 Software product complexity
Again, the post-estimation analysis showed further improvements in estimation accuracy and standard deviation (see 2nd iteration in Table 1). The results of the pre- and post-estimation analysis indicated that ambiguous data collection processes had a significant impact on the quality of the estimation model. In addition, several problems, such as a group of outstanding projects and contradictory expert assessments of past project data, remained unsolved.
PROJ.1 Clarity of project team roles and responsibilities
EFFORT PROD.5 Degree of product enhancement
PROJ.2 Development schedule constraints
PROD.4 Feasibility of software performance
3.4 Expert-based Model Improvement
PERS.5 Project manager’s experience and skills
PROD.9
PERS.6 Support by project external technical people
Reliability of technologies and products adopted
During the last iteration, we discovered several problems that could not be solved without the significant involvement of experts. Therefore, we decided to include experts in the next improvement steps. The objectives of the next improvement steps were to reveal the actual causes underlying the group of outlying projects (#16 and #11 to #14), to question the importance of the considered cost factors (especially Importance of software reliability), and to improve the validity of expert assessments.
PERS.2 Level of experience and knowledge PERS.2.3 PERS.2.1 Project development Application domain standards experience and PERS.2.2 knowledge experience and Platform experience knowledge and knowledge
3rd Iteration: This improvement cycle started with a joint meeting with experts. Experts concluded that the causal model was missing several important cost factors that make projects #16 and #11 to #14 outliers to other projects. According to the experts, this includes Support from project-external technical people and makes projects #11 to #14 different from all other projects. The Use of second programming language, identified during the analysis of measurement data in order to distinguish projects #11 to #14 from other projects, was not considered as a crucial cost factor. As far as project #16 is concerned, experts admitted that its context differs significantly from other projects considered. As already mentioned, project #16 was a re-development project building a whole software platform, whereas all other projects were newly developed projects or software enhancement projects based on that very platform. Therefore, experts approved the exclusion of this project from the model.
Figure 6: Improved Causal Model The pre-estimation analysis confirmed our concerns regarding the reliability of project data elicited from single experts. When acquired from multiple experts, the data showed significant inconsistencies. In several cases, experts gave extremely different evaluations of the same factor in the same project. The problem was solved by a joint experts’ meeting where involved experts discussed the data inconsistencies and came up with a common factor rating. Even though all experts participated and contributed to the detailed definition of the scales for each factor, there were still inconsistencies in interpreting the scales and related project situations. Because the measurement data was not changed, the issue of the outlying projects #11 to #14 remained unsolved. The post-estimation analysis showed a slight improvement in model accuracy. However, no improvement in estimation stability was observed (see 3rd iteration in Table 1). Moreover, the analysis of the nominal productivity revealed several data outliers. In principle, as mentioned in Section 2, the CoBRA® model is supposed to explain the variation of actual productivity across the projects considered. Therefore, nominal productivity should be constant and independent from project size. The improved model, however, was not able to explain this variability for several projects, especially #1, #3, #8, and #10.
The experts also decided to include several new cost factors in the model that cope with some characteristics of the now excluded project #16. These additional factors include, for instance, Degree of product enhancement in order to differentiate between new development and enhancement projects. They also decided that Importance of software reliability should remain in the model. As the result of the expert meeting, Figure 6 presents the improved causal model. The underlined factors (or the underlined parts of factor’s names) are those that were added to the initial model.
336
600
Estimation error (MdMRE)
120,00%
500
400
300
OLS
100,00%
80,00%
CoBRA
60,00%
40,00%
20,00%
0,00%
200
Initial model
1st impr.
2nd impr.
3rd impr.
4th impr.
4th impr. and #16
Improveme nt ste ps
100 50
Initial Median
1st impr.
25%-75 %
2nd impr. Non-Outlier Range
3rd impr.
4th impr.
Outliers
Figure 8: Improvement of Estimation Accuracy
Extremes 120,00%
Figure 7: Nominal Productivity Outliers
CoBRA
Prediction at level 25%
100,00%
4th Iteration: A deeper analysis of the past project characteristics revealed that projects that were outliers with respect to nominal productivity have a very large number of GUI (Graphical User Interface) elements and batches implemented. After discussing this problem with the experts, it turned out that the currently used size metric reflected only code directly implemented by software developers and did not include other elements of software size (such as the code generated for the GUI and batches). Experts agreed later on that even if, for instance, some parts of the software are generated, they still require a certain effort (e.g., for designing and testing). Thus, the objective of the next iteration was to improve the size metric used, to collect respective measurement data, and to rebuild the estimation model. You can find a scatter plot for updated size values in Figure 4.
OLS
80,00%
60,00%
40,00%
20,00%
0,00% Initial model
1st impr.
2nd impr.
3rd impr.
4th impr.
4th impr. and #16
Improvement Steps
Figure 9: Improvement of Estimation Consistency
3.6 Comparison to Linear Regression During our study, we also compared the estimation accuracy of Ordinary Least Square Regression (OLS) to that of the CoBRA® method (see Table 2). We did this because OLS is one of the simplest data-driven estimation techniques and one of the most frequently used ones.
The pre-estimation analysis of the improved measurement data did not reveal any specific issues. The post-estimation analysis of the rebuilt model showed further improvements of estimation accuracy and stability (see 4th iteration in Table 1). However, even for the new model, the nominal productivity was still not constant. We observed that the responsible projects were actually outliers with respect to the newly defined size measure. This could imply that there is still a cost factor related to project volume (such as team size) that is not yet explicitly considered in the causal model and could be a starting point for further model improvement.
Table 2: Performance of OLS Iteration
3.5 Summary of Model Improvement ®
Figure 8 and Figure 9 present a summary of the CoBRA model application throughout the four iterations. The overview shows constant improvement in estimation accuracy and consistency from one iteration to the next. In addition, numerous improvements in estimation-related processes were introduced. The measurement procedures were adjusted to consistently collect effort data for a uniquely defined project scope, and the size metric used was modified in order to fully quantify the size of the software development product that contributes to the overall project effort. Moreover, experts suggested that the model should be a part of the organization’s experience base [1], for instance, as a means for sharing cost-related knowledge with new employees.
MMRE
MdMRE
Pred(.25)
Std.Dev.
Initial
1.21
1.06
18.75%
0.91
1st
0.37
0.26
46.67%
0.30
2nd
0.25
0.31
46.67%
0.20
3rd
0.25
0.31
46.67%
0.20
4th
0.14
0.15
93.3%
0.07
4th and #16
0.17
0.18
87.5%
0.09
We observed that both methods improved significantly throughout the whole improvement cycle and finally achieved very similar performance results (compare Table 1 and Table 2). An interesting, but also foreseeable, observation is that the more homogeneous the project data are with respect to significant cost factors (e.g., after removing outlying project #16), the less discrepancy exists between the two methods. One known strength of CoBRA® [5] is that it is able to explain productivity variations across projects using the explicitly modeled causal relationships between the most significant cost and productivity factors. When the considered projects are very simi-
337
lar with respect to important cost factors and have a similar actual productivity, this main benefit of CoBRA® does not result in an improved estimation accuracy compared to OLS. In order to investigate this relationship, we performed an experiment in which we re-included outlying project #16 into the past project database and re-ran both methods on the dataset, because it had different characteristics than all other projects that had by then been considered in the cost model. The assumption was that CoBRA® would perform significantly better than OLS because it should be able to explain the productivity variations introduced by project #16 if the cost factors causing the productivity variation are part of the causal model. The last rows of Table 1 and Table 2 present the results of the experiment. As we can see, introducing only one outlying project increased the difference between both methods and illustrates the advantages of the CoBRA® approach. You can see a box plot of the estimation error introduced in Figure 10.
our study, the initial size metric reflected developed Java and C code only, whereas such software elements as batches, GUI windows, and reports were not included. The effort data should cover the same project activities consistently for all projects considered. If effort data is not available for all activities (for which an estimate should be computed), only those activities that are common to all projects should be considered or, alternatively, effort data should be normalized before applying it for estimation purposes. (L4) Reducing CoBRA® application costs is critical for industrial acceptance of the method, especially if the method is applied in an iterative manner. Therefore, we decided to start improvement based on measurement data exclusively (data-based model refinement) in order to minimize expert involvement and decrease refinement costs. (L5) It seems to be difficult to build the right cost model from the start. As we saw during the iterations, experts get new insight into cost factors, definition of size measures, and assessment of existing projects, if they discuss the results of the previous iterations. This seems to be a valuable input for work related to model improvement.
0.4 0.3 P01 0.2 0.1
5. RELATED WORK
0.0
Different types of estimation methods have been developed over the last years. They basically differ with respect to the type of data they require and the form of the estimation model they do provide. With respect to input data, we differentiate between three major groups: data-based, expert-based, and hybrid methods. Among those methods, some require past project data in order to build customized models (define-your-own-model approaches), others provide an already defined model, where factors and their relationships are fixed (fixed-model approaches). The major advantage of a fixed-model approach is that it does not require any data from already completed projects. Fixed models are developed for a specific context and are, by definition, only suited for estimating the types of projects for which the fixed model was built. The applicability of such models for different contexts is usually quite limited. In order to improve their performance, organizationspecific project data are required for calibrating the generic model in a specific application context. In contrast, define-your-ownmodel approaches use organization-specific project data in order to build a model that fits a certain organizational context. Yet, the required amount of data is not always available. From a logical point of view, hybrid methods should result in the greatest practical benefits, as they describe a middle way between data requirements and expert involvement.
-0.1 -0.2 -0.3
CoBRA Median
25%-75 %
OLS Non-Outlier Range
Outliers
Extremes
Figure 10: Comparison of CoBRA® and OLS on NonHomogenous Project Data We also applied a matched paired t-test and showed that the difference between the estimation errors of both methods is statistically different (p = 0.017).
4. LESSONS LEARNED In the following, we want to discuss some lessons learned from applying the CoBRA® method in an iterative manner: (L1) Sometimes, it is possible that experts are not able to identify all important cost factors at once. In this case, it is better to build an initial pilot model and interactively discuss model variances with experts using additional project characteristics in order to help identify missing and/or redundant cost factors.
Currently, more and more software organizations are attempting to reach level 3 of the Capability Maturity Model (CMM) [7], in which quantitative collection of measurement data plays a significant role. These companies usually started data collection, but still rely upon expert knowledge. This calls for hybrid methods, which comprehensively utilize all the kinds of knowledge available in a certain context, and thus neither require large measurement databases nor rely on subjective, purely people-based, estimates (e.g., the Delphi Method [9]). In recent years, various approaches combining both sources of knowledge have been developed (e.g., COCOMO II [2], Estor [20]).
(L2) Different experts usually have different views on past projects and understand definitions of cost factors slightly differently, and therefore come up with different ratings. So it makes sense to have at least two experts who rate a past project and extensively discuss each cost factor. (L3) Collecting valid measurement data is one of the most important factors influencing the reliability of the estimation model and its performance. With respect to CoBRA®, this does especially apply to the size measure, which should be well defined so that it reflects the overall project volume and not only parts; i.e., the size of all products developed in the project has to be considered. In
Empirical applications of hybrid approaches [22], [6] report on higher estimation accuracy and stability when compared to data-
338
(e.g., lines of code with/without blanks, comments, and reused lines). This means that the corresponding data collection processes have to be improved. Iterative model development, as performed in our study, allows identification of such problems while introducing the estimation method into the organization, and allows for improving data consistency as well as related measurement processes.
or expert-based methods. At the same time, they provide a theoretical basis for justifying the results of joint expert and databased estimation [2] in order to support the users of the estimates produced (e.g., project management and subcontractors). Moreover, hybrid methods have numerous indirect benefits. In addition to simple point estimates, the CoBRA® method, for instance, provides means for cost-related risk assessment and project benchmarking [5]. As a define-your-own-model approach, CoBRA® also provides means for goal-oriented improvement of existing measurement processes. The transparent structure of the model and the integrated sensitivity analysis allow for identifying factors with the greatest influence on software productivity and, in consequence, to focus improvement activities on related processes [5]. So the method does not only support continuous improvement of the model itself, but also improves cost-related organizational processes.
In summary, there exist only few studies that deal (at least to some extent) with iterative development of estimation models. Improvement is usually limited to model calibration. Hardly any study addresses model calibration in an industrial context.
6. CONCLUSION This paper presented the iterative development of a hybrid cost estimation model based on the CoBRA® method and aimed to provide industrial experiences on its application. The major outcomes of the conducted study were as follows: First, we showed that iterative model development improves estimation accuracy significantly. As we could see in Figure 8 and Figure 9, CoBRA® constantly improves over the model development iterations, starting from 120% MMRE down to 14%. Second, we gained evidence that CoBRA® performs well in the context of a typical Japanese software organization. As described in Section 3.5, CoBRA® could be perfectly applied to the new context and delivered quite good results (14% MMRE). Finally, we illustrated that CoBRA® is able to identify the major cost factors and help the company to collect appropriate measurement data and improve its processes with respect to the identified cost factors. During each iteration of the CoBRA® model improvement, weaknesses of the estimation model were discussed with respect to data validity and consistency as well as cost factors of the causal model. The related data collection processes were improved and the model was enhanced accordingly. At the end, we achieved a causal model that reflected the main drivers that influence costs and productivity for the company in accordance with the experts involved. As a result of the CoBRA® sensitivity analysis [5], this allows the company to exclusively focus on selected cost factors that have the greatest influence on productivity.
Software process improvement, as implemented by the Quality Improvement Paradigm (QIP) [1] or CMM(I) [7], places its emphasis on iterative improvement of processes and technologies – especially if they are newly introduced. However, common practice regarding cost estimation, known from published empirical studies [4], presents a different picture, as already stated in Section 1. In related empirical studies, the improvement of the cost model usually appears as a kind of calibration of fixed-model approaches [10], [2], [21], [25]. The calibration procedure is, in principle, running the model on past project data for which actual cost data is already known. Estimates obtained are then compared with the actual values and the average deviation becomes a correction factor for the model. Various works describe the need for model calibration and iterative model improvement, but currently, hardly any study presents such applications in an industrial environment of a specific organization [4]. Some empirical studies where model calibration was actually applied on industrial data are restricted to the analysis of residuals and to selecting appropriate adjustment factors [21]. However, the calibration factor obtained in such a way often does not result in satisfactory improvements in model performance [10], [16]. Other calibration methods refine models in a more comprehensive way. For instance, in [2] a generic COCOMO.81 model [3] is calibrated according to updated measurement data and expert knowledge. The calibration process consists of adjusting the list of cost factors within the model as well as related weights (so-called regression coefficients). Yet, such a kind of calibration might require a larger amount of project data [25], [19]. However, a single organization is seldom capable of gathering the required amount of data. In our study, we improved the CoBRA® model in several iterations, in a specific organizational context, using measurement data and expert knowledge. Model enhancement did not only affect the model parameters, but also the complete structure, i.e., including cost factors and their causal relationships.
The overall conclusion is that incremental development of an estimation model paid off in the presented context and significantly improved the estimation results. In addition, the benefits of CoBRA® compared to a simple data-based method like OLS will increase when inhomogeneous projects (with different contexts) have to be estimated. Future steps may include further improvement of the CoBRA® model at the company where the study was conducted as well as introducing CoBRA® to new domains and business units. From a methodological point of view, it makes sense to combine expert knowledge and a data-driven analysis method in order to improve model applicability and reliability (e.g., for determining cost factors). Apart from improving the accuracy of the estimation model, the chosen incremental approach had a positive effect on the organizational processes of the company and improved the knowledge and experience of the development team. This is an essential difference to other approaches, which improve the accuracy of the computed estimates exclusively (such as the one described by T. Menzies et al. [19]).
As described in the literature, the calibration of generic models in the context of a particular organization is often an unfeasible task, since a very substantial amount of data is required [17]. Thus, calibration is usually a single-step improvement, based on data from multiple organizations. As a consequence, the improvement of an estimation model usually does not consider such organization-specific aspects as process improvement or organization-wide learning. For instance, as stated in [15], bad performance of estimation models could be related to inconsistent size measurement
339
[9] Farquhar, J.A. A Preliminary Inquiry into the Software Estimation Process, RM-6271-PR, The Rand Corporation, August, 1970.
Finally, even though the improved model provided good estimates when applied on past project data, it should from now on be used to also estimate completely new projects of the company (in parallel to their usual approach for calculating the projects’ effort). As soon as the CoBRA® model gains more confidence from the project planning and management staff, the method should become an essential part of their decision support system. However, such a model should not be used as an authoritative oracle, but rather to support the project planner in coming up with an estimate. As our study has shown, it is very important to find the right cost drivers (as one critical influencing factor of the model’s accuracy). Because these cost drivers can change over time, it is necessary to establish a maintenance process for the estimation model in order to re-calibrate the model and re-increase estimation accuracy. The iterative approach shown in this paper could also be a valuable contribution towards supporting and enhancing these maintenance processes.
[10] Ferens, D., Christensen, D. Calibrating software cost models to Department of Defense Database: A review of ten studies. Journal of Parametrics, vol. 18, no. 1, 1998, pp. 55-74. [11] Gartner Inc. press releases, Gartner Survey of 1,300 CIOs Shows IT Budgets to Increase by 2.5 Percent in 2005, 14th January 2005, http://www.gartner.com/press_releases/pr2005.html. [12] Gartner Inc. press releases, Gartner Says Worldwide IT Services Revenue Grew 6.7 Percent in 2004, 8th February 2005, http://www.gartner.com/press_releases/pr2005.html. [13] Gelman A., Grlin, A., Stern, H., Rubin, D. Bayesian Data Analysis, Chapman Hall, 1995. [14] International Software Benchmarking Standards Group, The Benchmark Release 8, 2004, http://www.isbsg.org.
ACKNOWLEDGEMENTS
[15] Jeffery, D.R., Low, G.C. Calibrating estimation tools for software development, Software Engineering Journal, vol. 5, no. 4, 1990, pp. 215-222.
We would like to thank Oki Electric Industry Co., Ltd., where we conducted the study and applied CoBRA®, as well as all involved Oki experts and local organizers, who greatly contributed to the successful performance of the project. We would also like to thank the Japanese Information-technology Promotion Agency (IPA) for their personnel and financial support in conducting the case study.
[16] Kemerer, C.F. An empirical validation of software cost estimation models, Communications of ACM, vol. 30, May 1987, pp. 416-429. [17] Kitchenham, B.A., Taylor, N.R. Software Cost Models, ICL Technical Journal, May 1984.
REFERENCES
[18] Lother, M., Dumke, R. Point Metrics. Comparison and Analysis. In: Dumke/Abran: Current Trends in Software Measurement, Shaker Publ., Aachen, Germany, 2001, pp. 228-267.
[1] Basili, V.R., Caldiera, G., Rombach, H.D. Experience Factory; in: Marciniak J.J. (ed.), Encyclopedia of Software Engineering, vol. 1, John Wiley & Sons, 2001, pp. 511-519. [2] Boehm, B.W., Abts, C., Brown, A.W., Chulani, S., Clark, B.K., Horowitz, E., Madachy, R., Refer, D., Steece B. Software Cost Estimation with COCOMO II, Prentice Hall, 2000.
[19] Menzies, T., Port, D., Chen, Z., Hihn, J., Stukes, S. Validation methods for calibrating software effort models, Proceedings of the 27th international conference on Software engineering, 2005, pp. 587-595.
[3] Boehm, B.W. Software Engineering Economics, PrenticeHall, 1981.
[20] Mukhopadhyay, T., Vicinanza, S.S., Prietula, M.J. Examining the feasibility of a case-based reasoning model for software effort estimation, The Management Information Systems Quarterly, vol.16, no. 2, 1992, pp. 155-171.
[4] Briand, L.C., Wieczorek, I. Software Resource Estimation; in: Marciniak J.J. (ed.), Encyclopedia of Software Engineering, vol. 2, John Wiley & Sons, 2002, pp. 1160-1196.
[21] Putnam, L.H., Myers, W. Measures for Excellence, Reliable Software on Time, Within Budget, Yourdon Press, Englewood Cliffs N.J., 1992.
[5] Briand, L.C., El Emam, K., Bomarius, F. COBRA: A Hybrid Method for Software Cost Estimation, Benchmarking and Risk Assessment, Proceedings of the 20th International Conference on Software Engineering, 1998, pp. 390-399.
[22] Ruhe, M., Jeffery, R, Wieczorek, I. Cost estimation for web applications. Proceedings of the 25th International Conference on Software Engineering, Portland, Oregon, 2003, pp. 285-294.
[6] Chulani, S., Boehm, B., Steece, B. Bayesian analysis for the Empirical Software Engineering Cost Models. IEEE Transactions on Software Engineering, vol. 25, no. 4, 1999, pp. 573-583.
[23] Spector, P., Summated Rating Scale Construction, Sage Publications, 1992.
[7] CMMI Product Team. CMMISM for Systems Engineering/Software Engineering/Integrated Product and Process Development, Version 1.1 Staged Representation. (CMU/SEI-2002-TR-004). Pittsburgh, PA: Software Engineering Institute, Carnegie Mellon University, 2001.
[24] The Standish Group. CHAOS Chronicles, West Yarmouth, MA, The Standish Group International, Inc., 2003. [25] Van Genuchten, M., Koolen, H. On the use of software cost models, Information and Management, vol. 21, 1991, pp. 3744.
[8] Conte, S.D., Dunsmore, H.E., Shen, V.Y. Software engineering metrics and models. The Benjamin/Cummings Publishing company, Inc., 1986.
340